Exam 10: Estimation and Hypothesis Testing for Two Population Parameters
Exam 1: The Where, Why, and How of Data Collection167 Questions
Exam 2: Graphs, Charts and Tablesdescribing Your Data138 Questions
Exam 3: Describing Data Using Numerical Measures138 Questions
Exam 4: Introduction to Probability125 Questions
Exam 5: Discrete Probability Distributions161 Questions
Exam 6: Introduction to Continuous Probability Distributions122 Questions
Exam 7: Introduction to Sampling Distributions136 Questions
Exam 8: Estimating Single Population Parameters174 Questions
Exam 9: Introduction to Hypothesis Testing183 Questions
Exam 10: Estimation and Hypothesis Testing for Two Population Parameters121 Questions
Exam 11: Hypothesis Tests and Estimation for Population Variances69 Questions
Exam 12: Analysis of Variance162 Questions
Exam 13: Goodness-Of-Fit Tests and Contingency Analysis105 Questions
Exam 14: Introduction to Linear Regression and Correlation Analysis139 Questions
Exam 15: Multiple Regression Analysis and Model Building148 Questions
Exam 16: Analyzing and Forecasting Time-Series Data131 Questions
Exam 17: Introduction to Nonparametric Statistics103 Questions
Exam 18: Introducing Business Analytics48 Questions
Exam 19: Introduction to Decision Analysis48 Questions
Exam 20: Introduction to Quality and Statistical Process Control42 Questions
Select questions type
A market research firm has come up with two coupon designs that could be inserted into the envelopes that go out with the monthly statement to credit card customers. The coupons offer the customer an opportunity to become a member of a travel club. The research firm is interested in estimating the difference in proportion of customers who will join the club after receiving one or the other of the two coupons. To obtain this estimate, the research firm has sent out coupon design 1 to a random sample of 100 customers. A second random sample of 100 customers received coupon 2. For the first coupon, 11 customers joined the travel club, while 15 customers who received coupon 2 joined. Based upon this sample information, develop and interpret the desired 95 percent confidence interval estimate.
Free
(Essay)
4.8/5  (32)
(32)
Correct Answer: Verified
The parameter of interest in this situation is the difference in population proportions. The
general format for any confidence interval estimate is:
Point estimate ± critical value (standard error). 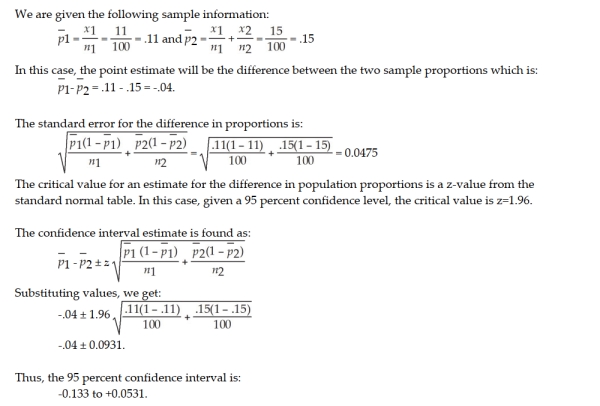 This indicates that we estimate the difference in proportions of redeemed coupons to be between -0.1331
and +0.0531. Thus, the range of possibilities for the difference in population proportions ranges from over
0.13 more for coupon 2 versus coupon 1 all the way to over 0.05 more for coupon 1 versus coupon 2.
Therefore, since the interval crosses zero, we are unable to conclude that a difference exists between the
two coupons with respect to the proportions that will be redeemed.
Box and whisker plots are often useful for determining whether two populations have distributions that might be skewed.
Free
(True/False)
5.0/5 (38)
Correct Answer:Verified
True
The NCAA is interested in estimating the difference in mean number of daily training hours for men and women athletes on college campuses. It wants 95 percent confidence and will select a sample of 10 men and 10 women for the study. The variances are assumed equal and the populations normally distributed. The sample results are: 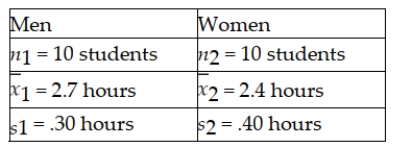 Based on these sample data, the estimate for the standard deviation of the sampling distribution is found by taking the square root of the sum of the two sample variances.
Free
(True/False)
4.9/5 (29)
Correct Answer:Verified
False
The t-distribution is still applicable even when there are small violations of the assumptions for the case when the variances for two populations are unknown. This is particularly true when the sample sizes are approximately equal.
(True/False)
4.8/5 (27)
Two samples are said to be independent if they are collected at different points in time.
(True/False)
4.7/5 (29)
The NCAA is interested in estimating the difference in mean number of daily training hours for men and women athletes on college campuses. It wants 95 percent confidence and will select a sample of 10 men and 10 women for the study. The variances are assumed equal and the populations normally distributed. The sample results are: 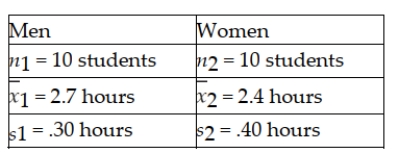 Based on these sample data, the critical value for developing the confidence interval is z = 1.96.
(True/False)
4.9/5 (38)
The following information is based on independent random samples taken from two normally distributed populations having equal variances: 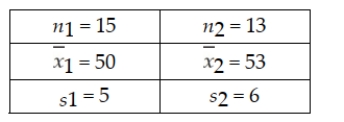 Based on the sample information, determine the 90% confidence interval estimate for the difference between the two population means.
(Multiple Choice)
4.9/5 (43)
The following information is based on independent random samples taken from two normally distributed populations having equal variances: 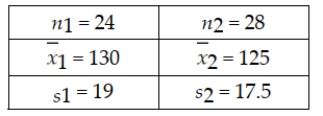 Based on the sample information, determine the 95% confidence interval estimate for the difference between the two population means.
(Multiple Choice)
4.9/5 (31)
Descent, Inc., produces a variety of climbing and mountaineering equipment. One of its products is a traditional three-strand climbing rope. An important characteristic of any climbing rope is its tensile strength. Descent produces the three-strand rope on two separate production lines: one in Bozeman and the other in Challis. The Bozeman line has recently installed new production equipment. Descent regularly tests the tensile strength of its ropes by randomly selecting ropes from production and subjecting them to various tests. The most recent random sample of ropes, taken after the new equipment was installed at the Bozeman plant, revealed the following: 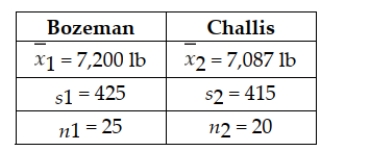 Descent's production managers are willing to assume that the population of tensile strengths for each plant is approximately normally distributed with equal variances. Based on the sample results, can Descent's managers conclude that there is a difference between the mean tensile strengths of ropes produced in Bozeman and Challis? Conduct the appropriate hypothesis test at the 0.05 level of significance.
(Multiple Choice)
4.9/5 (36)
When estimating the difference between two population means, when should the normal distribution be used and when should the t-distribution be used?
(Essay)
4.8/5 (37)
A recent study posed the question about whether Japanese managers are more motivated than American managers. A randomly selected sample of each was administered the Sarnoff Survey of Attitudes Toward Life (SSATL), which measures motivation for upward mobility. The SSATL scores are summarized below. 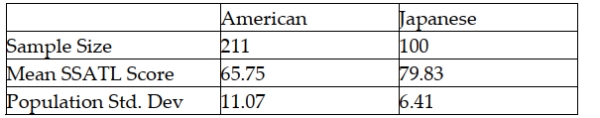 Judging from the way the data were collected, which test would likely be most appropriate?
(Multiple Choice)
4.8/5 (28)
All other things held constant, decreasing the level of confidence for a confidence interval estimate for the difference between two population means will result in a smaller margin of error.
(True/False)
4.9/5 (39)
A major retail clothing store is interested in estimating the difference in mean monthly purchases by customers who use the store's in-house credit card versus using a Visa, Mastercard, or one of the other major credit cards. To do this, it has randomly selected a sample of customers who have made one or more purchases with each of the types of credit cards. The following represents the results of the sampling: 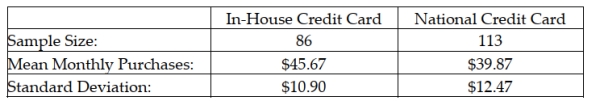 Suppose that the managers wished to test whether there is a statistical difference in the mean monthly purchases by customers using the two types of credit cards, using a significance level of .05, what is the value of the test statistic assuming the standard deviations are known?
(Multiple Choice)
4.8/5 (37)
In conducting a hypothesis test for the difference between two population means where the standard deviations are known and the null hypothesis is: H0 : μA - μβ ≥ 0 What is the p-value assuming that the test statistic has been found to be z = 2.52?
(Multiple Choice)
4.9/5 (30)
The NCAA is interested in estimating the difference in mean number of daily training hours for men and women athletes on college campuses. They want 95 percent confidence and will select a sample of 10 men and 10 women for the study. The sample results are: 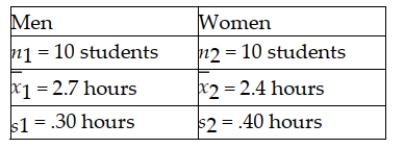 Based on these data, the point estimate is .30 hours.
(True/False)
4.8/5 (37)
A hypothesis test for the difference between two means is considered a two-tailed test when:
(Multiple Choice)
4.9/5 (32)
Recently the managers for a large retail department store stated that a study has revealed that female shoppers spend on average 23.5 minutes longer in the store per visit than do male shoppers. Based on this information, the managers can be confident that female shoppers, as a population, do spend longer times in the store than do males shoppers, as a population.
(True/False)
4.8/5 (32)
There have been complaints recently from homeowners in the north end claiming that their homes have been assessed at values that are too high compare with other parts of town. They say that the mean increase from last year to this year has been higher in their part of town than elsewhere. To test this, the assessor's office staff plans to select a random sample of north end properties (group 1) and a random sample of properties from other areas within the city (group 2) and perform a hypothesis test. The following sample information is available: 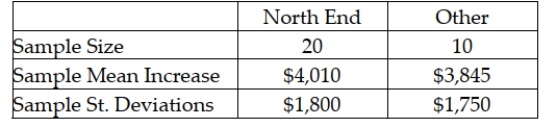 Assuming that the null hypothesis will be tested using an alpha level equal to 0.05, what is the value of the test statistic?
(Multiple Choice)
4.8/5 (32)
A paired sample study has been conducted to determine whether two populations have equal means. Twenty paired samples were obtained with the following sample results: 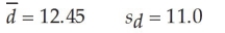 Based on these sample data and a significance level of 0.05, what conclusion should be made about the population means?
(Multiple Choice)
4.7/5 (38)
To find a confidence interval for the difference between the means of independent samples, when the variances are unknown but assumed equal, the sample sizes of the two groups must be the same.
(True/False)
4.8/5 (34)
Filters
- Essay(0)
- Multiple Choice(0)
- Short Answer(0)
- True False(0)
- Matching(0)