Deck 11: Hypothesis Tests and Estimation for Population Variances
Full screen (f)
Question
Question
Question
Question
Question
Question
Question
Question
Question
Question
Question
A machine that is used to fill soda pop cans with pop has an adjustable mean fill setting, but the standard deviation is not supposed to exceed 0.18 ounces. To make sure that this is the case, the managers at the beverage company each day select a random sample of n = 6 cans and measure the fill volume carefully. In one such case, the following data (ounces per can) were observed.  Based on these sample data, the test statistic is approximately χ2 = 5.01.
Based on these sample data, the test statistic is approximately χ2 = 5.01. Question
Question
Question
Question
Question
Question
Question
Question
Question
Question
One of the major automobile makers has developed two new engines. At question is whether the two engines have the same variability with respect to miles per gallon. To test this using a significance level equal to 0.10, the following information is available: 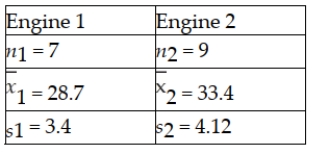 Based on this situation and the information provided, the critical value is F = 4.147 .
Based on this situation and the information provided, the critical value is F = 4.147 . Question
One of the major automobile makers has developed two new engines. At question is whether the two engines have the same variability with respect to miles per gallon. To test this, the following information is available: 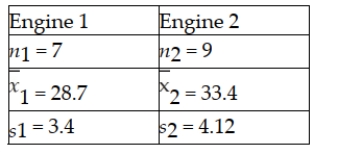 Based on this situation and the information provided, the test statistic is 1.2118.
Based on this situation and the information provided, the test statistic is 1.2118. Question
A frozen food company that makes burritos currently has employees making burritos by hand. It is considering purchasing equipment to automate the process and wants to determine if the automated process would result in lower variability of burrito weights. It takes a random sample from each process as shown below. 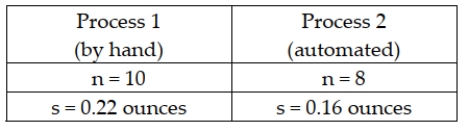 In conducting the hypothesis test, the test statistic is F = 1.375.
In conducting the hypothesis test, the test statistic is F = 1.375. Question
Question
Question
One of the key quality characteristics in many service environments is that the variation in service time be reasonably small. Recently, a major amusement park company initiated a new line system at one of its parks. It then wished to compare this new system with the old system in place at a comparable park in another state. At issue is whether the standard deviation in waiting time is less under the new line system than under the old line system. The following information was collected: 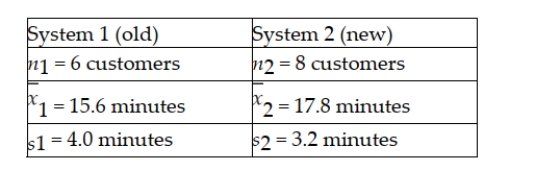 Assuming that it wishes to conduct the test using a 0.05 level of significance, the test statistic will be .
Assuming that it wishes to conduct the test using a 0.05 level of significance, the test statistic will be . Question
Question
One of the major automobile makers has developed two new engines. At question is whether the two engines have the same variability with respect to miles per gallon. To test this using a 0.10 level of significance, the following information is available: 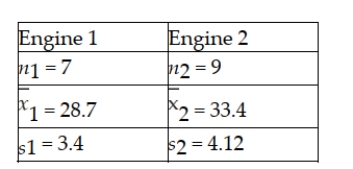 Based on this situation and the information provided, the null hypothesis cannot be rejected and it is possible that the two engines produce the same variation in mpg.
Based on this situation and the information provided, the null hypothesis cannot be rejected and it is possible that the two engines produce the same variation in mpg. Question
Question
One of the major automobile makers has developed two new engines. At question is whether the two engines have the same variability with respect to miles per gallon. To test this, the following information is available: 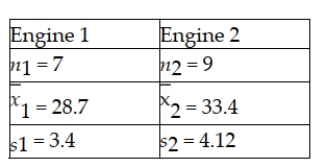 Based on this situation and the information provided, the appropriate null and alternative hypotheses are:
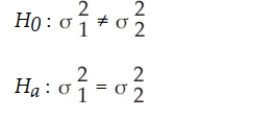
Based on this situation and the information provided, the appropriate null and alternative hypotheses are: Question
A frozen food company that makes burritos currently has employees making burritos by hand. It is considering purchasing equipment to automate the process and wants to determine if the automated process would result in lower variability of burrito weights. It takes a random sample from each process as shown below. 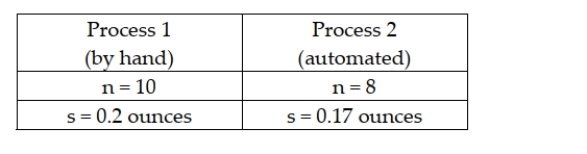 To conduct a hypothesis test using a 0.05 level of significance, the critical value is 3.347.
To conduct a hypothesis test using a 0.05 level of significance, the critical value is 3.347. Question
Question
A frozen food company that makes burritos currently has employees making burritos by hand. It is considering purchasing equipment to automate the process and wants to determine if the automated process would result in lower variability of burrito weights. To conduct a hypothesis test using a 0.05 level of significance, the proper format for the null and alternative hypotheses is (where the current by- hand process is process 1 and the automated process is process 2). 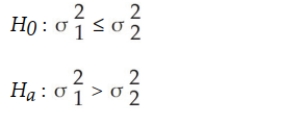
Question
Question
Question
Question
One of the key quality characteristics in many service environments is that the variation in service time be reasonably small. Recently, a major amusement park company initiated a new line system at one of its parks. It then wished to compare this new system with the old system in place at a comparable park in another state. At issue is whether the standard deviation in waiting time is less under the new line system than under the old line system. The following information was collected: 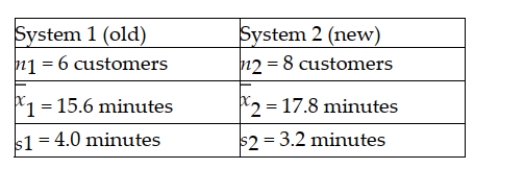 Assuming that it wishes to conduct the test using a 0.05 level of significance, the null hypothesis should be rejected since the test statistic exceeds the F-critical value from the F-distribution table.
Assuming that it wishes to conduct the test using a 0.05 level of significance, the null hypothesis should be rejected since the test statistic exceeds the F-critical value from the F-distribution table. Question
Question
One of the key quality characteristics in many service environments is that the variation in service time be reasonably small. Recently, a major amusement park company initiated a new line system at one of its parks. It then wished to compare this new system with the old system in place at a comparable park in another state. At issue is whether the standard deviation in waiting time is less under the new line system than under the old line system. The following information was collected: 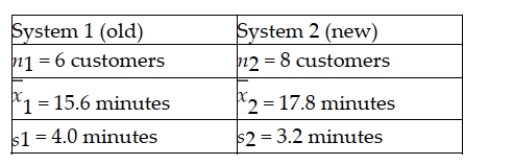 Assuming that it wishes to conduct the test using a 0.05 level of significance, the correct null and alternative hypotheses would be:
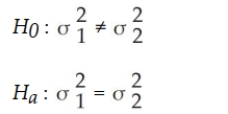
Assuming that it wishes to conduct the test using a 0.05 level of significance, the correct null and alternative hypotheses would be: Question
Question
Question
It is believed that the SAT scores for students entering two state universities may have different standard deviations. Specifically, it is believed that the standard deviation at University A is greater than the standard deviation at University B. To test this using an alpha = 0.05 level, a sample of 14 student SAT scores from University A was selected and a sample of 8 SAT scores from University B was selected. The following sample results were observed: 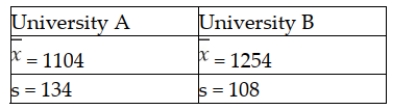 Based on this information, what is the value of the test statistic?
A) 1.2407
B) 0.6496
C) 1.5394
D) None of the above.
Based on this information, what is the value of the test statistic?A) 1.2407
B) 0.6496
C) 1.5394
D) None of the above.
Question
Question
Which of the following is the appropriate null hypothesis when testing whether two population variances are equal?
A)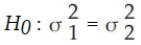
B)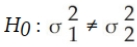
C)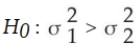
D)
A)
B)
C)
D)
Question
There is interest at the American Savings and Loan as to whether there is a difference between average daily balances in checking accounts that are joint accounts (two or more members per account) versus single accounts (one member per account). To test this, a random sample of checking accounts was selected with the following results: 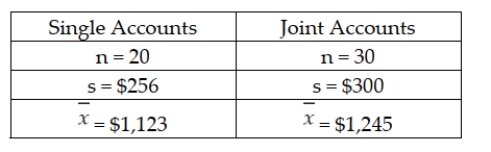 Based upon these data, if tested using a significance level equal to 0.10, the assumption of equal population variances should be rejected.
Based upon these data, if tested using a significance level equal to 0.10, the assumption of equal population variances should be rejected. Question
It is believed that the SAT scores for students entering two state universities may have different standard deviations. Specifically, it is believed that the standard deviation at University A is greater than the standard deviation at University B. If a statistical test is to be conducted, which of the following would be the proper way to formulate the null hypothesis?
A)
B)
C)
D)
A)
B)
C)
D)
Question
Question
A potato chip manufacturer has found that in the past the standard deviation of bag weight has been 0.2 ounce. They want to test whether the standard deviation has changed. The null hypothesis is:
A)
B)
C)
D)
A)
B)
C)
D)
Question
To test the following hypotheses at the 0.05 level of significance, using a sample size of n = 15.  What is the upper tail critical value?
A) 23.685
B) 24.996
C) 27.488
D) 26.119
What is the upper tail critical value?A) 23.685
B) 24.996
C) 27.488
D) 26.119
Question
Question
An analyst plans to test whether the standard deviation for the time it takes bank tellers to provide service to customers exceeds the standard of 1.5 minutes. The correct null and alternative hypotheses for this test are:
A)
B)
C)
D)
A)
B)
C)
D)
Question
Question
If a hypothesis test for a single population variance is to be conducted using a significance level of 0.10, a sample size of n = 16, and the test is a one-tailed upper-tail test, the critical value is:
A)
B)
C)
D)
A)
B)
C)
D)
Question
The Russet Potato Company has been working on the development of a new potato seed that is hoped to be an improvement over the existing seed that is being used. Specifically, the company hopes that the new seed will result in less variability in individual potato length than the existing seed without reducing the mean length. To test whether this is the case, a sample of each seed is used to grow potatoes to maturity. The following information is given:
The correct null hypothesis for testing whether the variability of the new seed is less than the old seed is:
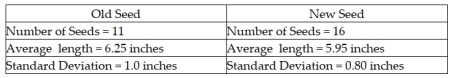
A)
B)
C)
D)
The correct null hypothesis for testing whether the variability of the new seed is less than the old seed is:
A)
B)
C)
D)
Question
Question
Question
It is believed that the SAT scores for students entering two state universities may have different standard deviations. Specifically, it is believed that the standard deviation at University A is greater than the standard deviation at University B. To test this using an alpha = 0.05 level, a sample of 14 student SAT scores from University A was selected and a sample of 8 SAT scores from University B was selected. The following sample results were observed: 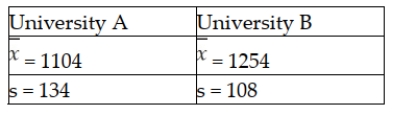 Based on this information, what is the critical value that will be used to test the hypothesis?
A) = 3.55
B) = 2.832
C) z = 1.645
D) = 3.237
Based on this information, what is the critical value that will be used to test the hypothesis?A) = 3.55
B) = 2.832
C) z = 1.645
D) = 3.237
Question
Question
There is interest at the American Savings and Loan as to whether there is a difference between average daily balances in checking accounts that are joint accounts (two or more members per account) versus single accounts (one member per account). To test this, a random sample of checking accounts was selected with the following results: 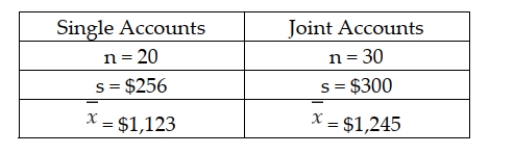 Based upon these data, the test statistic for testing whether the two populations have equal variances is F = 1.3733.
Based upon these data, the test statistic for testing whether the two populations have equal variances is F = 1.3733. Question
Question
A PC company uses two suppliers for rechargeable batteries for its notebook computers. Two factors are important quality features of the batteries: mean use time and variation. It is desirable that the mean use time be high and the variability be low. Recently, the PC maker conducted a test on batteries from the two suppliers. In the test, 9 randomly selected batteries from Supplier 1 were tested and 12 randomly selected batteries from Supplier 2 were tested. The following results were observed: 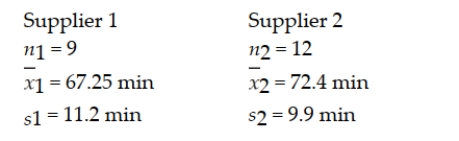 Based on these sample results, can the PC maker conclude that a difference exists between the two batteries with respect to the population standard deviations? Test using a 0.10 level of significance.
Based on these sample results, can the PC maker conclude that a difference exists between the two batteries with respect to the population standard deviations? Test using a 0.10 level of significance. Question
Question
Question
There are two major companies that provide SAT test tutoring for high school students. At issue is whether Company 1, which has been in business for the longer time, provides better results than Company 2, the newer company. Specifically of interest is whether the mean increase in SAT scores for students who have already taken the SAT test one time is higher for Company 1 than for Company 2. Two random samples of students are selected. The following data reflect the number of points higher (or lower) that the students scored on the SAT test after taking the tutoring. Prior to conducting the test, which compares the means, we should determine if the assumption of equal variances is supported. Conduct the appropriate hypothesis test to determine if the assumption of equal variances is supported using a 0.10 level of significance. 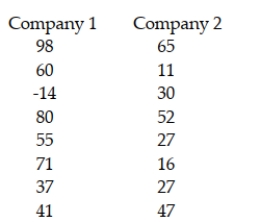
Question
The U.S. Golf Association provides a number of services for its members. One of these is the evaluation of golf equipment to make sure that the equipment satisfies the rules of golf. For example, they regularly test the golf balls made by the various companies that sell balls in the United States. Recently, they undertook a study of two brands of golf balls with the objective to see whether there is a difference in the mean distance that the two golf ball brands will fly off the tee. To conduct the test, the U.S.G.A. uses a robot named "Iron Byron," which swings the club at the same speed and with the same swing pattern each time it is used. The following data reflect sample data for a random sample of balls of each brand.  Given this information, what is the test statistic for testing whether the two population variances are equal?
A) Approximately F = 1.145
B) t = 1.96
C) t = -4.04
D) None of the above
Given this information, what is the test statistic for testing whether the two population variances are equal?A) Approximately F = 1.145
B) t = 1.96
C) t = -4.04
D) None of the above
Question
The Russet Potato Company has been working on the development of a new potato seed that is hoped to be an improvement over the existing seed that is being used. Specifically, the company hopes that the new seed will result in less variability in individual potato length than the existing seed without reducing the mean length. To test whether this is the case, a sample of each seed is used to grow potatoes to maturity. The following information is given: 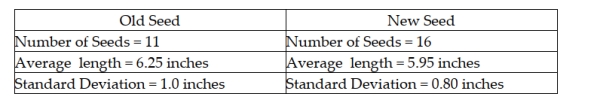 The on these data, if the hypothesis test is conducted using a 0.05 level of significance, the calculated test statistic is:
A) = 1.25
B) = 0.80
C) = 0.64
D) = 1.56
The on these data, if the hypothesis test is conducted using a 0.05 level of significance, the calculated test statistic is:A) = 1.25
B) = 0.80
C) = 0.64
D) = 1.56
Question
The Department of Weights and Measures in a southern state has the responsibility for making sure that all commercial weighing and measuring devices are working properly. For example, when a gasoline pump indicates that 1 gallon has been pumped, it is expected that 1 gallon of gasoline will actually have been pumped. The problem is that there is variation in the filling process. The state's standards call for the mean amount of gasoline to be 1.0 gallon with a standard deviation not to exceed 0.010 gallons. Recently, the department came to a gasoline station and filled 10 cans until the pump read 1.0 gallon. It then measured precisely the amount of gasoline in each can. The following data were recorded: 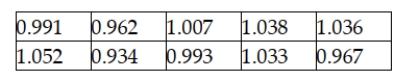 Based on these data, what should the Department of Weights and Measures conclude if it wishes to test whether the standard deviation exceeds 0.010 gallons or not, using a 0.05 level of significance?
Based on these data, what should the Department of Weights and Measures conclude if it wishes to test whether the standard deviation exceeds 0.010 gallons or not, using a 0.05 level of significance? Question
Question
A PC company uses two suppliers for rechargeable batteries for its notebook computers. Two factors are important quality features of the batteries: mean use time and variation. It is desirable that the mean use time be high and the variability be low. Recently, the PC maker conducted a test on batteries from the two suppliers. In the test, 9 randomly selected batteries from Supplier 1 were tested and 12 randomly selected batteries from Supplier 2 were tested. The following results were observed: 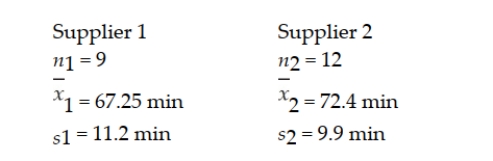 Based on these sample results, can the PC maker conclude that a difference exists between the two batteries with respect to the population mean use time? Test using a 0.10 level of significance.
Based on these sample results, can the PC maker conclude that a difference exists between the two batteries with respect to the population mean use time? Test using a 0.10 level of significance.
Unlock Deck
Sign up to unlock the cards in this deck!
Unlock Deck
Unlock Deck
1/69
Play
Full screen (f)
Deck 11: Hypothesis Tests and Estimation for Population Variances
1
The test statistic that is used when testing a null hypothesis for a population variance is the standard normal z-value.
False
2
In a two-tailed hypothesis test for the difference between two population variances, if s1 = 3 and s2 = 5, then the test statistic is F = 2.7778.
True
3
Assume a sample of size n = 12 has been collected. To perform a hypothesis test of a population variance using a 0.05 level of significance, where the null hypothesis is: H0 : σ2 = 25 The upper tail critical value is 21.92.
True
4
The managers for a fruit juice facility claim that the standard deviation for the ounces per bottle on the new automated line is not the same as the older manual line. Given this, the correct null and alternative hypotheses for performing the statistical test are: H0 : σ1 = σ2 Ha : σ1 ≠ σ2
Unlock Deck
Unlock for access to all 69 flashcards in this deck.
Unlock Deck
k this deck
5
In a hypothesis test involving two population variances, if the null hypothesis states that the two variances are strictly equal, then the test statistic is a chi-square statistic.
Unlock Deck
Unlock for access to all 69 flashcards in this deck.
Unlock Deck
k this deck
6
In a two-tailed hypothesis test for the difference between two population variances, if s1 = 3 and s2 = 5, then the test statistic is F = 1.6667.
Unlock Deck
Unlock for access to all 69 flashcards in this deck.
Unlock Deck
k this deck
7
A contract calls for the strength of a steel rod to stand up to pressure of 200 lbs per square inch on average. The contract also requires that the variability in strength for individual steel rods be no more than 5 pounds per square inch. If a random sample of n = 15 rods is selected and the sample standard deviation is 6.7 pounds, the test statistic is approximately χ2 = 25.138.
Unlock Deck
Unlock for access to all 69 flashcards in this deck.
Unlock Deck
k this deck
8
The central location and shape of the chi-square distribution depend only on the population variance.
Unlock Deck
Unlock for access to all 69 flashcards in this deck.
Unlock Deck
k this deck
9
One of the most important aspects of quality improvement is the idea of reducing the variability in a product or service. For instance, a major bank has worked to reduce the variability in the service time at the drive-through. The managers believe that the standard deviation in service time should not exceed 30 seconds. To test whether this goal is being achieved, a random sample of n = 25 cars is selected each week and the service time for each car is measured. Last week, the mean time was 345 seconds with a standard deviation equal to 38 seconds. Given this information, if the significance level is 0.10, the critical value from the chi-square table is about 34.3.
Unlock Deck
Unlock for access to all 69 flashcards in this deck.
Unlock Deck
k this deck
10
A one-tailed hypothesis test for a population variance always has the rejection region in the upper tail.
Unlock Deck
Unlock for access to all 69 flashcards in this deck.
Unlock Deck
k this deck
11
A machine that is used to fill soda pop cans with pop has an adjustable mean fill setting, but the standard deviation is not supposed to exceed 0.18 ounces. To make sure that this is the case, the managers at the beverage company each day select a random sample of n = 6 cans and measure the fill volume carefully. In one such case, the following data (ounces per can) were observed. Based on these sample data, the test statistic is approximately χ2 = 5.01.
Based on these sample data, the test statistic is approximately χ2 = 5.01. Unlock Deck
Unlock for access to all 69 flashcards in this deck.
Unlock Deck
k this deck
12
In a hypothesis test for the equality of two variances, the lower-tail critical value does not need to be found as long as the larger sample variance is placed in the denominator of the test statistic.
Unlock Deck
Unlock for access to all 69 flashcards in this deck.
Unlock Deck
k this deck
13
When using a chi-square test for the variance of one population, we are assuming that the population is normally distributed.
Unlock Deck
Unlock for access to all 69 flashcards in this deck.
Unlock Deck
k this deck
14
A potato chip manufacturer has two packaging lines and wants to determine if the variances differ between the two lines. They take a sample of n= 15 bags from each line and find the following: The value of the test statistic is F = 1.5
Unlock Deck
Unlock for access to all 69 flashcards in this deck.
Unlock Deck
k this deck
15
In a two-tailed hypothesis test for the difference between two population variances, the test statistic is an F-ratio formed by putting the larger sample variance in numerator.
Unlock Deck
Unlock for access to all 69 flashcards in this deck.
Unlock Deck
k this deck
16
The F-distribution is used to test whether two sample variances are equal.
Unlock Deck
Unlock for access to all 69 flashcards in this deck.
Unlock Deck
k this deck
17
If we are interested in performing a one-tailed, upper-tail hypothesis test about a population variance where the level of significance is .01 and the sample size is n = 25, the critical chi-square value to be used is 42.9798.
Unlock Deck
Unlock for access to all 69 flashcards in this deck.
Unlock Deck
k this deck
18
For a given significance level, increasing the sample size will make the chi-square distribution more skewed.
Unlock Deck
Unlock for access to all 69 flashcards in this deck.
Unlock Deck
k this deck
19
The variance in the diameter of a bolt should not exceed 0.500 mm. A random sample of n = 12 bolts showed a sample variance of 0.505 mm. The test statistic is χ2 = 11.11.
Unlock Deck
Unlock for access to all 69 flashcards in this deck.
Unlock Deck
k this deck
20
In a two-tailed test for the equality of two variances, the critical value is determined by going to the F- distribution table with an upper-tail area equal to alpha divided by two.
Unlock Deck
Unlock for access to all 69 flashcards in this deck.
Unlock Deck
k this deck
21
One of the major automobile makers has developed two new engines. At question is whether the two engines have the same variability with respect to miles per gallon. To test this using a significance level equal to 0.10, the following information is available: Based on this situation and the information provided, the critical value is F = 4.147 .
Based on this situation and the information provided, the critical value is F = 4.147 . Unlock Deck
Unlock for access to all 69 flashcards in this deck.
Unlock Deck
k this deck
22
One of the major automobile makers has developed two new engines. At question is whether the two engines have the same variability with respect to miles per gallon. To test this, the following information is available: Based on this situation and the information provided, the test statistic is 1.2118.
Based on this situation and the information provided, the test statistic is 1.2118. Unlock Deck
Unlock for access to all 69 flashcards in this deck.
Unlock Deck
k this deck
23
A frozen food company that makes burritos currently has employees making burritos by hand. It is considering purchasing equipment to automate the process and wants to determine if the automated process would result in lower variability of burrito weights. It takes a random sample from each process as shown below. In conducting the hypothesis test, the test statistic is F = 1.375.
In conducting the hypothesis test, the test statistic is F = 1.375. Unlock Deck
Unlock for access to all 69 flashcards in this deck.
Unlock Deck
k this deck
24
The logic behind the F-test for testing whether two populations have equal variances is to determine whether sample variances computed from random samples selected from the two populations differ due to sampling error, or whether the difference is more than can be attributed to sampling error alone, in which case, we conclude that the populations have different variances.
Unlock Deck
Unlock for access to all 69 flashcards in this deck.
Unlock Deck
k this deck
25
If a one-tailed F-test is employed when testing a null hypothesis about two population variances, the test statistic is an F-value formed by taking the ratio of the two sample variances so that the sample variance predicted to be larger is placed in the numerator.
Unlock Deck
Unlock for access to all 69 flashcards in this deck.
Unlock Deck
k this deck
26
One of the key quality characteristics in many service environments is that the variation in service time be reasonably small. Recently, a major amusement park company initiated a new line system at one of its parks. It then wished to compare this new system with the old system in place at a comparable park in another state. At issue is whether the standard deviation in waiting time is less under the new line system than under the old line system. The following information was collected: Assuming that it wishes to conduct the test using a 0.05 level of significance, the test statistic will be .
Assuming that it wishes to conduct the test using a 0.05 level of significance, the test statistic will be . Unlock Deck
Unlock for access to all 69 flashcards in this deck.
Unlock Deck
k this deck
27
A first step in testing whether two populations have the same mean value using the t-distribution is to use the chi-square distribution to test whether the populations have equal variances.
Unlock Deck
Unlock for access to all 69 flashcards in this deck.
Unlock Deck
k this deck
28
One of the major automobile makers has developed two new engines. At question is whether the two engines have the same variability with respect to miles per gallon. To test this using a 0.10 level of significance, the following information is available: Based on this situation and the information provided, the null hypothesis cannot be rejected and it is possible that the two engines produce the same variation in mpg.
Based on this situation and the information provided, the null hypothesis cannot be rejected and it is possible that the two engines produce the same variation in mpg. Unlock Deck
Unlock for access to all 69 flashcards in this deck.
Unlock Deck
k this deck
29
Similar to the chi-square distribution, all F-tests are one-tailed tests.
Unlock Deck
Unlock for access to all 69 flashcards in this deck.
Unlock Deck
k this deck
30
One of the major automobile makers has developed two new engines. At question is whether the two engines have the same variability with respect to miles per gallon. To test this, the following information is available: Based on this situation and the information provided, the appropriate null and alternative hypotheses are:
Based on this situation and the information provided, the appropriate null and alternative hypotheses are: Unlock Deck
Unlock for access to all 69 flashcards in this deck.
Unlock Deck
k this deck
31
A frozen food company that makes burritos currently has employees making burritos by hand. It is considering purchasing equipment to automate the process and wants to determine if the automated process would result in lower variability of burrito weights. It takes a random sample from each process as shown below. To conduct a hypothesis test using a 0.05 level of significance, the critical value is 3.347.
To conduct a hypothesis test using a 0.05 level of significance, the critical value is 3.347. Unlock Deck
Unlock for access to all 69 flashcards in this deck.
Unlock Deck
k this deck
32
A potato chip manufacturer has two packaging lines and wants to determine if the variances differ between the two lines. They take samples of n1 = 10 bags from line 1 and n2 = 8 bags from line 2. To perform the hypothesis test at the 0.05 level of significance, the critical value is F = 3.68.
Unlock Deck
Unlock for access to all 69 flashcards in this deck.
Unlock Deck
k this deck
33
A frozen food company that makes burritos currently has employees making burritos by hand. It is considering purchasing equipment to automate the process and wants to determine if the automated process would result in lower variability of burrito weights. To conduct a hypothesis test using a 0.05 level of significance, the proper format for the null and alternative hypotheses is (where the current by- hand process is process 1 and the automated process is process 2).
Unlock Deck
Unlock for access to all 69 flashcards in this deck.
Unlock Deck
k this deck
34
The null hypothesis that two population variances are equal will tend to be rejected if the ratio of the sample variances from each population is substantially larger than 1.0.
Unlock Deck
Unlock for access to all 69 flashcards in this deck.
Unlock Deck
k this deck
35
A two-tailed test for two population variances could have a null hypothesis like the following: H0 : =
Unlock Deck
Unlock for access to all 69 flashcards in this deck.
Unlock Deck
k this deck
36
In a test for determining whether two population variances are the same or different, the larger the sample sizes from the two populations, the lower will be the chance of making a Type I statistical error.
Unlock Deck
Unlock for access to all 69 flashcards in this deck.
Unlock Deck
k this deck
37
One of the key quality characteristics in many service environments is that the variation in service time be reasonably small. Recently, a major amusement park company initiated a new line system at one of its parks. It then wished to compare this new system with the old system in place at a comparable park in another state. At issue is whether the standard deviation in waiting time is less under the new line system than under the old line system. The following information was collected: Assuming that it wishes to conduct the test using a 0.05 level of significance, the null hypothesis should be rejected since the test statistic exceeds the F-critical value from the F-distribution table.
Assuming that it wishes to conduct the test using a 0.05 level of significance, the null hypothesis should be rejected since the test statistic exceeds the F-critical value from the F-distribution table. Unlock Deck
Unlock for access to all 69 flashcards in this deck.
Unlock Deck
k this deck
38
In a two-tailed hypothesis test involving two population variances, if the null hypothesis is true then the F-test statistic should be approximately equal to 1.0.
Unlock Deck
Unlock for access to all 69 flashcards in this deck.
Unlock Deck
k this deck
39
One of the key quality characteristics in many service environments is that the variation in service time be reasonably small. Recently, a major amusement park company initiated a new line system at one of its parks. It then wished to compare this new system with the old system in place at a comparable park in another state. At issue is whether the standard deviation in waiting time is less under the new line system than under the old line system. The following information was collected: Assuming that it wishes to conduct the test using a 0.05 level of significance, the correct null and alternative hypotheses would be:
Assuming that it wishes to conduct the test using a 0.05 level of significance, the correct null and alternative hypotheses would be: Unlock Deck
Unlock for access to all 69 flashcards in this deck.
Unlock Deck
k this deck
40
The F-distribution can only have negative values.
Unlock Deck
Unlock for access to all 69 flashcards in this deck.
Unlock Deck
k this deck
41
When a hypothesis test is to be conducted regarding a population variance, the test statistic will be:
A) a t-value from the t-distribution.
B) an x2 value from the chi-square distribution.
C) a z-value from the standard normal distribution.
D) a binomial distribution p value.
A) a t-value from the t-distribution.
B) an x2 value from the chi-square distribution.
C) a z-value from the standard normal distribution.
D) a binomial distribution p value.
Unlock Deck
Unlock for access to all 69 flashcards in this deck.
Unlock Deck
k this deck
42
It is believed that the SAT scores for students entering two state universities may have different standard deviations. Specifically, it is believed that the standard deviation at University A is greater than the standard deviation at University B. To test this using an alpha = 0.05 level, a sample of 14 student SAT scores from University A was selected and a sample of 8 SAT scores from University B was selected. The following sample results were observed: Based on this information, what is the value of the test statistic?
A) 1.2407
B) 0.6496
C) 1.5394
D) None of the above.
Based on this information, what is the value of the test statistic?A) 1.2407
B) 0.6496
C) 1.5394
D) None of the above.
Unlock Deck
Unlock for access to all 69 flashcards in this deck.
Unlock Deck
k this deck
43
The F test statistic for testing whether the variances of two populations are the same is always positive.
Unlock Deck
Unlock for access to all 69 flashcards in this deck.
Unlock Deck
k this deck
44
Which of the following is the appropriate null hypothesis when testing whether two population variances are equal?
A)
B)
C)
D)
A)
B)
C)
D)
Unlock Deck
Unlock for access to all 69 flashcards in this deck.
Unlock Deck
k this deck
45
There is interest at the American Savings and Loan as to whether there is a difference between average daily balances in checking accounts that are joint accounts (two or more members per account) versus single accounts (one member per account). To test this, a random sample of checking accounts was selected with the following results: Based upon these data, if tested using a significance level equal to 0.10, the assumption of equal population variances should be rejected.
Based upon these data, if tested using a significance level equal to 0.10, the assumption of equal population variances should be rejected. Unlock Deck
Unlock for access to all 69 flashcards in this deck.
Unlock Deck
k this deck
46
It is believed that the SAT scores for students entering two state universities may have different standard deviations. Specifically, it is believed that the standard deviation at University A is greater than the standard deviation at University B. If a statistical test is to be conducted, which of the following would be the proper way to formulate the null hypothesis?
A)
B)
C)
D)
A)
B)
C)
D)
Unlock Deck
Unlock for access to all 69 flashcards in this deck.
Unlock Deck
k this deck
47
A fast food restaurant that sells burritos is concerned about the variability in the amount of filling that different employees place in the burritos. To achieve product consistency it needs this variability to be no more than 1.7 ounces. A sample of n = 18 burritos showed a sample variance of 2.89 ounces. Using a 0.10 level of significance, what can you conclude?
A) The standards are being met since (test statistic) < (critical value).
B) The standards are not being met since (test statistic) > (critical value).
C) The standards are being met since (test statistic) > (critical value).
D) The standards are not being met since (test statistic) < (critical value).
Unlock Deck
Unlock for access to all 69 flashcards in this deck.
Unlock Deck
k this deck
48
A potato chip manufacturer has found that in the past the standard deviation of bag weight has been 0.2 ounce. They want to test whether the standard deviation has changed. The null hypothesis is:
A)
B)
C)
D)
A)
B)
C)
D)
Unlock Deck
Unlock for access to all 69 flashcards in this deck.
Unlock Deck
k this deck
49
To test the following hypotheses at the 0.05 level of significance, using a sample size of n = 15. What is the upper tail critical value?
A) 23.685
B) 24.996
C) 27.488
D) 26.119
What is the upper tail critical value?A) 23.685
B) 24.996
C) 27.488
D) 26.119
Unlock Deck
Unlock for access to all 69 flashcards in this deck.
Unlock Deck
k this deck
50
A manufacturer of industrial plywood has a contract to supply a boat maker with a large amount of plywood. One of the specifications calls for the standard deviation in thickness to not exceed .03 inch. A sample of n = 30 sheets was sampled randomly from a recent production run. The mean thickness was right at the 3/4 inch target thickness and the sample standard deviation was .05 inch. Testing at the 0.05 level of significance, which of the following is true?
A) The test statistic is approximately 80.56.
B) The critical value is approximately χ2 = 43.773.
C) The test statistic is approximately 48.333.
D) Based on the sample data, there is no evidence to suggest that the plywood is not meeting the specifications.
A) The test statistic is approximately 80.56.
B) The critical value is approximately χ2 = 43.773.
C) The test statistic is approximately 48.333.
D) Based on the sample data, there is no evidence to suggest that the plywood is not meeting the specifications.
Unlock Deck
Unlock for access to all 69 flashcards in this deck.
Unlock Deck
k this deck
51
An analyst plans to test whether the standard deviation for the time it takes bank tellers to provide service to customers exceeds the standard of 1.5 minutes. The correct null and alternative hypotheses for this test are:
A)
B)
C)
D)
A)
B)
C)
D)
Unlock Deck
Unlock for access to all 69 flashcards in this deck.
Unlock Deck
k this deck
52
When conducting a one-tailed hypothesis test of a population variance using a sample size of n = 24 and a 0.10 level of significance, the critical value is:
A) 32.0069
B) 35.1725
C) 33.1962
D) 36.4150
A) 32.0069
B) 35.1725
C) 33.1962
D) 36.4150
Unlock Deck
Unlock for access to all 69 flashcards in this deck.
Unlock Deck
k this deck
53
If a hypothesis test for a single population variance is to be conducted using a significance level of 0.10, a sample size of n = 16, and the test is a one-tailed upper-tail test, the critical value is:
A)
B)
C)
D)
A)
B)
C)
D)
Unlock Deck
Unlock for access to all 69 flashcards in this deck.
Unlock Deck
k this deck
54
The Russet Potato Company has been working on the development of a new potato seed that is hoped to be an improvement over the existing seed that is being used. Specifically, the company hopes that the new seed will result in less variability in individual potato length than the existing seed without reducing the mean length. To test whether this is the case, a sample of each seed is used to grow potatoes to maturity. The following information is given:
The correct null hypothesis for testing whether the variability of the new seed is less than the old seed is:
A)
B)
C)
D)
The correct null hypothesis for testing whether the variability of the new seed is less than the old seed is:
A)
B)
C)
D)
Unlock Deck
Unlock for access to all 69 flashcards in this deck.
Unlock Deck
k this deck
55
If the variance of the contents of cans of orange juice is significantly more than 0.003, the manager has to order to stop the filling machine. A sample of 26 cans of orange juice showed a standard deviation of 0.06 ounce. Based on the sample and at the 0.05 level of significance, the filling machine should be
A) stopped.
B) kept going.
C) upgraded.
D) downgraded.
A) stopped.
B) kept going.
C) upgraded.
D) downgraded.
Unlock Deck
Unlock for access to all 69 flashcards in this deck.
Unlock Deck
k this deck
56
Which distribution is used in testing the hypotheses about the equality of two population variances?
A) z-distribution
B) F-distribution
C) x2 distribution
D) t-distribution
A) z-distribution
B) F-distribution
C) x2 distribution
D) t-distribution
Unlock Deck
Unlock for access to all 69 flashcards in this deck.
Unlock Deck
k this deck
57
It is believed that the SAT scores for students entering two state universities may have different standard deviations. Specifically, it is believed that the standard deviation at University A is greater than the standard deviation at University B. To test this using an alpha = 0.05 level, a sample of 14 student SAT scores from University A was selected and a sample of 8 SAT scores from University B was selected. The following sample results were observed: Based on this information, what is the critical value that will be used to test the hypothesis?
A) = 3.55
B) = 2.832
C) z = 1.645
D) = 3.237
Based on this information, what is the critical value that will be used to test the hypothesis?A) = 3.55
B) = 2.832
C) z = 1.645
D) = 3.237
Unlock Deck
Unlock for access to all 69 flashcards in this deck.
Unlock Deck
k this deck
58
A consulting report that was recently submitted to a company indicated that a hypothesis test for a single population variance was conducted. The report indicated that the test statistic was 34.79, the hypothesized variance was 345 and the sample variance 600. However, the report did not indicate what the sample size was. What was it?
A) n = 100
B) Approximately n = 18
C) Approximately 21
D) Can't be determined without knowing what alpha is.
A) n = 100
B) Approximately n = 18
C) Approximately 21
D) Can't be determined without knowing what alpha is.
Unlock Deck
Unlock for access to all 69 flashcards in this deck.
Unlock Deck
k this deck
59
There is interest at the American Savings and Loan as to whether there is a difference between average daily balances in checking accounts that are joint accounts (two or more members per account) versus single accounts (one member per account). To test this, a random sample of checking accounts was selected with the following results: Based upon these data, the test statistic for testing whether the two populations have equal variances is F = 1.3733.
Based upon these data, the test statistic for testing whether the two populations have equal variances is F = 1.3733. Unlock Deck
Unlock for access to all 69 flashcards in this deck.
Unlock Deck
k this deck
60
If a hypothesis test for a single population variance is to be conducted, which of the following statements is true?
A) The null hypothesis must be stated in terms of the population variance.
B) The chi-square distribution is used.
C) If the sample size is increased, the critical value is also increased for a given level of statistical significance.
D) All of the above are true.
A) The null hypothesis must be stated in terms of the population variance.
B) The chi-square distribution is used.
C) If the sample size is increased, the critical value is also increased for a given level of statistical significance.
D) All of the above are true.
Unlock Deck
Unlock for access to all 69 flashcards in this deck.
Unlock Deck
k this deck
61
A PC company uses two suppliers for rechargeable batteries for its notebook computers. Two factors are important quality features of the batteries: mean use time and variation. It is desirable that the mean use time be high and the variability be low. Recently, the PC maker conducted a test on batteries from the two suppliers. In the test, 9 randomly selected batteries from Supplier 1 were tested and 12 randomly selected batteries from Supplier 2 were tested. The following results were observed: Based on these sample results, can the PC maker conclude that a difference exists between the two batteries with respect to the population standard deviations? Test using a 0.10 level of significance.
Based on these sample results, can the PC maker conclude that a difference exists between the two batteries with respect to the population standard deviations? Test using a 0.10 level of significance. Unlock Deck
Unlock for access to all 69 flashcards in this deck.
Unlock Deck
k this deck
62
A small business owner has two fast food restaurants. The owner wants to determine if there is any difference in the variability of service times at the drive-thru window of each restaurant. A sample of size n = 9 is taken from each restaurant's drive-thru window. To perform a hypothesis test using the 0.05 level of significance the critical value is:
A) 3.438
B) 3.197
C) 4.026
D) 4.433
A) 3.438
B) 3.197
C) 4.026
D) 4.433
Unlock Deck
Unlock for access to all 69 flashcards in this deck.
Unlock Deck
k this deck
63
In performing a one-tailed test for the difference between two population variances, which of the following statements is true?
A) The level of alpha needs to be doubled before finding the F-critical value in the table.
B) The sample variance that is predicted to be larger in the alternative hypothesis goes in the numerator when forming the F-test statistic.
C) You always place the larger of the two sample variances in the numerator.
D) The alternative hypothesis must contain the equality.
Unlock Deck
Unlock for access to all 69 flashcards in this deck.
Unlock Deck
k this deck
64
There are two major companies that provide SAT test tutoring for high school students. At issue is whether Company 1, which has been in business for the longer time, provides better results than Company 2, the newer company. Specifically of interest is whether the mean increase in SAT scores for students who have already taken the SAT test one time is higher for Company 1 than for Company 2. Two random samples of students are selected. The following data reflect the number of points higher (or lower) that the students scored on the SAT test after taking the tutoring. Prior to conducting the test, which compares the means, we should determine if the assumption of equal variances is supported. Conduct the appropriate hypothesis test to determine if the assumption of equal variances is supported using a 0.10 level of significance.
Unlock Deck
Unlock for access to all 69 flashcards in this deck.
Unlock Deck
k this deck
65
The U.S. Golf Association provides a number of services for its members. One of these is the evaluation of golf equipment to make sure that the equipment satisfies the rules of golf. For example, they regularly test the golf balls made by the various companies that sell balls in the United States. Recently, they undertook a study of two brands of golf balls with the objective to see whether there is a difference in the mean distance that the two golf ball brands will fly off the tee. To conduct the test, the U.S.G.A. uses a robot named "Iron Byron," which swings the club at the same speed and with the same swing pattern each time it is used. The following data reflect sample data for a random sample of balls of each brand. Given this information, what is the test statistic for testing whether the two population variances are equal?
A) Approximately F = 1.145
B) t = 1.96
C) t = -4.04
D) None of the above
Given this information, what is the test statistic for testing whether the two population variances are equal?A) Approximately F = 1.145
B) t = 1.96
C) t = -4.04
D) None of the above
Unlock Deck
Unlock for access to all 69 flashcards in this deck.
Unlock Deck
k this deck
66
The Russet Potato Company has been working on the development of a new potato seed that is hoped to be an improvement over the existing seed that is being used. Specifically, the company hopes that the new seed will result in less variability in individual potato length than the existing seed without reducing the mean length. To test whether this is the case, a sample of each seed is used to grow potatoes to maturity. The following information is given: The on these data, if the hypothesis test is conducted using a 0.05 level of significance, the calculated test statistic is:
A) = 1.25
B) = 0.80
C) = 0.64
D) = 1.56
The on these data, if the hypothesis test is conducted using a 0.05 level of significance, the calculated test statistic is:A) = 1.25
B) = 0.80
C) = 0.64
D) = 1.56
Unlock Deck
Unlock for access to all 69 flashcards in this deck.
Unlock Deck
k this deck
67
The Department of Weights and Measures in a southern state has the responsibility for making sure that all commercial weighing and measuring devices are working properly. For example, when a gasoline pump indicates that 1 gallon has been pumped, it is expected that 1 gallon of gasoline will actually have been pumped. The problem is that there is variation in the filling process. The state's standards call for the mean amount of gasoline to be 1.0 gallon with a standard deviation not to exceed 0.010 gallons. Recently, the department came to a gasoline station and filled 10 cans until the pump read 1.0 gallon. It then measured precisely the amount of gasoline in each can. The following data were recorded: Based on these data, what should the Department of Weights and Measures conclude if it wishes to test whether the standard deviation exceeds 0.010 gallons or not, using a 0.05 level of significance?
Based on these data, what should the Department of Weights and Measures conclude if it wishes to test whether the standard deviation exceeds 0.010 gallons or not, using a 0.05 level of significance? Unlock Deck
Unlock for access to all 69 flashcards in this deck.
Unlock Deck
k this deck
68
Two toy companies are being compared with respect to the time it takes them to build a popular wooden train set. The study is interested in determining whether there is a difference in the variability between the two toy companies production times. They wish to conduct the hypothesis test using an alpha = 0.05. If random samples of 20 train sets are selected from each toy company, what is the appropriate F critical value?
A) 2.526
B) 2.938
C) 2.168
D) 2.124
A) 2.526
B) 2.938
C) 2.168
D) 2.124
Unlock Deck
Unlock for access to all 69 flashcards in this deck.
Unlock Deck
k this deck
69
A PC company uses two suppliers for rechargeable batteries for its notebook computers. Two factors are important quality features of the batteries: mean use time and variation. It is desirable that the mean use time be high and the variability be low. Recently, the PC maker conducted a test on batteries from the two suppliers. In the test, 9 randomly selected batteries from Supplier 1 were tested and 12 randomly selected batteries from Supplier 2 were tested. The following results were observed: Based on these sample results, can the PC maker conclude that a difference exists between the two batteries with respect to the population mean use time? Test using a 0.10 level of significance.
Based on these sample results, can the PC maker conclude that a difference exists between the two batteries with respect to the population mean use time? Test using a 0.10 level of significance. Unlock Deck
Unlock for access to all 69 flashcards in this deck.
Unlock Deck
k this deck
Unlock Deck
Unlock for access to all 69 flashcards in this deck.


