Exam 11: Hypothesis Tests and Estimation for Population Variances
A PC company uses two suppliers for rechargeable batteries for its notebook computers. Two factors are important quality features of the batteries: mean use time and variation. It is desirable that the mean use time be high and the variability be low. Recently, the PC maker conducted a test on batteries from the two suppliers. In the test, 9 randomly selected batteries from Supplier 1 were tested and 12 randomly selected batteries from Supplier 2 were tested. The following results were observed: 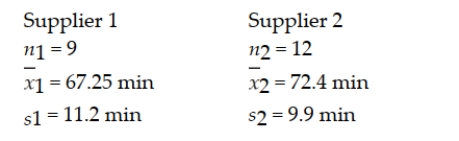 Based on these sample results, can the PC maker conclude that a difference exists between the two batteries with respect to the population standard deviations? Test using a 0.10 level of significance.
Ideally, we would like to test whether the two population standard deviations are equal.
However, there is no test available for doing this test directly. Instead, we must convert to variances and
perform the F-test. The following null and alternative hypotheses would be appropriate in this situation: 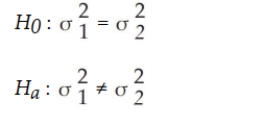 This will be a two-tailed test since we are testing to see whether a difference exists and are not predicting
which battery will have more or less variability. In a two-tailed test of variances, the test statistic is an F-
value that is formed by the ratio of the two sample variances and by placing the larger sample variance in
the numerator: 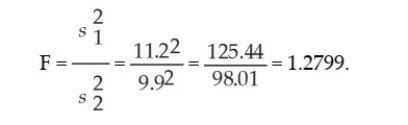 We then compare this value to a critical value from the F-distribution table. Since this is a two-tailed test
with alpha = 0.10, we use the table with 0.05 in the upper-tail of the F-distribution.
Two sets of degrees of freedom are used with the F-distribution. Across the top of the F-table we look for
degrees of freedom corresponding to n-1 where n is the sample size associated with the sample variance
that was placed in the numerator of the F-test statistic. In our case, n = 9, so the degrees of freedom is 9 - 1
= 8 for the numerator. The degrees of freedom down the side in the F-table is n-1 where n corresponds to
the sample size for the sample variance in the denominator of the F-test statistic. In our case, that would
be n = 12. Thus, the denominator degrees of freedom are 12 - 1 = 11. Then the critical F from the 0.05 table
with 8 and 11 degrees of freedom is 2.948. The decision rule is:
If F calculated > 2.948 reject H0, otherwise do not reject.
Since our calculated F-test statistic is F = 1.2799 < 2.948, we do not reject the null hypothesis. Thus, based
on the sample information, we have no basis for believing that there is a difference in the two batteries
with respect to variability in use time.
A small business owner has two fast food restaurants. The owner wants to determine if there is any difference in the variability of service times at the drive-thru window of each restaurant. A sample of size n = 9 is taken from each restaurant's drive-thru window. To perform a hypothesis test using the 0.05 level of significance the critical value is:
D
In a two-tailed hypothesis test involving two population variances, if the null hypothesis is true then the F-test statistic should be approximately equal to 1.0.
True
Two toy companies are being compared with respect to the time it takes them to build a popular wooden train set. The study is interested in determining whether there is a difference in the variability between the two toy companies production times. They wish to conduct the hypothesis test using an alpha = 0.05. If random samples of 20 train sets are selected from each toy company, what is the appropriate F critical value?
It is believed that the SAT scores for students entering two state universities may have different standard deviations. Specifically, it is believed that the standard deviation at University A is greater than the standard deviation at University B. If a statistical test is to be conducted, which of the following would be the proper way to formulate the null hypothesis?
One of the major automobile makers has developed two new engines. At question is whether the two engines have the same variability with respect to miles per gallon. To test this, the following information is available: 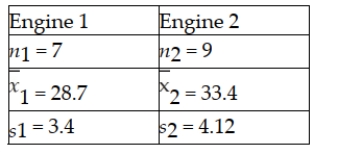 Based on this situation and the information provided, the test statistic is 1.2118.
A frozen food company that makes burritos currently has employees making burritos by hand. It is considering purchasing equipment to automate the process and wants to determine if the automated process would result in lower variability of burrito weights. It takes a random sample from each process as shown below. 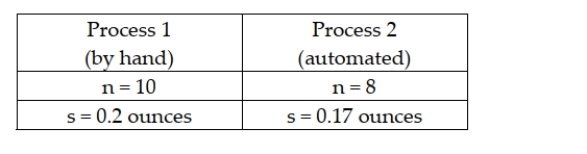 To conduct a hypothesis test using a 0.05 level of significance, the critical value is 3.347.
There are two major companies that provide SAT test tutoring for high school students. At issue is whether Company 1, which has been in business for the longer time, provides better results than Company 2, the newer company. Specifically of interest is whether the mean increase in SAT scores for students who have already taken the SAT test one time is higher for Company 1 than for Company 2. Two random samples of students are selected. The following data reflect the number of points higher (or lower) that the students scored on the SAT test after taking the tutoring. Prior to conducting the test, which compares the means, we should determine if the assumption of equal variances is supported. Conduct the appropriate hypothesis test to determine if the assumption of equal variances is supported using a 0.10 level of significance. 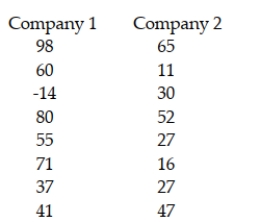
The Russet Potato Company has been working on the development of a new potato seed that is hoped to be an improvement over the existing seed that is being used. Specifically, the company hopes that the new seed will result in less variability in individual potato length than the existing seed without reducing the mean length. To test whether this is the case, a sample of each seed is used to grow potatoes to maturity. The following information is given: 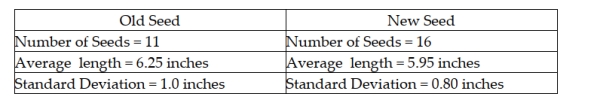 The on these data, if the hypothesis test is conducted using a 0.05 level of significance, the calculated test statistic is:
There is interest at the American Savings and Loan as to whether there is a difference between average daily balances in checking accounts that are joint accounts (two or more members per account) versus single accounts (one member per account). To test this, a random sample of checking accounts was selected with the following results: 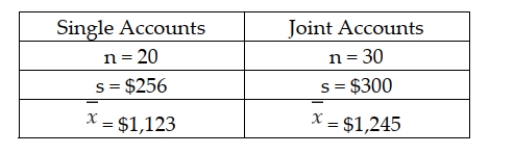 Based upon these data, the test statistic for testing whether the two populations have equal variances is F = 1.3733.
For a given significance level, increasing the sample size will make the chi-square distribution more skewed.
If a hypothesis test for a single population variance is to be conducted, which of the following statements is true?
In a two-tailed hypothesis test for the difference between two population variances, the test statistic is an F-ratio formed by putting the larger sample variance in numerator.
There is interest at the American Savings and Loan as to whether there is a difference between average daily balances in checking accounts that are joint accounts (two or more members per account) versus single accounts (one member per account). To test this, a random sample of checking accounts was selected with the following results: 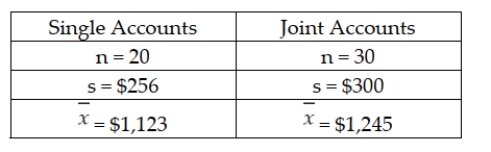 Based upon these data, if tested using a significance level equal to 0.10, the assumption of equal population variances should be rejected.
In a hypothesis test involving two population variances, if the null hypothesis states that the two variances are strictly equal, then the test statistic is a chi-square statistic.
When using a chi-square test for the variance of one population, we are assuming that the population is normally distributed.
The managers for a fruit juice facility claim that the standard deviation for the ounces per bottle on the new automated line is not the same as the older manual line. Given this, the correct null and alternative hypotheses for performing the statistical test are: H0 : σ1 = σ2 Ha : σ1 ≠ σ2
In a two-tailed hypothesis test for the difference between two population variances, if s1 = 3 and s2 = 5, then the test statistic is F = 2.7778.
One of the major automobile makers has developed two new engines. At question is whether the two engines have the same variability with respect to miles per gallon. To test this using a significance level equal to 0.10, the following information is available: 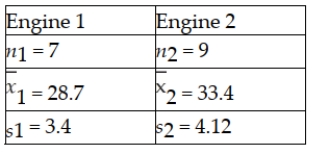 Based on this situation and the information provided, the critical value is F = 4.147 .
The logic behind the F-test for testing whether two populations have equal variances is to determine whether sample variances computed from random samples selected from the two populations differ due to sampling error, or whether the difference is more than can be attributed to sampling error alone, in which case, we conclude that the populations have different variances.
Filters
- Essay(0)
- Multiple Choice(0)
- Short Answer(0)
- True False(0)
- Matching(0)