Deck 14: Multiple Regression and Correlation Analysis
Full screen (f)
Question
Question
Question
Question
Question
Question
Question
Question
Question
Question
Question
Question
Question
Question
Question
Question
Question
Question
Question
Question
Question
Canadian Accounting classifies accounts receivable as "current", "late", and "not collectible".
Industry figures show that 60% of A/R are current, 30% are late, and 10% are uncollectible. A law
firm in Markham Ontario has 500 accounts receivable: 320 are current, 100 are late and 80 are not
Collectible. Are these numbers in agreement with the industry distribution?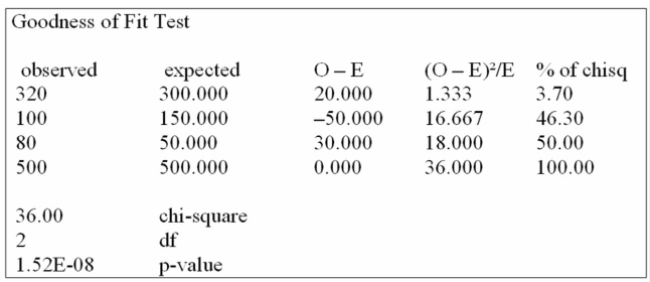
Using the data from this Megastat printout, you determine:
A) the Markham firm's data reflect the national average, when tested at the 0.10 level of significance.
B) the Markham firm's data reflect the national average, when tested at the 0.05 level of significance.
C) the Markham firm's data reflect the national average, when tested at the 0.01 level of significance.
D) the Markham firm's data do not reflect the national average, when tested above a 0.01 level of significance.
Question
Question
A student asked a statistics professor if grades were marked "on the curve." The professor decided
To give the student a project to determine if last year's statistics grades were normally distributed.
The professor told the student that last year's mean mark was 70 with a standard deviation of 10
And to use the following results.
What is the expected number of C's?
A) 39.25
B) 34.13
C) 13.59
D) 30.00
E) 15.87
Question
Question
Question
Question
Question
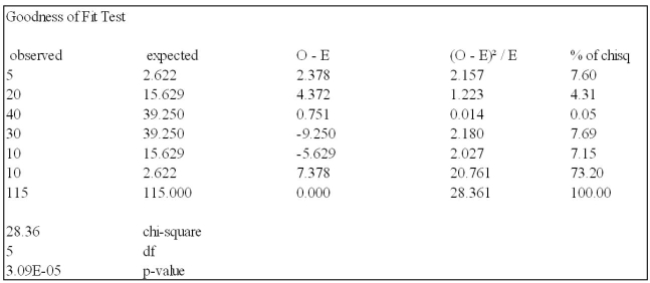
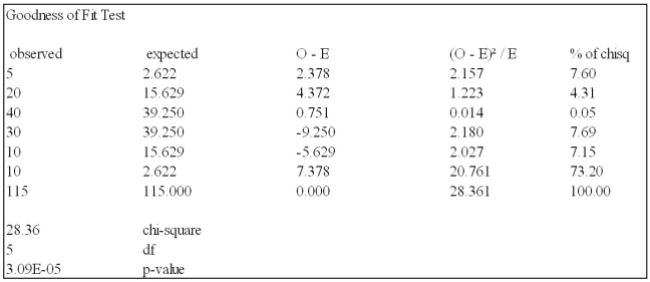
A student asked a statistics professor if grades were marked "on the curve." The professor decided
To give the student a project to determine if last year's statistics grades were normally distributed.
The professor told the student that last year's mean mark was 70 with a standard deviation of 10
And to use the following results.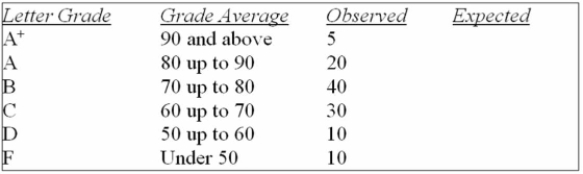
What is the calculated value of chi-square?
A) 29.76
B) 14.20
C) 14.88
D) 28.36
E) 12.59
Question
Canadian Accounting classifies accounts receivable as "current", "late", and "not collectible".
Industry figures show that 60% of A/R are current, 30% are late, and 10% are uncollectible. A law
firm in Markham Ontario has 500 accounts receivable: 320 are current, 120 are late and 60 are not
Collectible. Are these numbers in agreement with the industry distribution?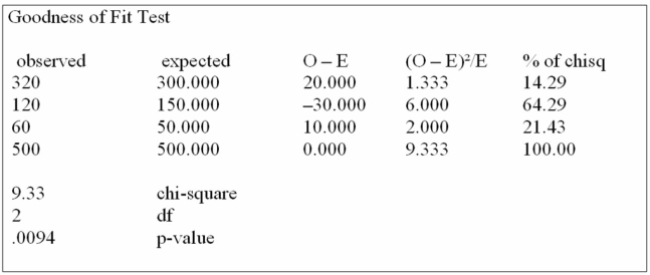
Using the data from this Megastat printout, you determine:
A) the Markham firm's data reflect the national average, when tested at the 0.10 level of significance.
B) the Markham firm's data reflect the national average, when tested at the 0.05 level of significance.
C) the Markham firm's data reflect the national average, when tested at the 0.01 level of significance.
D) the Markham firm's data do not reflect the national average, when tested above a 0.01 level of significance.
Question
A student asked a statistics professor if grades were marked "on the curve." The professor decided
To give the student a project to determine if last year's statistics grades were normally distributed.
The professor told the student that last year's mean mark was 70 with a standard deviation of 10
And to use the following results.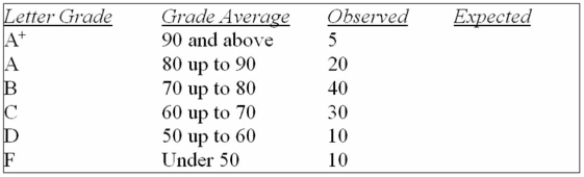
What is the critical value of chi-square at the 0.05 level?
A) 12.833
B) 11.070
C) 12.592
D) 14.449
E) 19.675
Question
A student asked a statistics professor if grades were marked "on the curve." The professor decided
To give the student a project to determine if last year's statistics grades were normally distributed.
The professor told the student that last year's mean mark was 70 with a standard deviation of 10
And to use the following results.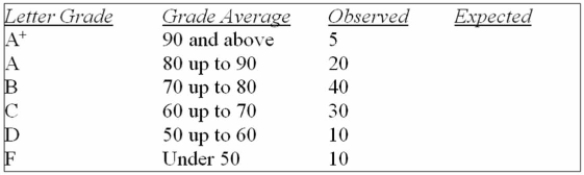
What is the alternative hypothesis?
A) The letter grades are evenly distributed.
B) The letter grades are not evenly distributed.
C) The letter grades are normally distributed.
D) The letter grades are not normally distributed.
E) The letter grades are unfairly distributed.
Question
Canadian Accounting classifies accounts receivable as "current", "late", and "not collectible".
Industry figures show that 60% of A/R are current, 30% are late, and 10% are uncollectible. A law
firm in Markham Ontario has 500 accounts receivable: 310 are current, 125 are late and 65 are not
Collectible. Are these numbers in agreement with the industry distribution?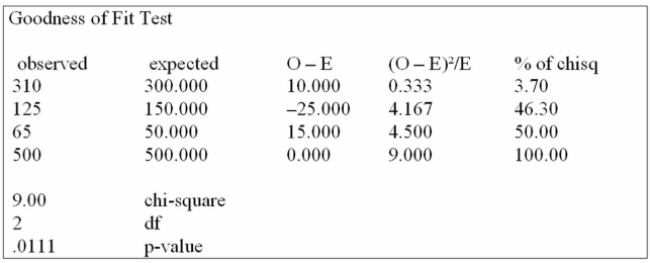
Using the data from this Megastat printout, you determine:
A) the Markham firm's data reflect the national average, when tested at the 0.10 level of significance.
B) the Markham firm's data reflect the national average, when tested at the 0.05 level of significance.
C) the Markham firm's data reflect the national average, when tested at the 0.01 level of significance.
D) the Markham firm's data do not reflect the national average, when tested above a 0.01 level of significance.
Question
A student asked a statistics professor if grades were marked "on the curve." The professor decided
To give the student a project to determine if last year's statistics grades were normally distributed.
The professor told the student that last year's mean mark was 70 with a standard deviation of 10
And to use the following results.
What is your decision if α = 0.05?
A) The letter grades are evenly distributed.
B) The letter grades are not evenly distributed.
C) The letter grades are normally distributed.
D) The letter grades are not normally distributed.
E) The letter grades are unfairly distributed.
Question
Question
A student asked a statistics professor if grades were marked "on the curve." The professor decided
To give the student a project to determine if last year's statistics grades were normally distributed.
The professor told the student that last year's mean mark was 70 with a standard deviation of 10
And to use the following results.
What is the expected number of grades above B?
A) 18.25
B) 20.00
C) 13.59
D) 15.87
E) 15.63
Question
Question
A student asked a statistics professor if grades were marked "on the curve." The professor decided
To give the student a project to determine if last year's statistics grades were normally distributed.
The professor told the student that last year's mean mark was 70 with a standard deviation of 10
And to use the following results.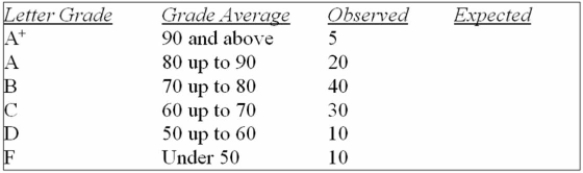
What is the expected number of F's?
A) 10.00
B) 2.28
C) 2.62
D) 13.59
E) 4.56
Question
Question
A student asked a statistics professor if grades were marked "on the curve." The professor decided
To give the student a project to determine if last year's statistics grades were normally distributed.
The professor told the student that last year's mean mark was 70 with a standard deviation of 10
And to use the following results.
What is your decision if α = 0.05?
A) The letter grades are evenly distributed.
B) The letter grades are not evenly distributed.
C) The letter grades are normally distributed.
D) The letter grades are not normally distributed.
E) The letter grades are unfairly distributed.
Question
A student asked a statistics professor if grades were marked "on the curve." The professor decided
To give the student a project to determine if last year's statistics grades were normally distributed.
The professor told the student that last year's mean mark was 70 with a standard deviation of 10
And to use the following results.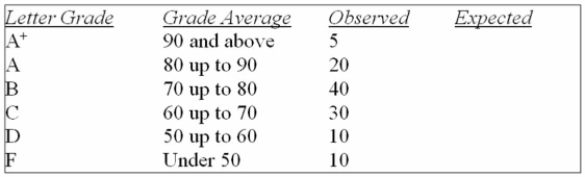
Using the data from this Megastat printout, you determine:
A) the letter grades are evenly distributed when tested at the 0.05 level of significance.
B) the letter grades are not normally distributed when tested at the 0.01 level of significance.
C) the letter grades are normally distributed when tested at the 0.05 level of significance.
D) the letter grades are not normally distributed when tested at the 0.05 level of significance.
E) the letter grades are not normally distributed when tested at either the 0.01 or 0.05 level of significance.
Question
Question
Question
Question
Question
Question
A distributor of personal computers has five locations in the city. The sales in units for the first
Quarter of the year were as follows: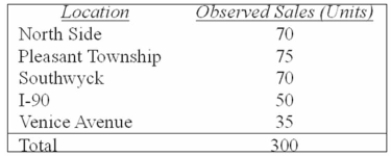
What is the critical value at the 0.01 level of risk?
A) 7.779
B) 15.033
C) 13.277
D) 5.412
Quarter of the year were as follows:
What is the critical value at the 0.01 level of risk?
A) 7.779
B) 15.033
C) 13.277
D) 5.412
Question
Question
Question
Question
Question
Question
Question
Question
Question
Question
Question
Question
Question
Question
Question
Question
At a recent car show, a sample of 125 people produced the following results. Use the 0.05
Significance level to determine if there is a relationship between age and model preferred.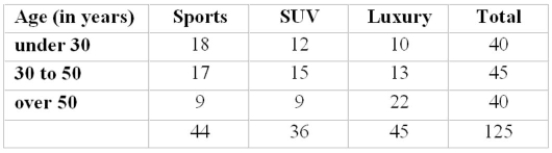
A) Reject the null hypothesis, there is a significant relationship between age and model preferred at the 5% level of significance.
B) Unable to reject the null hypothesis, there is a significant relationship between age and model preferred at the 5% level of significance.
C) Reject the null hypothesis, there is insufficient evidence to show a significant relationship between age and model preference.
D) Unable to reject the null hypothesis, there is significant relationship between age and model preferred at the 5% level of significance.
Question
Question
Six people have declared their intentions to run for a trustee seat in the next local election. A
Political poll is conducted during the campaign among 1,020 voters to determine if there is any clear
Preference among the voters. The responses are shown below.
How many degrees of freedom are there?
A) 1
B) 2
C) 3
D) 4
E) 5
Political poll is conducted during the campaign among 1,020 voters to determine if there is any clear
Preference among the voters. The responses are shown below.
How many degrees of freedom are there?
A) 1
B) 2
C) 3
D) 4
E) 5
Question
Question
Question
Question
The personnel manager is concerned about absenteeism. She decides to sample the records to
Determine if absenteeism is distributed evenly throughout the six-day workweek. The null
Hypothesis to be tested is: Absenteeism is distributed evenly throughout the week. The 0.01 level is
To be used. The sample results are:
How many degrees of freedom are there?
A) 0
B) 3
C) 4
D) 5
Determine if absenteeism is distributed evenly throughout the six-day workweek. The null
Hypothesis to be tested is: Absenteeism is distributed evenly throughout the week. The 0.01 level is
To be used. The sample results are:
How many degrees of freedom are there?
A) 0
B) 3
C) 4
D) 5
Question
The personnel manager is concerned about absenteeism. She decides to sample the records to
Determine if absenteeism is distributed evenly throughout the six-day workweek. The null
Hypothesis to be tested is: Absenteeism is distributed evenly throughout the week. The 0.01 level is
To be used. The sample results are:
What is the calculated value of chi-square?
A) 1.0
B) 0.5
C) 0.8
D) 8.0
Determine if absenteeism is distributed evenly throughout the six-day workweek. The null
Hypothesis to be tested is: Absenteeism is distributed evenly throughout the week. The 0.01 level is
To be used. The sample results are:
What is the calculated value of chi-square?
A) 1.0
B) 0.5
C) 0.8
D) 8.0
Question
Six people have declared their intentions to run for a trustee seat in the next local election. A
Political poll is conducted during the campaign among 1,020 voters to determine if there is any clear
Preference among the voters. The responses are shown below.
What is the expected frequency for each candidate?
A) 204
B) 170
C) 510
D) 180
Political poll is conducted during the campaign among 1,020 voters to determine if there is any clear
Preference among the voters. The responses are shown below.
What is the expected frequency for each candidate?
A) 204
B) 170
C) 510
D) 180
Question
Six people have declared their intentions to run for a trustee seat in the next local election. A
Political poll is conducted during the campaign among 1,020 voters to determine if there is any clear
Preference among the voters. The responses are shown below.
What is the critical value at the 5% level of significance?
A) 11.070
B) 3.841
C) 5.991
D) 9.236
E) 9.438
Political poll is conducted during the campaign among 1,020 voters to determine if there is any clear
Preference among the voters. The responses are shown below.
What is the critical value at the 5% level of significance?
A) 11.070
B) 3.841
C) 5.991
D) 9.236
E) 9.438
Question
Six people have declared their intentions to run for a trustee seat in the next local election. A
Political poll is conducted during the campaign among 1,020 voters to determine if there is any clear
Preference among the voters. The responses are shown below.
What is the critical value at the 1% level of significance?
A) 6.635
B) 9.210
C) 11.345
D) 13.277
E) 15.086
Political poll is conducted during the campaign among 1,020 voters to determine if there is any clear
Preference among the voters. The responses are shown below.
What is the critical value at the 1% level of significance?
A) 6.635
B) 9.210
C) 11.345
D) 13.277
E) 15.086
Question
Six people have declared their intentions to run for a trustee seat in the next local election. A
Political poll is conducted during the campaign among 1,020 voters to determine if there is any clear
Preference among the voters. The responses are shown below.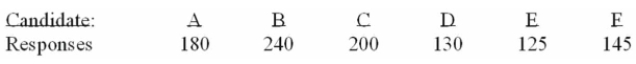
Determine the null and alternate hypotheses.
A) Ho: No preference among candidates exists H1: Preference among candidates.
B) Ho: Preference among candidates exists H1: No preference among candidates exists.
C) We are unable to determine because there are too many candidates.
D) We need more information to determine the null and alternate hypotheses.
Question
The personnel manager is concerned about absenteeism. She decides to sample the records to
Determine if absenteeism is distributed evenly throughout the six-day workweek. The null
Hypothesis to be tested is: Absenteeism is distributed evenly throughout the week. The 0.01 level is
To be used. The sample results are: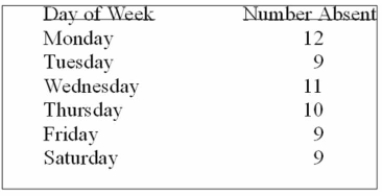
What kind of frequencies are the numbers 12, 9, 11, 10, and 9 called?
A) Acceptance
B) Critical value
C) Expected
D) Observed
Question
Question
The personnel manager is concerned about absenteeism. She decides to sample the records to
Determine if absenteeism is distributed evenly throughout the six-day workweek. The null
Hypothesis to be tested is: Absenteeism is distributed evenly throughout the week. The 0.01 level is
To be used. The sample results are:
What is the expected frequency?
A) 9
B) 10
C) 11
D) 12
Determine if absenteeism is distributed evenly throughout the six-day workweek. The null
Hypothesis to be tested is: Absenteeism is distributed evenly throughout the week. The 0.01 level is
To be used. The sample results are:
What is the expected frequency?
A) 9
B) 10
C) 11
D) 12
Question
The personnel manager is concerned about absenteeism. She decides to sample the records to
Determine if absenteeism is distributed evenly throughout the six-day workweek. The null
Hypothesis to be tested is: Absenteeism is distributed evenly throughout the week. The 0.01 level is
To be used. The sample results are: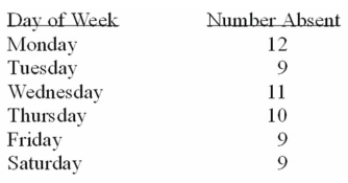
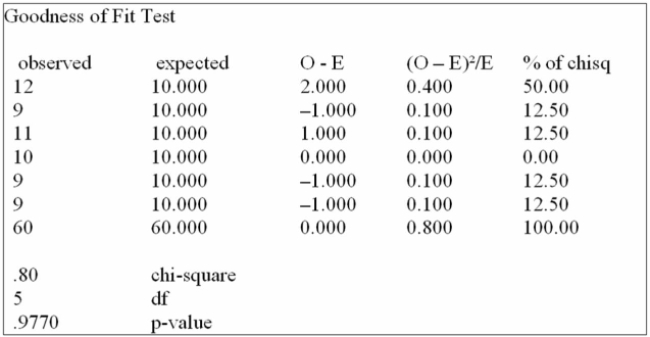
Using the Goodness of Fit Test above, what can you state about the observed absences?
A) The 0.8 value of chi-square with 5 df, leads us to conclude that there is a significant difference between the number of absences across the week when tested at the 5% level
Of significance.
B) Absenteeism is distributed evenly throughout the week. The observed differences are due to sampling variation, as supported by the p-value of 0.9770.
C) Absenteeism is not distributed evenly throughout the week. The p-value of 0.9770 strongly supports this conclusion.
D) The 5df lead us to conclude that absenteeism is distributed evenly throughout the week.
Determine if absenteeism is distributed evenly throughout the six-day workweek. The null
Hypothesis to be tested is: Absenteeism is distributed evenly throughout the week. The 0.01 level is
To be used. The sample results are:
Using the Goodness of Fit Test above, what can you state about the observed absences?
A) The 0.8 value of chi-square with 5 df, leads us to conclude that there is a significant difference between the number of absences across the week when tested at the 5% level
Of significance.
B) Absenteeism is distributed evenly throughout the week. The observed differences are due to sampling variation, as supported by the p-value of 0.9770.
C) Absenteeism is not distributed evenly throughout the week. The p-value of 0.9770 strongly supports this conclusion.
D) The 5df lead us to conclude that absenteeism is distributed evenly throughout the week.
Question
Question
Question
Six people have declared their intentions to run for a trustee seat in the next local election. A
Political poll is conducted during the campaign among 1,020 voters to determine if there is any clear
Preference among the voters. The responses are shown below.
If the computed chi-square is 30, what is your decision at the 1% level of significance? What is your
Decision at the 5% level of significance?
A) Reject H0; preferences among the candidates exist at the 1% level of significance; also reject at the 5% level of significance.
B) Reject H0 at the 1% level of significance but not at the 5% level of significance.
C) Reject H0 at the 5% level of significance but not at the 1% level of significance.
D) Accept Ho at both the 5% and 1% levels of significance; no preferences among the candidates exist.

Unlock Deck
Sign up to unlock the cards in this deck!
Unlock Deck
Unlock Deck
1/126
Play
Full screen (f)
Deck 14: Multiple Regression and Correlation Analysis
1
i. Chi-square goodness-of-fit test is the appropriate statistical test to use when you wish to
Determine how well an observed set of data fits an expected set of data.
ii. The null hypothesis in the goodness-of-fit test is that there is no difference.
iii. The alternative hypothesis states that there is a difference between the observed frequencies
And the expected frequencies in a goodness-of-fit test.
A) (i), (ii), and (iii) are all correct statements.
B) (i) and (ii) are correct statements but not (iii).
C) (i) and (iii) are correct statements but not (ii).
D) (ii) and (iii) are correct statements but not (i).
E) (i), (ii), and (iii) are all false statements.
(i), (ii), and (iii) are all correct statements.
2
i. For a goodness-of-fit test, the following are possible null and alternate hypotheses. Null: Sales are
Uniformly distributed among the five locations. Alternate: Sales are not uniformly distributed among
The five locations.
ii. The number of degrees of freedom appropriate for the chi-square goodness-of-fit test is the
Number of categories minus 1.
iii. If there are extremely large differences between observed and expected frequencies the correct
Decision is to accept H0.
A) (i), (ii), and (iii) are all correct statements.
B) (i) and (ii) are correct statements but not (iii).
C) (i) and (iii) are correct statements but not (ii).
D) (ii) and (iii) are correct statements but not (i).
E) (i), (ii), and (iii) are all false statements.
(i) and (ii) are correct statements but not (iii).
3
i. chi-square test statistic used in a goodness-of-fit test has k - 2 degrees of freedom.
ii. A goodness-of-fit test is a nonparametric test involving a set of observed frequencies and a
Corresponding set of expected frequencies.
iii. For a goodness-of-fit test, the following are possible null and alternate hypotheses.
Null: Sales are uniformly distributed among the five locations.
Alternate: Sales are not uniformly distributed among the five locations.
A) (i), (ii), and (iii) are all correct statements.
B) (i) and (ii) are correct statements but not (iii).
C) (i) and (iii) are correct statements but not (ii).
D) (ii) and (iii) are correct statements but not (i).
E) (i), (ii), and (iii) are all false statements.
(ii) and (iii) are correct statements but not (i).
4
i. The alternative hypothesis states that there is a difference between the observed frequencies and
The expected frequencies in a goodness-of-fit test.
ii. The number of degrees of freedom appropriate for the chi-square goodness-of-fit test is the
Number of categories minus 1.
iii. If there are extremely large differences between observed and expected frequencies the correct
Decision is to reject H0.
A) (i), (ii), and (iii) are all correct statements.
B) (i) and (ii) are correct statements but not (iii).
C) (i) and (iii) are correct statements but not (ii).
D) (ii) and (iii) are correct statements but not (i).
E) (i), (ii), and (iii) are all false statements.
Unlock Deck
Unlock for access to all 126 flashcards in this deck.
Unlock Deck
k this deck
5
i. A goodness-of-fit test is a nonparametric test involving a set of observed frequencies and a
Corresponding set of expected frequencies.
ii. For a goodness-of-fit test, the following are possible null and alternate hypotheses: Null: Sales are
Uniformly distributed among the five locations. Alternate: Sales are not uniformly distributed among
The five locations.
iii. In the goodness-of-fit test, the chi-square distribution is used to determine how well an observed
Set of observations "fits" an "expected" set of observations.
A) (i), (ii), and (iii) are all correct statements.
B) (i) and (ii) are correct statements but not (iii).
C) (i) and (iii) are correct statements but not (ii).
D) (ii) and (iii) are correct statements but not (i).
E) (i), (ii), and (iii) are all false statements.
Unlock Deck
Unlock for access to all 126 flashcards in this deck.
Unlock Deck
k this deck
6
i. For a goodness-of-fit test, the following are possible null and alternate hypotheses. Null: Sales are
Uniformly distributed among the five locations. Alternate: Sales are not uniformly distributed among
The five locations.
ii. In the goodness-of-fit test, the chi-square distribution is used to determine how well an observed
Set of observations "fits" an "expected" set of observations.
iii. The sum of the expected frequencies and the sum of the observed frequencies must be equal.
A) (i), (ii), and (iii) are all correct statements.
B) (i) and (ii) are correct statements but not (iii).
C) (i) and (iii) are correct statements but not (ii).
D) (ii) and (iii) are correct statements but not (i).
E) (i), (ii), and (iii) are all false statements.
Unlock Deck
Unlock for access to all 126 flashcards in this deck.
Unlock Deck
k this deck
7
i. The chi-square goodness-of-fit test can be applied if there are equal or unequal expected
Frequencies.
ii. For a goodness-of-fit test, the following are possible null and alternate hypotheses. Null: Sales are
Uniformly distributed among the five locations. Alternate: Sales are not uniformly distributed among
The five locations.
iii. The number of degrees of freedom appropriate for the chi-square goodness-of-fit test is the
Number of categories minus 1.
A) (i), (ii), and (iii) are all correct statements.
B) (i) and (ii) are correct statements but not (iii).
C) (i) and (iii) are correct statements but not (ii).
D) (ii) and (iii) are correct statements but not (i).
E) (i), (ii), and (iii) are all false statements.
Unlock Deck
Unlock for access to all 126 flashcards in this deck.
Unlock Deck
k this deck
8
i. If there are only two cells in a goodness-of-fit test, we should expect 5 or more frequencies.
ii. Chi-square goodness-of-fit test is the appropriate statistical test to use when you wish to
Determine how well an observed set of data fits an expected set of data.
iii. The null hypothesis in the goodness-of-fit test is that there is no difference.
A) (i), (ii), and (iii) are all correct statements.
B) (i) and (ii) are correct statements but not (iii).
C) (i) and (iii) are correct statements but not (ii).
D) (ii) and (iii) are correct statements but not (i).
E) (i), (ii), and (iii) are all false statements.
Unlock Deck
Unlock for access to all 126 flashcards in this deck.
Unlock Deck
k this deck
9
i. The chi-square goodness-of-fit test is appropriate for nominal and ordinal levels of data.
ii. Chi-square test statistic used in a goodness-of-fit test has k - 1 degrees of freedom.
iii. The chi-square goodness-of-fit test can be applied if there are equal or unequal expected
Frequencies.
A) (i), (ii), and (iii) are all correct statements.
B) (i) and (ii) are correct statements but not (iii).
C) (i) and (iii) are correct statements but not (ii).
D) (ii) and (iii) are correct statements but not (i).
E) (i), (ii), and (iii) are all false statements.
Unlock Deck
Unlock for access to all 126 flashcards in this deck.
Unlock Deck
k this deck
10
i. For a goodness-of-fit test, the number of degrees of freedom is determined by k - 2, where k is
The number of categories.
ii. The sum of the expected frequencies in a goodness-of-fit test need not equal the sum of the
Observed frequencies.
iii. If the computed value of chi-square is less than the critical value, reject the null hypothesis at a
Predetermined level of significance.
A) (i), (ii), and (iii) are all correct statements.
B) (i) and (ii) are correct statements but not (iii).
C) (i) and (iii) are correct statements but not (ii).
D) (ii) and (iii) are correct statements but not (i).
E) (i), (ii), and (iii) are all false statements.
Unlock Deck
Unlock for access to all 126 flashcards in this deck.
Unlock Deck
k this deck
11
i. If the computed value of chi-square is less than the critical value, reject the null hypothesis at a
Predetermined level of significance.
ii. The alternative hypothesis states that there is a difference between the observed frequencies
And the expected frequencies in a goodness-of-fit test.
iii. There are 2 degrees of freedom for a contingency table classifying three levels of income with
Each gender.
A) (i), (ii), and (iii) are all correct statements.
B) (i) and (ii) are correct statements but not (iii).
C) (i) and (iii) are correct statements but not (ii).
D) (ii) and (iii) are correct statements but not (i).
E) (i), (ii), and (iii) are all false statements.
Unlock Deck
Unlock for access to all 126 flashcards in this deck.
Unlock Deck
k this deck
12
i. The sum of the expected frequencies in a goodness-of-fit test need not equal the sum of the
Observed frequencies.
ii. A goodness-of-fit test is a nonparametric test involving a set of observed frequencies and a
Corresponding set of expected frequencies.
iii. For a goodness-of-fit test, the following are possible null and alternate hypotheses; Null: Sales
Are uniformly distributed among the five locations. Alternate: Sales are not uniformly distributed
Among the five locations.
A) (i), (ii), and (iii) are all correct statements.
B) (i) and (ii) are correct statements but not (iii).
C) (i) and (iii) are correct statements but not (ii).
D) (ii) and (iii) are correct statements but not (i).
E) (i), (ii), and (iii) are all false statements.
Unlock Deck
Unlock for access to all 126 flashcards in this deck.
Unlock Deck
k this deck
13
i. The sum of the expected frequencies and the sum of the observed frequencies must be equal.
ii. If the computed value of chi-square is less than the critical value, reject the null hypothesis at a
Predetermined level of significance.
iii. If there are only two cells in a goodness-of-fit test, we should expect 5 or more frequencies.
A) (i), (ii), and (iii) are all correct statements.
B) (i) and (ii) are correct statements but not (iii).
C) (i) and (iii) are correct statements but not (ii).
D) (ii) and (iii) are correct statements but not (i).
E) (i), (ii), and (iii) are all false statements.
Unlock Deck
Unlock for access to all 126 flashcards in this deck.
Unlock Deck
k this deck
14
i. Chi-square test statistic used in a goodness-of-fit test has k - 1 degrees of freedom.
ii. The chi-square goodness-of-fit test can be applied if there are equal or unequal expected
Frequencies.
iii. For a goodness-of-fit test, the number of degrees of freedom is determined by k - 2, where k is
The number of categories.
A) (i), (ii), and (iii) are all correct statements.
B) (i) and (ii) are correct statements but not (iii).
C) (i) and (iii) are correct statements but not (ii).
D) (ii) and (iii) are correct statements but not (i).
E) (i), (ii), and (iii) are all false statements.
Unlock Deck
Unlock for access to all 126 flashcards in this deck.
Unlock Deck
k this deck
15
i. For a goodness-of-fit test, the number of degrees of freedom is determined by k - 2, where k is
The number of categories.
ii. The sum of the expected frequencies in a goodness-of-fit test need not equal the sum of the
Observed frequencies.
iii. A goodness-of-fit test is a nonparametric test involving a set of observed frequencies and a
Corresponding set of expected frequencies.
A) (i), (ii), and (iii) are all correct statements.
B) (i) and (ii) are correct statements but not (iii).
C) (i) and (iii) are correct statements but not (ii).
D) (ii) and (iii) are correct statements but not (i).
E) (iii) is a correct statement, but (i) and (ii) are false.
Unlock Deck
Unlock for access to all 126 flashcards in this deck.
Unlock Deck
k this deck
16
i. If the computed value of chi-square is less than the critical value, reject the null hypothesis at a
Predetermined level of significance.
ii. If there are only two cells in a goodness-of-fit test, we should expect 5 or more frequencies.
iii. Chi-square goodness-of-fit test is the appropriate statistical test to use when you wish to
Determine how well an observed set of data fits an expected set of data.
A) (i), (ii), and (iii) are all correct statements.
B) (i) and (ii) are correct statements but not (iii).
C) (i) and (iii) are correct statements but not (ii).
D) (ii) and (iii) are correct statements but not (i).
E) (i), (ii), and (iii) are all false statements.
Unlock Deck
Unlock for access to all 126 flashcards in this deck.
Unlock Deck
k this deck
17
i. The number of degrees of freedom appropriate for the chi-square goodness-of-fit test is the
Number of categories minus 2.
ii. If there are extremely large differences between observed and expected frequencies the correct
Decision is to reject H0.
iii. There are 2 degrees of freedom for a contingency table classifying three levels of income with
Each gender.
A) (i), (ii), and (iii) are all correct statements.
B) (i) and (ii) are correct statements but not (iii).
C) (i) and (iii) are correct statements but not (ii).
D) (ii) and (iii) are correct statements but not (i).
E) (i), (ii), and (iii) are all false statements.
Unlock Deck
Unlock for access to all 126 flashcards in this deck.
Unlock Deck
k this deck
18
i. The null hypothesis in the goodness-of-fit test is that there is no difference.
ii. The alternative hypothesis states that there is a difference between the observed frequencies
And the expected frequencies in a goodness-of-fit test.
iii. The number of degrees of freedom appropriate for the chi-square goodness-of-fit test is the
Number of categories minus 1.
A) (i), (ii), and (iii) are all correct statements.
B) (i) and (ii) are correct statements but not (iii).
C) (i) and (iii) are correct statements but not (ii).
D) (ii) and (iii) are correct statements but not (i).
E) (i), (ii), and (iii) are all false statements.
Unlock Deck
Unlock for access to all 126 flashcards in this deck.
Unlock Deck
k this deck
19
i. In the goodness-of-fit test, the chi-square distribution is used to determine how well an observed
Set of observations "fits" an "expected" set of observations.
ii. The sum of the expected frequencies and the sum of the observed frequencies must be equal.
iii. If the computed value of chi-square is less than the critical value, reject the null hypothesis at a
Predetermined level of significance.
A) (i), (ii), and (iii) are all correct statements.
B) (i) and (ii) are correct statements but not (iii).
C) (i) and (iii) are correct statements but not (ii).
D) (ii) and (iii) are correct statements but not (i).
E) (i), (ii), and (iii) are all false statements.
Unlock Deck
Unlock for access to all 126 flashcards in this deck.
Unlock Deck
k this deck
20
i. The chi-square goodness-of-fit test can be applied if there are equal or unequal expected
Frequencies.
ii. For a goodness-of-fit test, the number of degrees of freedom is determined by k - 2, where k is
The number of categories.
iii. The sum of the expected frequencies in a goodness-of-fit test need not equal the sum of the
Observed frequencies.
A) (i), (ii), and (iii) are all correct statements.
B) (i) and (ii) are correct statements but not (iii).
C) (i) and (iii) are correct statements but not (ii).
D) (ii) and (iii) are correct statements but not (i).
E) (i) is a correct statement, but (ii) and (iii) are false.
Unlock Deck
Unlock for access to all 126 flashcards in this deck.
Unlock Deck
k this deck
21
Canadian Accounting classifies accounts receivable as "current", "late", and "not collectible".
Industry figures show that 60% of A/R are current, 30% are late, and 10% are uncollectible. A law
firm in Markham Ontario has 500 accounts receivable: 320 are current, 100 are late and 80 are not
Collectible. Are these numbers in agreement with the industry distribution?
Using the data from this Megastat printout, you determine:
A) the Markham firm's data reflect the national average, when tested at the 0.10 level of significance.
B) the Markham firm's data reflect the national average, when tested at the 0.05 level of significance.
C) the Markham firm's data reflect the national average, when tested at the 0.01 level of significance.
D) the Markham firm's data do not reflect the national average, when tested above a 0.01 level of significance.
Unlock Deck
Unlock for access to all 126 flashcards in this deck.
Unlock Deck
k this deck
22
When determining how well an observed set of frequencies fit an expected set of frequencies the
Test is the:
A) F test.
B) t test.
C) goodness-of-fit test.
D) test for association.
Test is the:
A) F test.
B) t test.
C) goodness-of-fit test.
D) test for association.
Unlock Deck
Unlock for access to all 126 flashcards in this deck.
Unlock Deck
k this deck
23
A student asked a statistics professor if grades were marked "on the curve." The professor decided
To give the student a project to determine if last year's statistics grades were normally distributed.
The professor told the student that last year's mean mark was 70 with a standard deviation of 10
And to use the following results.
What is the expected number of C's?
A) 39.25
B) 34.13
C) 13.59
D) 30.00
E) 15.87
Unlock Deck
Unlock for access to all 126 flashcards in this deck.
Unlock Deck
k this deck
24
What is the critical value at the 0.05 level of significance for a goodness-of-fit test if there are six
Categories?
A) 3.841
B) 5.991
C) 7.815
D) 11.070
Categories?
A) 3.841
B) 5.991
C) 7.815
D) 11.070
Unlock Deck
Unlock for access to all 126 flashcards in this deck.
Unlock Deck
k this deck
25
What is our decision regarding the differences between the observed and expected frequencies if
The critical value of chi-square is 9.488 and the computed value is 6.079?
A) Due to chance; do not reject the null hypothesis.
B) Not due to chance; reject the null hypothesis.
C) Not due to chance; do not reject the alternate hypothesis.
D) Too close; reserve judgment.
The critical value of chi-square is 9.488 and the computed value is 6.079?
A) Due to chance; do not reject the null hypothesis.
B) Not due to chance; reject the null hypothesis.
C) Not due to chance; do not reject the alternate hypothesis.
D) Too close; reserve judgment.
Unlock Deck
Unlock for access to all 126 flashcards in this deck.
Unlock Deck
k this deck
26
In the chi-square test, the null hypothesis (no difference between sets of observed and expected
Frequencies) is rejected when the:
A) computed chi-square is less than the critical value.
B) difference between the observed and expected frequencies is significant.
C) difference between the observed and expected frequencies is small.
D) difference between the observed and expected frequencies occurs by chance.
Unlock Deck
Unlock for access to all 126 flashcards in this deck.
Unlock Deck
k this deck
27
The computed chi-square value is positive because the difference between the observed and
Expected frequencies is:
A) squared.
B) linear.
C) uniform.
D) always positive.
Expected frequencies is:
A) squared.
B) linear.
C) uniform.
D) always positive.
Unlock Deck
Unlock for access to all 126 flashcards in this deck.
Unlock Deck
k this deck
28
A student asked a statistics professor if grades were marked "on the curve." The professor decided
To give the student a project to determine if last year's statistics grades were normally distributed.
The professor told the student that last year's mean mark was 70 with a standard deviation of 10
And to use the following results.
What is the calculated value of chi-square?
A) 29.76
B) 14.20
C) 14.88
D) 28.36
E) 12.59
Unlock Deck
Unlock for access to all 126 flashcards in this deck.
Unlock Deck
k this deck
29
Canadian Accounting classifies accounts receivable as "current", "late", and "not collectible".
Industry figures show that 60% of A/R are current, 30% are late, and 10% are uncollectible. A law
firm in Markham Ontario has 500 accounts receivable: 320 are current, 120 are late and 60 are not
Collectible. Are these numbers in agreement with the industry distribution?
Using the data from this Megastat printout, you determine:
A) the Markham firm's data reflect the national average, when tested at the 0.10 level of significance.
B) the Markham firm's data reflect the national average, when tested at the 0.05 level of significance.
C) the Markham firm's data reflect the national average, when tested at the 0.01 level of significance.
D) the Markham firm's data do not reflect the national average, when tested above a 0.01 level of significance.
Unlock Deck
Unlock for access to all 126 flashcards in this deck.
Unlock Deck
k this deck
30
A student asked a statistics professor if grades were marked "on the curve." The professor decided
To give the student a project to determine if last year's statistics grades were normally distributed.
The professor told the student that last year's mean mark was 70 with a standard deviation of 10
And to use the following results.
What is the critical value of chi-square at the 0.05 level?
A) 12.833
B) 11.070
C) 12.592
D) 14.449
E) 19.675
Unlock Deck
Unlock for access to all 126 flashcards in this deck.
Unlock Deck
k this deck
31
A student asked a statistics professor if grades were marked "on the curve." The professor decided
To give the student a project to determine if last year's statistics grades were normally distributed.
The professor told the student that last year's mean mark was 70 with a standard deviation of 10
And to use the following results.
What is the alternative hypothesis?
A) The letter grades are evenly distributed.
B) The letter grades are not evenly distributed.
C) The letter grades are normally distributed.
D) The letter grades are not normally distributed.
E) The letter grades are unfairly distributed.
Unlock Deck
Unlock for access to all 126 flashcards in this deck.
Unlock Deck
k this deck
32
Canadian Accounting classifies accounts receivable as "current", "late", and "not collectible".
Industry figures show that 60% of A/R are current, 30% are late, and 10% are uncollectible. A law
firm in Markham Ontario has 500 accounts receivable: 310 are current, 125 are late and 65 are not
Collectible. Are these numbers in agreement with the industry distribution?
Using the data from this Megastat printout, you determine:
A) the Markham firm's data reflect the national average, when tested at the 0.10 level of significance.
B) the Markham firm's data reflect the national average, when tested at the 0.05 level of significance.
C) the Markham firm's data reflect the national average, when tested at the 0.01 level of significance.
D) the Markham firm's data do not reflect the national average, when tested above a 0.01 level of significance.
Unlock Deck
Unlock for access to all 126 flashcards in this deck.
Unlock Deck
k this deck
33
A student asked a statistics professor if grades were marked "on the curve." The professor decided
To give the student a project to determine if last year's statistics grades were normally distributed.
The professor told the student that last year's mean mark was 70 with a standard deviation of 10
And to use the following results.
What is your decision if α = 0.05?
A) The letter grades are evenly distributed.
B) The letter grades are not evenly distributed.
C) The letter grades are normally distributed.
D) The letter grades are not normally distributed.
E) The letter grades are unfairly distributed.
Unlock Deck
Unlock for access to all 126 flashcards in this deck.
Unlock Deck
k this deck
34
A question has these possible choices-excellent, very good, good, fair and unsatisfactory. How
Many degrees of freedom are there, using the goodness-of-fit test to the sample results?
A) 0
B) 2
C) 4
D) 5
Many degrees of freedom are there, using the goodness-of-fit test to the sample results?
A) 0
B) 2
C) 4
D) 5
Unlock Deck
Unlock for access to all 126 flashcards in this deck.
Unlock Deck
k this deck
35
A student asked a statistics professor if grades were marked "on the curve." The professor decided
To give the student a project to determine if last year's statistics grades were normally distributed.
The professor told the student that last year's mean mark was 70 with a standard deviation of 10
And to use the following results.
What is the expected number of grades above B?
A) 18.25
B) 20.00
C) 13.59
D) 15.87
E) 15.63
Unlock Deck
Unlock for access to all 126 flashcards in this deck.
Unlock Deck
k this deck
36
Three new colors have been proposed for the Jeep Grand Cherokee vehicle. They are silvered-
Blue, almond, and willow green. The null hypothesis for a goodness-of-fit test would be
A) willow green preferred over the other colors.
B) no preference between the colors.
C) any one color preferred over the other colors.
D) impossible to determine.
Blue, almond, and willow green. The null hypothesis for a goodness-of-fit test would be
A) willow green preferred over the other colors.
B) no preference between the colors.
C) any one color preferred over the other colors.
D) impossible to determine.
Unlock Deck
Unlock for access to all 126 flashcards in this deck.
Unlock Deck
k this deck
37
A student asked a statistics professor if grades were marked "on the curve." The professor decided
To give the student a project to determine if last year's statistics grades were normally distributed.
The professor told the student that last year's mean mark was 70 with a standard deviation of 10
And to use the following results.
What is the expected number of F's?
A) 10.00
B) 2.28
C) 2.62
D) 13.59
E) 4.56
Unlock Deck
Unlock for access to all 126 flashcards in this deck.
Unlock Deck
k this deck
38
For any chi-square goodness-of-fit problem, the number of degrees of freedom is found by:
A) n - k - 1.
B) k - 1.
C) n + 1.
D) n + k.
A) n - k - 1.
B) k - 1.
C) n + 1.
D) n + k.
Unlock Deck
Unlock for access to all 126 flashcards in this deck.
Unlock Deck
k this deck
39
A student asked a statistics professor if grades were marked "on the curve." The professor decided
To give the student a project to determine if last year's statistics grades were normally distributed.
The professor told the student that last year's mean mark was 70 with a standard deviation of 10
And to use the following results.
What is your decision if α = 0.05?
A) The letter grades are evenly distributed.
B) The letter grades are not evenly distributed.
C) The letter grades are normally distributed.
D) The letter grades are not normally distributed.
E) The letter grades are unfairly distributed.
Unlock Deck
Unlock for access to all 126 flashcards in this deck.
Unlock Deck
k this deck
40
A student asked a statistics professor if grades were marked "on the curve." The professor decided
To give the student a project to determine if last year's statistics grades were normally distributed.
The professor told the student that last year's mean mark was 70 with a standard deviation of 10
And to use the following results.
Using the data from this Megastat printout, you determine:
A) the letter grades are evenly distributed when tested at the 0.05 level of significance.
B) the letter grades are not normally distributed when tested at the 0.01 level of significance.
C) the letter grades are normally distributed when tested at the 0.05 level of significance.
D) the letter grades are not normally distributed when tested at the 0.05 level of significance.
E) the letter grades are not normally distributed when tested at either the 0.01 or 0.05 level of significance.
Unlock Deck
Unlock for access to all 126 flashcards in this deck.
Unlock Deck
k this deck
41
i. Nonparametric tests of hypotheses, which are also called distribution free tests, require the
Population to be normally distributed.
ii. The computed value of chi-square is always positive because the difference between the
Observed frequencies and the expected frequencies are squared.
iii. The shape of the chi-square distribution changes for each number of degrees of freedom.
A) (i), (ii), and (iii) are all correct statements
B) (i) and (ii) are correct statements but not (iii).
C) (i) and (iii) are correct statements but not (ii).
D) (ii) and (iii) are correct statements but not (i).
E) (i), (ii), and (iii) are all false statements.
Unlock Deck
Unlock for access to all 126 flashcards in this deck.
Unlock Deck
k this deck
42
i. Small differences between observed and expected frequencies are due to chance.
ii. The chi-square distribution with large degrees of freedom approaches a normal distribution.
iii. The chi-square distribution is positively skewed.
A) (i), (ii), and (iii) are all correct statements.
B) (i) and (ii) are correct statements but not (iii).
C) (i) and (iii) are correct statements but not (ii).
D) (ii) and (iii) are correct statements but not (i).
E) (i), (ii), and (iii) are all false statements.
Unlock Deck
Unlock for access to all 126 flashcards in this deck.
Unlock Deck
k this deck
43
i. The chi-square distribution is positively skewed.
ii. Nonparametric tests of hypothesis, which are also called distribution free tests, require the
Population to be normally distributed.
iii. The computed value of chi-square is always positive because the difference between the
Observed frequencies and the expected frequencies are squared.
A) (i), (ii), and (iii) are all correct statements.
B) (i) and (ii) are correct statements but not (iii).
C) (i) and (iii) are correct statements but not (ii).
D) (ii) and (iii) are correct statements but not (i).
E) (i), (ii), and (iii) are all false statements.
Unlock Deck
Unlock for access to all 126 flashcards in this deck.
Unlock Deck
k this deck
44
To find the expected frequency in a contingency table:
A) take the square root of the degrees of freedom.
B) multiply the row and column totals and divide by the grand total.
C) use the total number of observations minus one.
A) take the square root of the degrees of freedom.
B) multiply the row and column totals and divide by the grand total.
C) use the total number of observations minus one.
Unlock Deck
Unlock for access to all 126 flashcards in this deck.
Unlock Deck
k this deck
45
i. There is not one, but a family of chi-square distributions. There is a chi-square distribution for 1
Degree of freedom, another for 2 degrees of freedom, another for 3 degrees of freedom, and so on.
ii. The shape of the chi-square distribution depends on the size of the sample.
iii. Small differences between observed and expected frequencies are due to chance.
A) (i), (ii), and (iii) are all correct statements.
B) (i) and (ii) are correct statements but not (iii).
C) (i) and (iii) are correct statements but not (ii).
D) (ii) and (iii) are correct statements but not (i).
E) (i), (ii), and (iii) are all false statements.
Unlock Deck
Unlock for access to all 126 flashcards in this deck.
Unlock Deck
k this deck
46
A distributor of personal computers has five locations in the city. The sales in units for the first
Quarter of the year were as follows:
What is the critical value at the 0.01 level of risk?
A) 7.779
B) 15.033
C) 13.277
D) 5.412
Quarter of the year were as follows:
What is the critical value at the 0.01 level of risk?
A) 7.779
B) 15.033
C) 13.277
D) 5.412
Unlock Deck
Unlock for access to all 126 flashcards in this deck.
Unlock Deck
k this deck
47
i. Nonparametric tests require no assumptions about the shape of the population distribution.
ii. There is not one, but a family of chi-square distributions. There is a chi-square distribution for 1
Degree of freedom, another for 2 degrees of freedom, another for 3 degrees of freedom, and so on.
iii. The chi-square distribution with large degrees of freedom approaches a normal distribution.
A) (i), (ii), and (iii) are all correct statements.
B) (i) and (ii) are correct statements but not (iii).
C) (i) and (iii) are correct statements but not (ii).
D) (ii) and (iii) are correct statements but not (i).
E) (i), (ii), and (iii) are all false statements.
Unlock Deck
Unlock for access to all 126 flashcards in this deck.
Unlock Deck
k this deck
48
Which of the following are correct statements regarding the goodness-of-fit test?
A) Data may be of nominal scale.
B) Population must be normal.
C) All the expected frequencies must be equal.
D) All of the choices are correct.
A) Data may be of nominal scale.
B) Population must be normal.
C) All the expected frequencies must be equal.
D) All of the choices are correct.
Unlock Deck
Unlock for access to all 126 flashcards in this deck.
Unlock Deck
k this deck
49
i. The minimum computed value of chi-square is one.
ii. The chi-square distribution is a positively skewed distribution.
iii. The lowest level of data for which the chi-square goodness-of-fit test is appropriate is the
Nominal level.
A) (i), (ii), and (iii) are all correct statements.
B) (i) and (ii) are correct statements but not (iii).
C) (i) and (iii) are correct statements but not (ii).
D) (ii) and (iii) are correct statements but not (i).
E) (i), (ii), and (iii) are all false statements.
Unlock Deck
Unlock for access to all 126 flashcards in this deck.
Unlock Deck
k this deck
50
i. The shape of the chi-square distribution changes for each number of degrees of freedom.
ii. The minimum computed value of chi-square is zero.
iii. The chi-square distribution is a positively skewed distribution.
A) (i), (ii), and (iii) are all correct statements.
B) (i) and (ii) are correct statements but not (iii).
C) (i) and (iii) are correct statements but not (ii).
D) (ii) and (iii) are correct statements but not (i).
E) (i), (ii), and (iii) are all false statements.
Unlock Deck
Unlock for access to all 126 flashcards in this deck.
Unlock Deck
k this deck
51
i. Tests of hypotheses for nominal or ordinal levels of measurement are called nonparametric or
Distribution-free tests.
ii. There is not one, but a family of chi-square distributions. There is a chi-square distribution for 1
Degree of freedom, another for 2 degrees of freedom, another for 3 degrees of freedom, and so on.
iii. The shape of the chi-square distribution depends on the size of the sample.
A) (i), (ii), and (iii) are all correct statements.
B) (i) and (ii) are correct statements but not (iii).
C) (i) and (iii) are correct statements but not (ii).
D) (ii) and (iii) are correct statements but not (i).
E) (i), (ii), and (iii) are all false statements.
Unlock Deck
Unlock for access to all 126 flashcards in this deck.
Unlock Deck
k this deck
52
i. The shape of the chi-square distribution depends on the size of the sample.
ii. Small differences between observed and expected frequencies are due to chance.
iii. The chi-square distribution with large degrees of freedom approaches a normal distribution.
A) (i), (ii), and (iii) are all correct statements.
B) (i) and (ii) are correct statements but not (iii).
C) (i) and (iii) are correct statements but not (ii).
D) (ii) and (iii) are correct statements but not (i).
E) (i), (ii), and (iii) are all false statements.
Unlock Deck
Unlock for access to all 126 flashcards in this deck.
Unlock Deck
k this deck
53
In a contingency table suppose that we are comparing males versus females against five glades: A,
B, C, D and F The degrees of freedom will be:
A) 10
B) 8
C) 4
D) 6
B, C, D and F The degrees of freedom will be:
A) 10
B) 8
C) 4
D) 6
Unlock Deck
Unlock for access to all 126 flashcards in this deck.
Unlock Deck
k this deck
54
i. The computed value of chi-square is always positive because the difference between the
Observed frequencies and the expected frequencies are squared.
ii. The shape of the chi-square distribution changes for each number of degrees of freedom.
iii. The minimum computed value of chi-square is zero.
A) (i), (ii), and (iii) are all correct statements.
B) (i) and (ii) are correct statements but not (iii).
C) (i) and (iii) are correct statements but not (ii).
D) (ii) and (iii) are correct statements but not (i).
E) (i), (ii), and (iii) are all false statements.
Unlock Deck
Unlock for access to all 126 flashcards in this deck.
Unlock Deck
k this deck
55
i. Nonparametric tests of hypotheses, which are also called distribution free tests, require the
Population to be normally distributed.
ii. The shape of the chi-square distribution changes for each number of degrees of freedom.
iii. The chi-square distribution is a positively skewed distribution.
A) (i), (ii), and (iii) are all correct statements.
B) (i) and (ii) are correct statements but not (iii).
C) (i) and (iii) are correct statements but not (ii).
D) (ii) and (iii) are correct statements but not (i).
E) (i), (ii), and (iii) are all false statements.
Unlock Deck
Unlock for access to all 126 flashcards in this deck.
Unlock Deck
k this deck
56
i. The chi-square distribution with large degrees of freedom approaches a normal distribution.
ii. The chi-square distribution is positively skewed.
iii. Nonparametric tests of hypotheses, which are also called distribution free tests, require the
Population to be normally distributed.
A) (i), (ii), and (iii) are all correct statements.
B) (i) and (ii) are correct statements but not (iii).
C) (i) and (iii) are correct statements but not (ii).
D) (ii) and (iii) are correct statements but not (i).
E) (i), (ii), and (iii) are all false statements.
Unlock Deck
Unlock for access to all 126 flashcards in this deck.
Unlock Deck
k this deck
57
What is our decision for a goodness-of-fit test with a computed value of chi-square of 1.273 and a
Critical value of 13.388?
A) Do not reject the null hypothesis.
B) Reject the null hypothesis.
C) Unable to reject or not reject the null hypothesis based on data.
D) Should take a larger sample.
Critical value of 13.388?
A) Do not reject the null hypothesis.
B) Reject the null hypothesis.
C) Unable to reject or not reject the null hypothesis based on data.
D) Should take a larger sample.
Unlock Deck
Unlock for access to all 126 flashcards in this deck.
Unlock Deck
k this deck
58
Suppose that we wish to test the null hypothesis that for 3 cells, A, B, and C, the cell categories are
Equal. We observed 8 data in cell A, 13 in cell B, and 9 in cell C What is the decision regarding the null hypothesis?
A) Do not reject the null hypothesis.
B) Reject the null hypothesis.
C) There is not enough information to reach a decision.
Equal. We observed 8 data in cell A, 13 in cell B, and 9 in cell C What is the decision regarding the null hypothesis?
A) Do not reject the null hypothesis.
B) Reject the null hypothesis.
C) There is not enough information to reach a decision.
Unlock Deck
Unlock for access to all 126 flashcards in this deck.
Unlock Deck
k this deck
59
i. Nonparametric tests require no assumptions about the shape of the population distribution.
ii. Tests of hypotheses for nominal or ordinal levels of measurement are called nonparametric or
Distribution-free tests.
iii. There is not one, but a family of chi-square distributions. There is a chi-square distribution for 1
Degree of freedom, another for 2 degrees of freedom, another for 3 degrees of freedom, and so on.
A) (i), (ii), and (iii) are all correct statements.
B) (i) and (ii) are correct statements but not (iii).
C) (i) and (iii) are correct statements but not (ii).
D) (ii) and (iii) are correct statements but not (i).
E) (i), (ii), and (iii) are all false statements.
Unlock Deck
Unlock for access to all 126 flashcards in this deck.
Unlock Deck
k this deck
60
Suppose that we wish to test the null hypothesis that for 3 cells, A, B, and C, the cell categories are
Equal. We observed 8 data in cell A, 13 in cell B, and 9 in cell C What is the decision rule using the 0.05 significance level?
A) 7.815
B) 5.991
C) 43.773
D) 42.557
Equal. We observed 8 data in cell A, 13 in cell B, and 9 in cell C What is the decision rule using the 0.05 significance level?
A) 7.815
B) 5.991
C) 43.773
D) 42.557
Unlock Deck
Unlock for access to all 126 flashcards in this deck.
Unlock Deck
k this deck
61
Which of the following are correct statements regarding the chi-square distribution?
A) Distribution is negatively skewed
B) Chi-square is based on two sets of degrees of freedom, one for the numerator and one for the denominator.
C) Its shape is based on the degrees of freedom.
A) Distribution is negatively skewed
B) Chi-square is based on two sets of degrees of freedom, one for the numerator and one for the denominator.
C) Its shape is based on the degrees of freedom.
Unlock Deck
Unlock for access to all 126 flashcards in this deck.
Unlock Deck
k this deck
62
At a recent car show, a sample of 125 people produced the following results. Use the 0.05
Significance level to determine if there is a relationship between age and model preferred.
A) Reject the null hypothesis, there is a significant relationship between age and model preferred at the 5% level of significance.
B) Unable to reject the null hypothesis, there is a significant relationship between age and model preferred at the 5% level of significance.
C) Reject the null hypothesis, there is insufficient evidence to show a significant relationship between age and model preference.
D) Unable to reject the null hypothesis, there is significant relationship between age and model preferred at the 5% level of significance.
Significance level to determine if there is a relationship between age and model preferred.
A) Reject the null hypothesis, there is a significant relationship between age and model preferred at the 5% level of significance.
B) Unable to reject the null hypothesis, there is a significant relationship between age and model preferred at the 5% level of significance.
C) Reject the null hypothesis, there is insufficient evidence to show a significant relationship between age and model preference.
D) Unable to reject the null hypothesis, there is significant relationship between age and model preferred at the 5% level of significance.
Unlock Deck
Unlock for access to all 126 flashcards in this deck.
Unlock Deck
k this deck
63
Two chi-square distributions were plotted on the same chart. One distribution was for 3 degrees of
Freedom and the other was for 12 degrees of freedom. Which distribution would tend to approach a
Normal distribution?
A) 3 degrees
B) 12 degrees
C) 15 degrees
D) All three distributions would approach a normal distribution
Freedom and the other was for 12 degrees of freedom. Which distribution would tend to approach a
Normal distribution?
A) 3 degrees
B) 12 degrees
C) 15 degrees
D) All three distributions would approach a normal distribution
Unlock Deck
Unlock for access to all 126 flashcards in this deck.
Unlock Deck
k this deck
64
Six people have declared their intentions to run for a trustee seat in the next local election. A
Political poll is conducted during the campaign among 1,020 voters to determine if there is any clear
Preference among the voters. The responses are shown below.
How many degrees of freedom are there?
A) 1
B) 2
C) 3
D) 4
E) 5
Political poll is conducted during the campaign among 1,020 voters to determine if there is any clear
Preference among the voters. The responses are shown below.
How many degrees of freedom are there?
A) 1
B) 2
C) 3
D) 4
E) 5
Unlock Deck
Unlock for access to all 126 flashcards in this deck.
Unlock Deck
k this deck
65
The chi-square distribution is:
A) positively skewed.
B) negatively skewed.
C) normally distributed.
D) negatively or positively skewed.
A) positively skewed.
B) negatively skewed.
C) normally distributed.
D) negatively or positively skewed.
Unlock Deck
Unlock for access to all 126 flashcards in this deck.
Unlock Deck
k this deck
66
The chi-square has:
A) one distribution.
B) two distributions.
C) a family of distributions.
D) a uniform distribution.
A) one distribution.
B) two distributions.
C) a family of distributions.
D) a uniform distribution.
Unlock Deck
Unlock for access to all 126 flashcards in this deck.
Unlock Deck
k this deck
67
Which of the following is not a characteristic of the chi square distribution?
A) Its shape is based on the sample size.
B) It is not negative.
C) It is positively skewed.
D) It approaches a normal distribution as the degrees of freedom increase.
A) Its shape is based on the sample size.
B) It is not negative.
C) It is positively skewed.
D) It approaches a normal distribution as the degrees of freedom increase.
Unlock Deck
Unlock for access to all 126 flashcards in this deck.
Unlock Deck
k this deck
68
The personnel manager is concerned about absenteeism. She decides to sample the records to
Determine if absenteeism is distributed evenly throughout the six-day workweek. The null
Hypothesis to be tested is: Absenteeism is distributed evenly throughout the week. The 0.01 level is
To be used. The sample results are:
How many degrees of freedom are there?
A) 0
B) 3
C) 4
D) 5
Determine if absenteeism is distributed evenly throughout the six-day workweek. The null
Hypothesis to be tested is: Absenteeism is distributed evenly throughout the week. The 0.01 level is
To be used. The sample results are:
How many degrees of freedom are there?
A) 0
B) 3
C) 4
D) 5
Unlock Deck
Unlock for access to all 126 flashcards in this deck.
Unlock Deck
k this deck
69
The personnel manager is concerned about absenteeism. She decides to sample the records to
Determine if absenteeism is distributed evenly throughout the six-day workweek. The null
Hypothesis to be tested is: Absenteeism is distributed evenly throughout the week. The 0.01 level is
To be used. The sample results are:
What is the calculated value of chi-square?
A) 1.0
B) 0.5
C) 0.8
D) 8.0
Determine if absenteeism is distributed evenly throughout the six-day workweek. The null
Hypothesis to be tested is: Absenteeism is distributed evenly throughout the week. The 0.01 level is
To be used. The sample results are:
What is the calculated value of chi-square?
A) 1.0
B) 0.5
C) 0.8
D) 8.0
Unlock Deck
Unlock for access to all 126 flashcards in this deck.
Unlock Deck
k this deck
70
Six people have declared their intentions to run for a trustee seat in the next local election. A
Political poll is conducted during the campaign among 1,020 voters to determine if there is any clear
Preference among the voters. The responses are shown below.
What is the expected frequency for each candidate?
A) 204
B) 170
C) 510
D) 180
Political poll is conducted during the campaign among 1,020 voters to determine if there is any clear
Preference among the voters. The responses are shown below.
What is the expected frequency for each candidate?
A) 204
B) 170
C) 510
D) 180
Unlock Deck
Unlock for access to all 126 flashcards in this deck.
Unlock Deck
k this deck
71
Six people have declared their intentions to run for a trustee seat in the next local election. A
Political poll is conducted during the campaign among 1,020 voters to determine if there is any clear
Preference among the voters. The responses are shown below.
What is the critical value at the 5% level of significance?
A) 11.070
B) 3.841
C) 5.991
D) 9.236
E) 9.438
Political poll is conducted during the campaign among 1,020 voters to determine if there is any clear
Preference among the voters. The responses are shown below.
What is the critical value at the 5% level of significance?
A) 11.070
B) 3.841
C) 5.991
D) 9.236
E) 9.438
Unlock Deck
Unlock for access to all 126 flashcards in this deck.
Unlock Deck
k this deck
72
Six people have declared their intentions to run for a trustee seat in the next local election. A
Political poll is conducted during the campaign among 1,020 voters to determine if there is any clear
Preference among the voters. The responses are shown below.
What is the critical value at the 1% level of significance?
A) 6.635
B) 9.210
C) 11.345
D) 13.277
E) 15.086
Political poll is conducted during the campaign among 1,020 voters to determine if there is any clear
Preference among the voters. The responses are shown below.
What is the critical value at the 1% level of significance?
A) 6.635
B) 9.210
C) 11.345
D) 13.277
E) 15.086
Unlock Deck
Unlock for access to all 126 flashcards in this deck.
Unlock Deck
k this deck
73
Six people have declared their intentions to run for a trustee seat in the next local election. A
Political poll is conducted during the campaign among 1,020 voters to determine if there is any clear
Preference among the voters. The responses are shown below.
Determine the null and alternate hypotheses.
A) Ho: No preference among candidates exists H1: Preference among candidates.
B) Ho: Preference among candidates exists H1: No preference among candidates exists.
C) We are unable to determine because there are too many candidates.
D) We need more information to determine the null and alternate hypotheses.
Unlock Deck
Unlock for access to all 126 flashcards in this deck.
Unlock Deck
k this deck
74
The personnel manager is concerned about absenteeism. She decides to sample the records to
Determine if absenteeism is distributed evenly throughout the six-day workweek. The null
Hypothesis to be tested is: Absenteeism is distributed evenly throughout the week. The 0.01 level is
To be used. The sample results are:
What kind of frequencies are the numbers 12, 9, 11, 10, and 9 called?
A) Acceptance
B) Critical value
C) Expected
D) Observed
Unlock Deck
Unlock for access to all 126 flashcards in this deck.
Unlock Deck
k this deck
75
In a chi-square goodness-of-fit-test, the larger the difference between the set of expected
Frequencies and the set of observed frequencies:
A) the more likely we are to conclude that the observed distribution is similar to the expected distribution.
B) the more likely it will be that we will not reject the null hypothesis.
C) the more likely we will reject the null hypothesis.
D) the more likely we will be to not accept the alternative hypothesis.
Unlock Deck
Unlock for access to all 126 flashcards in this deck.
Unlock Deck
k this deck
76
The personnel manager is concerned about absenteeism. She decides to sample the records to
Determine if absenteeism is distributed evenly throughout the six-day workweek. The null
Hypothesis to be tested is: Absenteeism is distributed evenly throughout the week. The 0.01 level is
To be used. The sample results are:
What is the expected frequency?
A) 9
B) 10
C) 11
D) 12
Determine if absenteeism is distributed evenly throughout the six-day workweek. The null
Hypothesis to be tested is: Absenteeism is distributed evenly throughout the week. The 0.01 level is
To be used. The sample results are:
What is the expected frequency?
A) 9
B) 10
C) 11
D) 12
Unlock Deck
Unlock for access to all 126 flashcards in this deck.
Unlock Deck
k this deck
77
The personnel manager is concerned about absenteeism. She decides to sample the records to
Determine if absenteeism is distributed evenly throughout the six-day workweek. The null
Hypothesis to be tested is: Absenteeism is distributed evenly throughout the week. The 0.01 level is
To be used. The sample results are:
Using the Goodness of Fit Test above, what can you state about the observed absences?
A) The 0.8 value of chi-square with 5 df, leads us to conclude that there is a significant difference between the number of absences across the week when tested at the 5% level
Of significance.
B) Absenteeism is distributed evenly throughout the week. The observed differences are due to sampling variation, as supported by the p-value of 0.9770.
C) Absenteeism is not distributed evenly throughout the week. The p-value of 0.9770 strongly supports this conclusion.
D) The 5df lead us to conclude that absenteeism is distributed evenly throughout the week.
Unlock Deck
Unlock for access to all 126 flashcards in this deck.
Unlock Deck
k this deck
78
The chi-square distribution becomes more symmetrical as:
A) number of variables increase.
B) the chi-square value increases.
C) degrees of freedom decrease.
D) degrees of freedom increase.
A) number of variables increase.
B) the chi-square value increases.
C) degrees of freedom decrease.
D) degrees of freedom increase.
Unlock Deck
Unlock for access to all 126 flashcards in this deck.
Unlock Deck
k this deck
79
The chi-square distribution can assume:
A) only positive values.
B) only negative values.
C) negative and positive values or zero.
D) only zero.
A) only positive values.
B) only negative values.
C) negative and positive values or zero.
D) only zero.
Unlock Deck
Unlock for access to all 126 flashcards in this deck.
Unlock Deck
k this deck
80
Six people have declared their intentions to run for a trustee seat in the next local election. A
Political poll is conducted during the campaign among 1,020 voters to determine if there is any clear
Preference among the voters. The responses are shown below.
If the computed chi-square is 30, what is your decision at the 1% level of significance? What is your
Decision at the 5% level of significance?
A) Reject H0; preferences among the candidates exist at the 1% level of significance; also reject at the 5% level of significance.
B) Reject H0 at the 1% level of significance but not at the 5% level of significance.
C) Reject H0 at the 5% level of significance but not at the 1% level of significance.
D) Accept Ho at both the 5% and 1% levels of significance; no preferences among the candidates exist.
Unlock Deck
Unlock for access to all 126 flashcards in this deck.
Unlock Deck
k this deck
Unlock Deck
Unlock for access to all 126 flashcards in this deck.


