Exam 14: Multiple Regression and Correlation Analysis
Exam 1: What Is Statistics79 Questions
Exam 2: Describing Data: Frequencydistributions and Graphic Presentation100 Questions
Exam 3: Describing Data: Numerical Measures214 Questions
Exam 4: Describing Data: Displaying and Exploring Pata138 Questions
Exam 5: A Sulvey of Probability Concepts121 Questions
Exam 6: Discrete Probability Distributions145 Questions
Exam 7: Continuous Probabilitydistributions79 Questions
Exam 8: Sampling Methods and the Central Umit Theorem134 Questions
Exam 9: Estimation and Confidence Intervals140 Questions
Exam 10: One-Sample Tests of Hypothesis111 Questions
Exam 11: Two Sample Tests of Hypothesis103 Questions
Exam 12: Analysis of Variance173 Questions
Exam 13: Linear Regression and Correlation132 Questions
Exam 14: Multiple Regression and Correlation Analysis126 Questions
Exam 15: Chi-Square Applications94 Questions
Exam 16: Decision Making and Payoff Tables in Investment Scenarios151 Questions
Select questions type
For a chi-square test involving a contingency table, suppose the null hypothesis is rejected. We
Conclude that the two variables are:
Free
(Multiple Choice)
5.0/5  (45)
(45)
Correct Answer: Verified
D
i. Tests of hypotheses for nominal or ordinal levels of measurement are called nonparametric or
Distribution-free tests.
ii. There is not one, but a family of chi-square distributions. There is a chi-square distribution for 1
Degree of freedom, another for 2 degrees of freedom, another for 3 degrees of freedom, and so on.
iii. The shape of the chi-square distribution depends on the size of the sample.
Free
(Multiple Choice)
4.8/5 (38)
Correct Answer:Verified
B
What is our decision regarding the differences between the observed and expected frequencies if
The critical value of chi-square is 9.488 and the computed value is 6.079?
Free
(Multiple Choice)
4.8/5 (32)
Correct Answer:Verified
A
i. The sum of the expected frequencies and the sum of the observed frequencies must be equal.
ii. If the computed value of chi-square is less than the critical value, reject the null hypothesis at a
Predetermined level of significance.
iii. If there are only two cells in a goodness-of-fit test, we should expect 5 or more frequencies.
(Multiple Choice)
4.8/5 (48)
Recently, students in a marketing research class were interested in the driving behaviour of
Students. Specifically, the marketing students were interested if exceeding the speed limit was
Related to gender. They collected the following responses from 100 randomly selected students: 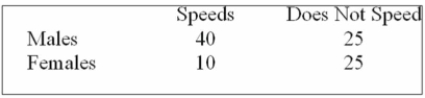 What is the value of the test statistic?
(Multiple Choice)
4.8/5 (29)
i. The null hypothesis in the goodness-of-fit test is that there is no difference.
ii. The alternative hypothesis states that there is a difference between the observed frequencies
And the expected frequencies in a goodness-of-fit test.
iii. The number of degrees of freedom appropriate for the chi-square goodness-of-fit test is the
Number of categories minus 1.
(Multiple Choice)
4.9/5 (36)
The following table shows the adjustment to civilian life and place of residence. 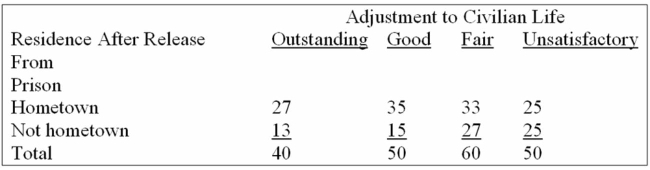 What is the critical value for this contingency table at the 0.01 level of significance?
(Multiple Choice)
4.9/5 (28)
The educational level and the social activity of a sample of executives follow. 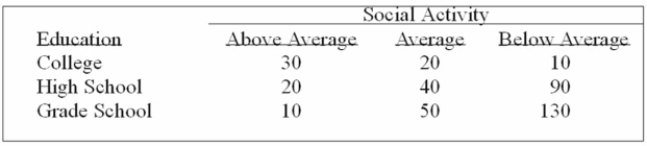 What does the expected frequency for the "above average" social activity and "high school"
Education equal?
What does the expected frequency for the "above average" social activity and "high school"
Education equal?
(Multiple Choice)
4.8/5 (37)
Two chi-square distributions were plotted on the same chart. One distribution was for 3 degrees of
Freedom and the other was for 12 degrees of freedom. Which distribution would tend to approach a
Normal distribution?
(Multiple Choice)
4.7/5 (31)
The following table shows the adjustment to civilian life and place of residence. 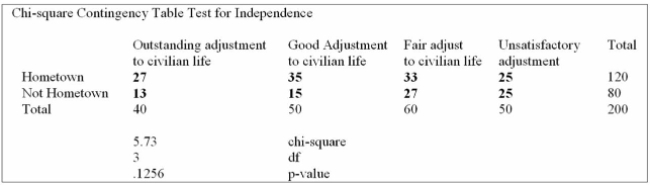 Using the data from this Megastat printout, you determine:
(Multiple Choice)
4.9/5 (31)
A question has these possible choices-excellent, very good, good, fair and unsatisfactory. How
Many degrees of freedom are there, using the goodness-of-fit test to the sample results?
(Multiple Choice)
4.9/5 (39)
A survey of the opinions of property owners about a street widening project was taken to determine
Whether the resulting opinion was related to the distance of front footage. A randomly selected
Sample of 100 property owners was contacted and the results are shown below. 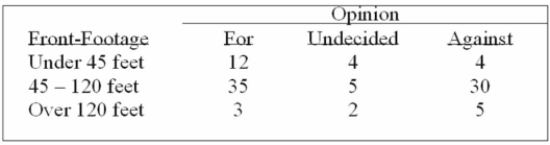 What is the expected frequency for people against the project and who have over 120 feet of
Property foot-frontage?
What is the expected frequency for people against the project and who have over 120 feet of
Property foot-frontage?
(Multiple Choice)
4.8/5 (33)
A student asked a statistics professor if grades were marked "on the curve." The professor decided
To give the student a project to determine if last year's statistics grades were normally distributed.
The professor told the student that last year's mean mark was 70 with a standard deviation of 10
And to use the following results. 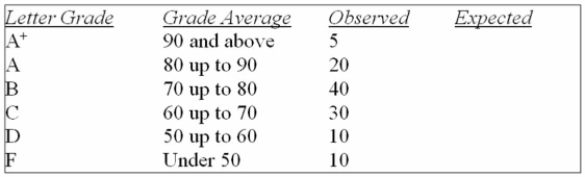
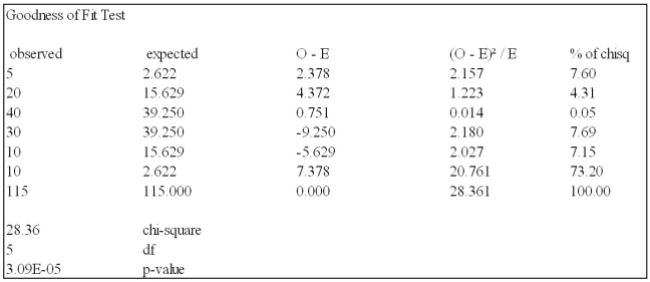 Using the data from this Megastat printout, you determine:
(Multiple Choice)
4.9/5 (37)
A school is trying to determine if there is a relationship between gender and which of its 3 programs
That students enrol. It was observed that 20 females enrolled in accounting, 15 in finance and 25 in
Marketing. For males, 10 enrolled in accounting, 20 enrolled in finance and 15 enrolled in marketing.
Can we conclude that there is a relationship between gender and program? Use the 0.05
Significance level.
(Multiple Choice)
4.9/5 (33)
At a recent car show, a sample of 125 people produced the following results. Use the 0.01
Significance level to determine if there is a relationship between age and model preferred. 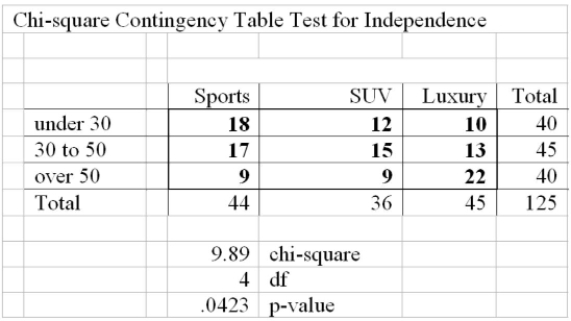
(Multiple Choice)
4.9/5 (38)
Six people have declared their intentions to run for a trustee seat in the next local election. A
Political poll is conducted during the campaign among 1,020 voters to determine if there is any clear
Preference among the voters. The responses are shown below. 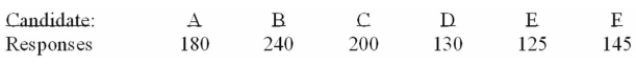 What is the critical value at the 5% level of significance?
(Multiple Choice)
4.7/5 (33)
i. If the computed value of chi-square is less than the critical value, reject the null hypothesis at a
Predetermined level of significance.
ii. The alternative hypothesis states that there is a difference between the observed frequencies
And the expected frequencies in a goodness-of-fit test.
iii. There are 2 degrees of freedom for a contingency table classifying three levels of income with
Each gender.
(Multiple Choice)
4.9/5 (37)
i. Nonparametric tests require no assumptions about the shape of the population distribution.
ii. There is not one, but a family of chi-square distributions. There is a chi-square distribution for 1
Degree of freedom, another for 2 degrees of freedom, another for 3 degrees of freedom, and so on.
iii. The chi-square distribution with large degrees of freedom approaches a normal distribution.
(Multiple Choice)
4.8/5 (39)
i. The chi-square distribution is positively skewed.
ii. Nonparametric tests of hypothesis, which are also called distribution free tests, require the
Population to be normally distributed.
iii. The computed value of chi-square is always positive because the difference between the
Observed frequencies and the expected frequencies are squared.
(Multiple Choice)
4.8/5 (35)
A student asked a statistics professor if grades were marked "on the curve." The professor decided
To give the student a project to determine if last year's statistics grades were normally distributed.
The professor told the student that last year's mean mark was 70 with a standard deviation of 10
And to use the following results. 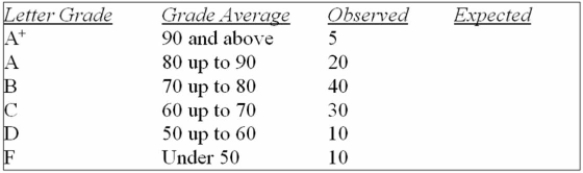 What is the expected number of F's?
(Multiple Choice)
4.9/5 (40)
Filters
- Essay(0)
- Multiple Choice(0)
- Short Answer(0)
- True False(0)
- Matching(0)