Deck 5: Descriptive Statistics
Full screen (f)
Question
This question relates to the output below:  The variable is not bimodal because
A)It is actually bimedial
B)The average of the median and the mode is more than the mean
C)5 is the sole modal value because 7 people scored 5 and no other score has as many as that
D)Even though there are two modes the distribution is not itself bimodal
E)The distribution is too skewed to be bimodal
The variable is not bimodal becauseA)It is actually bimedial
B)The average of the median and the mode is more than the mean
C)5 is the sole modal value because 7 people scored 5 and no other score has as many as that
D)Even though there are two modes the distribution is not itself bimodal
E)The distribution is too skewed to be bimodal
Question
This question relates to the output below:  How can see that this variable is negatively skewed?
A)The median is the average of the mean and mode.
B)The median is higher than the mean.
C)The median is the arithmetic mean of the mode.
D)This is a trick questions because actually the variable is positively skewed.
E)Both (a)and (c).
How can see that this variable is negatively skewed?A)The median is the average of the mean and mode.
B)The median is higher than the mean.
C)The median is the arithmetic mean of the mode.
D)This is a trick questions because actually the variable is positively skewed.
E)Both (a)and (c).
Question
This question relates to the output below.Here scores for two variables, pride and prejudice, were collected from a sample of 100 people.Unfortunately scores for 75 participants on the pride variable were lost, but responses were obtained for all participants on the prejudice variable.From the SPSS output, what can you confidently say about the two variables? 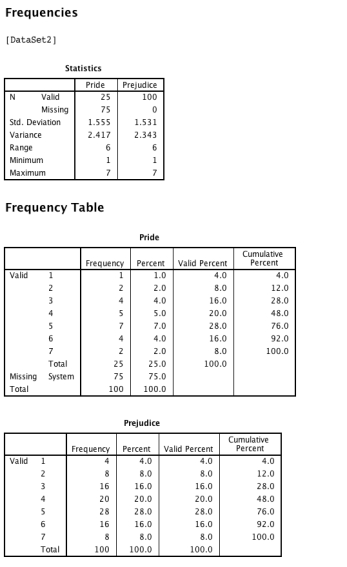
A)The range of scores is the same in the two variables.
B)The valid percent is 100.0 for both variables even though there are missing data so that indicates a computer problem.
C)Both (a)and (b).
D)Prejudice is far more skewed than pride.
E)Both (a)and (d).
A)The range of scores is the same in the two variables.
B)The valid percent is 100.0 for both variables even though there are missing data so that indicates a computer problem.
C)Both (a)and (b).
D)Prejudice is far more skewed than pride.
E)Both (a)and (d).
Question
This question relates to the output below:  Which of the following statements is false?
A)The median is a good guide to central tendency here.
B)The variable is bimodal.
C)The variable is skewed.
D)No scores lie on the mean value.
E)The median is the same as the mode.
Which of the following statements is false?A)The median is a good guide to central tendency here.
B)The variable is bimodal.
C)The variable is skewed.
D)No scores lie on the mean value.
E)The median is the same as the mode.
Question
Question
A researcher interested in observing sleep patterns asks people to come into her sleep laboratory so that their sleep behaviour can be systematically monitored.One of the things she is interested in is the relationship between the number of times a person rolls over in the night and their ability to perform a range of cognitive tasks the following day.If the shaded bars in the graph below represent the number of times a sample of 25 people roll over in the night, which of the following statements is true? 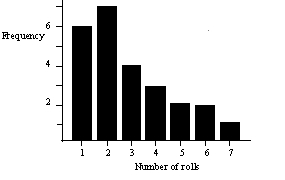
A)The distribution of number of rolls is negatively skewed.
B)The modal number of rolls is 3.
C)The mean number of rolls is 2.
D)The median number of rolls is 2.
E)The mean is probably the most appropriate measure of central tendency.
A)The distribution of number of rolls is negatively skewed.
B)The modal number of rolls is 3.
C)The mean number of rolls is 2.
D)The median number of rolls is 2.
E)The mean is probably the most appropriate measure of central tendency.
Question
Question
This question relates to the output below:  Why might the mean, median and mode appear to be bad measures of dispersion to use here?
A)Because they are all close together, and indeed the median and mode are the same.
B)Because the variable is drawn from a normal population.
C)Because they are not measures of dispersion at all they are actually measures of central tendency.
D)Both (a)and (c).
E)Both (a)and (b).
Why might the mean, median and mode appear to be bad measures of dispersion to use here?A)Because they are all close together, and indeed the median and mode are the same.
B)Because the variable is drawn from a normal population.
C)Because they are not measures of dispersion at all they are actually measures of central tendency.
D)Both (a)and (c).
E)Both (a)and (b).
Question
This question relates to the output below: 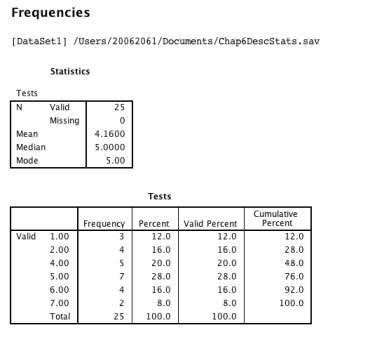 Which of the following statements is true?
A)The mean must be an even number because all the scores are even numbers.
B)We need to know the standard deviation to know which valid scores are missing.
C)The variable is bimodal.
D)The median is a good guide to central tendency here.
E)The variable is not bimodal but the population is.
Which of the following statements is true?A)The mean must be an even number because all the scores are even numbers.
B)We need to know the standard deviation to know which valid scores are missing.
C)The variable is bimodal.
D)The median is a good guide to central tendency here.
E)The variable is not bimodal but the population is.
Question
This question relates to the output below:  How was the mean value of 4.16 calculated?
A)Dividing the square root of N by the number of scores.
B)Looking up a table of values for the area under a normal curve with N = 25.
C)By invoking the central limit theorem.
D)By dividing the sum of scores by the number of scores.
E)By dividing the sum of scores by the sum of the modal scores.
How was the mean value of 4.16 calculated?A)Dividing the square root of N by the number of scores.
B)Looking up a table of values for the area under a normal curve with N = 25.
C)By invoking the central limit theorem.
D)By dividing the sum of scores by the number of scores.
E)By dividing the sum of scores by the sum of the modal scores.
Question
This question relates to the output below:  Which of the following is true?
A)The variable is positively skewed because all the values are positive.
B)The mode is calculated by taking the sum of the scores and dividing by the number of scores (25).
C)The median is an approximation to the mode.
D)Most distributions are skewed so we call these skewed distributions "normal" distributions.
E)The table provides descriptive rather than inferential statistics.
Which of the following is true?A)The variable is positively skewed because all the values are positive.
B)The mode is calculated by taking the sum of the scores and dividing by the number of scores (25).
C)The median is an approximation to the mode.
D)Most distributions are skewed so we call these skewed distributions "normal" distributions.
E)The table provides descriptive rather than inferential statistics.
Question
This question relates to the output below.Looking at this, why would psychology researchers would be very disappointed to receive these results? 
A)In the table N is shown as "Valid" but the Mean, Median and Mode are all "Missing".
B)These are bad examples of distributions with medians the same as the mode.
C)The mean is not a an even number so it is hard to tell what the results actually mean
D)The "Total" for "Cumulative Percent" is missing
E)None of the above
Question
The shaded bars in the histogram below represent the times (rounded to the nearest 10 milliseconds)that 50 people take to react to a loud noise.Which of the following statements is true? 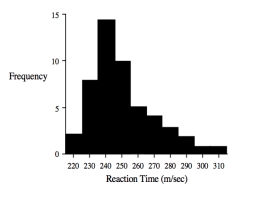
A)The distribution of reaction times is positively skewed.
B)The modal reaction time is 250 ms.
C)The median reaction time is less than 250 ms.
D)The mean reaction time will be less than the modal reaction time.
E)The mean is an unambiguous measure of central tendency.
A)The distribution of reaction times is positively skewed.
B)The modal reaction time is 250 ms.
C)The median reaction time is less than 250 ms.
D)The mean reaction time will be less than the modal reaction time.
E)The mean is an unambiguous measure of central tendency.
Question
Question
Question
Question
This question relates to the output below.Here scores for two variables, pride and prejudice, were collected from a sample of 100 people.Unfortunately scores for 75 participants on the pride variable were lost, but responses were obtained for all participants on the prejudice variable.From the SPSS output, which of the following statements is false? 
A)The smaller population size ensures the sample is a biased estimate.
B)Each standard deviation is the square root of the variance.
C)Statmement (b)is true but only for prejudice (where N = 100).
D)The standard deviation for pride is similar to that for prejudice.
E)Both (a)and (c).
A)The smaller population size ensures the sample is a biased estimate.
B)Each standard deviation is the square root of the variance.
C)Statmement (b)is true but only for prejudice (where N = 100).
D)The standard deviation for pride is similar to that for prejudice.
E)Both (a)and (c).
Question
This question relates to the output below:  Which of the following statements is not true?
A)The mode is 7 because 8 people (N)scored "7" and we need to subtract 1 from 8 to control for bias.
B)Nearly half the participants scored less than the median.
C)There were no missing data in the 25 scores.
D)The variable is positively skewed.
E)Both (a)and (d).
Which of the following statements is not true?A)The mode is 7 because 8 people (N)scored "7" and we need to subtract 1 from 8 to control for bias.
B)Nearly half the participants scored less than the median.
C)There were no missing data in the 25 scores.
D)The variable is positively skewed.
E)Both (a)and (d).
Question
This question relates to the output below.Here scores for two variables, pride and prejudice, were collected from a sample of 100 people.Unfortunately scores for 75 participants on the pride variable were lost, but responses were obtained for all participants on the prejudice variable.From the SPSS output, which of the following statements is true? 
A)Pride is bimodal.
B)Pride and prejudice have very similar distributions despite the different sample sizes.
C)Prejudice should have a higher variance because there are more people in the sample.
D)Prejudice should have a higher variance because there are more people in the population.
E)Both (a)and (d).
Question
Question
"Statistical notation for the mean of X." What statistic is this a glossary definition of?
A)(X-bar)
B)ΨX (psi X)
C)∑X (sigma X)
D)Xβ (X-beta)
E)μ (mu)
A)(X-bar)
B)ΨX (psi X)
C)∑X (sigma X)
D)Xβ (X-beta)
E)μ (mu)
Question
Question
Question
Question

Unlock Deck
Sign up to unlock the cards in this deck!
Unlock Deck
Unlock Deck
1/25
Play
Full screen (f)
Deck 5: Descriptive Statistics
1
This question relates to the output below: The variable is not bimodal because
A)It is actually bimedial
B)The average of the median and the mode is more than the mean
C)5 is the sole modal value because 7 people scored 5 and no other score has as many as that
D)Even though there are two modes the distribution is not itself bimodal
E)The distribution is too skewed to be bimodal
The variable is not bimodal becauseA)It is actually bimedial
B)The average of the median and the mode is more than the mean
C)5 is the sole modal value because 7 people scored 5 and no other score has as many as that
D)Even though there are two modes the distribution is not itself bimodal
E)The distribution is too skewed to be bimodal
5 is the sole modal value because 7 people scored 5 and no other score has as many as that
2
This question relates to the output below: How can see that this variable is negatively skewed?
A)The median is the average of the mean and mode.
B)The median is higher than the mean.
C)The median is the arithmetic mean of the mode.
D)This is a trick questions because actually the variable is positively skewed.
E)Both (a)and (c).
How can see that this variable is negatively skewed?A)The median is the average of the mean and mode.
B)The median is higher than the mean.
C)The median is the arithmetic mean of the mode.
D)This is a trick questions because actually the variable is positively skewed.
E)Both (a)and (c).
The median is higher than the mean.
3
This question relates to the output below.Here scores for two variables, pride and prejudice, were collected from a sample of 100 people.Unfortunately scores for 75 participants on the pride variable were lost, but responses were obtained for all participants on the prejudice variable.From the SPSS output, what can you confidently say about the two variables?
A)The range of scores is the same in the two variables.
B)The valid percent is 100.0 for both variables even though there are missing data so that indicates a computer problem.
C)Both (a)and (b).
D)Prejudice is far more skewed than pride.
E)Both (a)and (d).
A)The range of scores is the same in the two variables.
B)The valid percent is 100.0 for both variables even though there are missing data so that indicates a computer problem.
C)Both (a)and (b).
D)Prejudice is far more skewed than pride.
E)Both (a)and (d).
The range of scores is the same in the two variables.
4
This question relates to the output below: Which of the following statements is false?
A)The median is a good guide to central tendency here.
B)The variable is bimodal.
C)The variable is skewed.
D)No scores lie on the mean value.
E)The median is the same as the mode.
Which of the following statements is false?A)The median is a good guide to central tendency here.
B)The variable is bimodal.
C)The variable is skewed.
D)No scores lie on the mean value.
E)The median is the same as the mode.
Unlock Deck
Unlock for access to all 25 flashcards in this deck.
Unlock Deck
k this deck
5
"A measure on which the obtained values reflect the ordering of responses on a continuum, but where the intervals between scores are not necessarily equal." What type of measure is this a glossary definition of?
A)An ordinal measure.
B)A nominal measure.
C)A scale measure.
D)A desperate measure.
E)Am approximation measure.
A)An ordinal measure.
B)A nominal measure.
C)A scale measure.
D)A desperate measure.
E)Am approximation measure.
Unlock Deck
Unlock for access to all 25 flashcards in this deck.
Unlock Deck
k this deck
6
A researcher interested in observing sleep patterns asks people to come into her sleep laboratory so that their sleep behaviour can be systematically monitored.One of the things she is interested in is the relationship between the number of times a person rolls over in the night and their ability to perform a range of cognitive tasks the following day.If the shaded bars in the graph below represent the number of times a sample of 25 people roll over in the night, which of the following statements is true?
A)The distribution of number of rolls is negatively skewed.
B)The modal number of rolls is 3.
C)The mean number of rolls is 2.
D)The median number of rolls is 2.
E)The mean is probably the most appropriate measure of central tendency.
A)The distribution of number of rolls is negatively skewed.
B)The modal number of rolls is 3.
C)The mean number of rolls is 2.
D)The median number of rolls is 2.
E)The mean is probably the most appropriate measure of central tendency.
Unlock Deck
Unlock for access to all 25 flashcards in this deck.
Unlock Deck
k this deck
7
A researcher conducts a study to find out how many days out of the country people had had in the previous year.Six people participated in the study and the numbers of days they had been out of the country were 0, 2, 5, 7, 1 and 0.Which of the following statements is true?
A)The mean number of days abroad is 2.
B)The median number of days abroad is 1.
C)The median number of days abroad is 2.
D)The modal number of days abroad is 2.
E)The modal number of days abroad is 0.
A)The mean number of days abroad is 2.
B)The median number of days abroad is 1.
C)The median number of days abroad is 2.
D)The modal number of days abroad is 2.
E)The modal number of days abroad is 0.
Unlock Deck
Unlock for access to all 25 flashcards in this deck.
Unlock Deck
k this deck
8
This question relates to the output below: Why might the mean, median and mode appear to be bad measures of dispersion to use here?
A)Because they are all close together, and indeed the median and mode are the same.
B)Because the variable is drawn from a normal population.
C)Because they are not measures of dispersion at all they are actually measures of central tendency.
D)Both (a)and (c).
E)Both (a)and (b).
Why might the mean, median and mode appear to be bad measures of dispersion to use here?A)Because they are all close together, and indeed the median and mode are the same.
B)Because the variable is drawn from a normal population.
C)Because they are not measures of dispersion at all they are actually measures of central tendency.
D)Both (a)and (c).
E)Both (a)and (b).
Unlock Deck
Unlock for access to all 25 flashcards in this deck.
Unlock Deck
k this deck
9
This question relates to the output below: Which of the following statements is true?
A)The mean must be an even number because all the scores are even numbers.
B)We need to know the standard deviation to know which valid scores are missing.
C)The variable is bimodal.
D)The median is a good guide to central tendency here.
E)The variable is not bimodal but the population is.
Which of the following statements is true?A)The mean must be an even number because all the scores are even numbers.
B)We need to know the standard deviation to know which valid scores are missing.
C)The variable is bimodal.
D)The median is a good guide to central tendency here.
E)The variable is not bimodal but the population is.
Unlock Deck
Unlock for access to all 25 flashcards in this deck.
Unlock Deck
k this deck
10
This question relates to the output below: How was the mean value of 4.16 calculated?
A)Dividing the square root of N by the number of scores.
B)Looking up a table of values for the area under a normal curve with N = 25.
C)By invoking the central limit theorem.
D)By dividing the sum of scores by the number of scores.
E)By dividing the sum of scores by the sum of the modal scores.
How was the mean value of 4.16 calculated?A)Dividing the square root of N by the number of scores.
B)Looking up a table of values for the area under a normal curve with N = 25.
C)By invoking the central limit theorem.
D)By dividing the sum of scores by the number of scores.
E)By dividing the sum of scores by the sum of the modal scores.
Unlock Deck
Unlock for access to all 25 flashcards in this deck.
Unlock Deck
k this deck
11
This question relates to the output below: Which of the following is true?
A)The variable is positively skewed because all the values are positive.
B)The mode is calculated by taking the sum of the scores and dividing by the number of scores (25).
C)The median is an approximation to the mode.
D)Most distributions are skewed so we call these skewed distributions "normal" distributions.
E)The table provides descriptive rather than inferential statistics.
Which of the following is true?A)The variable is positively skewed because all the values are positive.
B)The mode is calculated by taking the sum of the scores and dividing by the number of scores (25).
C)The median is an approximation to the mode.
D)Most distributions are skewed so we call these skewed distributions "normal" distributions.
E)The table provides descriptive rather than inferential statistics.
Unlock Deck
Unlock for access to all 25 flashcards in this deck.
Unlock Deck
k this deck
12
This question relates to the output below.Looking at this, why would psychology researchers would be very disappointed to receive these results?
A)In the table N is shown as "Valid" but the Mean, Median and Mode are all "Missing".
B)These are bad examples of distributions with medians the same as the mode.
C)The mean is not a an even number so it is hard to tell what the results actually mean
D)The "Total" for "Cumulative Percent" is missing
E)None of the above
Unlock Deck
Unlock for access to all 25 flashcards in this deck.
Unlock Deck
k this deck
13
The shaded bars in the histogram below represent the times (rounded to the nearest 10 milliseconds)that 50 people take to react to a loud noise.Which of the following statements is true?
A)The distribution of reaction times is positively skewed.
B)The modal reaction time is 250 ms.
C)The median reaction time is less than 250 ms.
D)The mean reaction time will be less than the modal reaction time.
E)The mean is an unambiguous measure of central tendency.
A)The distribution of reaction times is positively skewed.
B)The modal reaction time is 250 ms.
C)The median reaction time is less than 250 ms.
D)The mean reaction time will be less than the modal reaction time.
E)The mean is an unambiguous measure of central tendency.
Unlock Deck
Unlock for access to all 25 flashcards in this deck.
Unlock Deck
k this deck
14
A teacher conducts a study in which she records the names of students who come top in her statistics class every year to see if she can find any patterns over time.She has been doing this for 16 years.What type of dependent measure does her study have?
A)Nominal.
B)Ordinal.
C)Interval.
D)Ratio.
E)None of the above.
A)Nominal.
B)Ordinal.
C)Interval.
D)Ratio.
E)None of the above.
Unlock Deck
Unlock for access to all 25 flashcards in this deck.
Unlock Deck
k this deck
15
Which of the following statements is likely to be false if the distribution of a variable is normally distributed?
A)The mean will be a good measure of central tendency.
B)The median will be similar to the mean.
C)The mode will be similar to the mean.
D)The median will be similar to the mode.
E)None of the above (all are true).
A)The mean will be a good measure of central tendency.
B)The median will be similar to the mean.
C)The mode will be similar to the mean.
D)The median will be similar to the mode.
E)None of the above (all are true).
Unlock Deck
Unlock for access to all 25 flashcards in this deck.
Unlock Deck
k this deck
16
"Numerical statements about the properties of some data." What type of statistics is this a glossary definition of?
A)Descriptive statistics.
B)Inferential statistics.
C)Vital statistics.
D)Numerical statistics.
E)Sampling statistics.
A)Descriptive statistics.
B)Inferential statistics.
C)Vital statistics.
D)Numerical statistics.
E)Sampling statistics.
Unlock Deck
Unlock for access to all 25 flashcards in this deck.
Unlock Deck
k this deck
17
This question relates to the output below.Here scores for two variables, pride and prejudice, were collected from a sample of 100 people.Unfortunately scores for 75 participants on the pride variable were lost, but responses were obtained for all participants on the prejudice variable.From the SPSS output, which of the following statements is false?
A)The smaller population size ensures the sample is a biased estimate.
B)Each standard deviation is the square root of the variance.
C)Statmement (b)is true but only for prejudice (where N = 100).
D)The standard deviation for pride is similar to that for prejudice.
E)Both (a)and (c).
A)The smaller population size ensures the sample is a biased estimate.
B)Each standard deviation is the square root of the variance.
C)Statmement (b)is true but only for prejudice (where N = 100).
D)The standard deviation for pride is similar to that for prejudice.
E)Both (a)and (c).
Unlock Deck
Unlock for access to all 25 flashcards in this deck.
Unlock Deck
k this deck
18
This question relates to the output below: Which of the following statements is not true?
A)The mode is 7 because 8 people (N)scored "7" and we need to subtract 1 from 8 to control for bias.
B)Nearly half the participants scored less than the median.
C)There were no missing data in the 25 scores.
D)The variable is positively skewed.
E)Both (a)and (d).
Which of the following statements is not true?A)The mode is 7 because 8 people (N)scored "7" and we need to subtract 1 from 8 to control for bias.
B)Nearly half the participants scored less than the median.
C)There were no missing data in the 25 scores.
D)The variable is positively skewed.
E)Both (a)and (d).
Unlock Deck
Unlock for access to all 25 flashcards in this deck.
Unlock Deck
k this deck
19
This question relates to the output below.Here scores for two variables, pride and prejudice, were collected from a sample of 100 people.Unfortunately scores for 75 participants on the pride variable were lost, but responses were obtained for all participants on the prejudice variable.From the SPSS output, which of the following statements is true?
A)Pride is bimodal.
B)Pride and prejudice have very similar distributions despite the different sample sizes.
C)Prejudice should have a higher variance because there are more people in the sample.
D)Prejudice should have a higher variance because there are more people in the population.
E)Both (a)and (d).
Unlock Deck
Unlock for access to all 25 flashcards in this deck.
Unlock Deck
k this deck
20
Which of the following is a measure of dispersion?
A)The mean of a distribution.
B)The mean squared deviation of some data.
C)The modal value of a set of values.
D)The median response on a scale.
E)An average score.
A)The mean of a distribution.
B)The mean squared deviation of some data.
C)The modal value of a set of values.
D)The median response on a scale.
E)An average score.
Unlock Deck
Unlock for access to all 25 flashcards in this deck.
Unlock Deck
k this deck
21
"Statistical notation for the mean of X." What statistic is this a glossary definition of?
A)(X-bar)
B)ΨX (psi X)
C)∑X (sigma X)
D)Xβ (X-beta)
E)μ (mu)
A)(X-bar)
B)ΨX (psi X)
C)∑X (sigma X)
D)Xβ (X-beta)
E)μ (mu)
Unlock Deck
Unlock for access to all 25 flashcards in this deck.
Unlock Deck
k this deck
22
"The degree of non-symmetry in the distribution of scores on a given variable." What feature of data is this a glossary definition of?
A)Kurtosis.
B)Skew.
C)Abnormality.
D)Deviation.
E)Standard deviation.
A)Kurtosis.
B)Skew.
C)Abnormality.
D)Deviation.
E)Standard deviation.
Unlock Deck
Unlock for access to all 25 flashcards in this deck.
Unlock Deck
k this deck
23
"Statistical notation indicating summation (i.e.'the sum of …')." What is this a glossary definition of?
A)Δ (delta)
B)Ψ (psi)
C)∑ (sigma)
D)β (beta)
E)μ (mu)
A)Δ (delta)
B)Ψ (psi)
C)∑ (sigma)
D)β (beta)
E)μ (mu)
Unlock Deck
Unlock for access to all 25 flashcards in this deck.
Unlock Deck
k this deck
24
"The procedure for reducing the number of digits reported after a decimal point where a calculation produces more digits than necessary." What procedure is this a glossary definition of?
A)Recallibration.
B)Rounding.
C)Squaring.
D)Simplification.
E)Shortening.
A)Recallibration.
B)Rounding.
C)Squaring.
D)Simplification.
E)Shortening.
Unlock Deck
Unlock for access to all 25 flashcards in this deck.
Unlock Deck
k this deck
25
"The middle score of a set of scores.It is equal to the ((N + 1)/2)th value, where N is the number of scores in the data set." What statistic is this a glossary definition of?
A)The mode
B)The median
C)The mean
D)The prototype
E)The middlium
A)The mode
B)The median
C)The mean
D)The prototype
E)The middlium
Unlock Deck
Unlock for access to all 25 flashcards in this deck.
Unlock Deck
k this deck
Unlock Deck
Unlock for access to all 25 flashcards in this deck.


