Exam 5: Descriptive Statistics
Exam 1: Research in Psychology: Objectives and Ideals25 Questions
Exam 2: Research Methods24 Questions
Exam 3: Experimental Design24 Questions
Exam 4: Survey Design23 Questions
Exam 5: Descriptive Statistics25 Questions
Exam 6: Some Principles of Statistical Inference20 Questions
Exam 7: Examining Differences Between Means: The T-Test151 Questions
Select questions type
"The procedure for reducing the number of digits reported after a decimal point where a calculation produces more digits than necessary." What procedure is this a glossary definition of?
Free
(Multiple Choice)
4.9/5  (39)
(39)
Correct Answer: Verified
B
This question relates to the output below.Looking at this, why would psychology researchers would be very disappointed to receive these results? 
Free
(Multiple Choice)
4.9/5 (36)
Correct Answer:Verified
E
This question relates to the output below:  Which of the following statements is false?
Free
(Multiple Choice)
4.8/5 (31)
Correct Answer:Verified
B
"The degree of non-symmetry in the distribution of scores on a given variable." What feature of data is this a glossary definition of?
(Multiple Choice)
4.7/5 (31)
This question relates to the output below.Here scores for two variables, pride and prejudice, were collected from a sample of 100 people.Unfortunately scores for 75 participants on the pride variable were lost, but responses were obtained for all participants on the prejudice variable.From the SPSS output, which of the following statements is false? 
(Multiple Choice)
4.8/5 (31)
"Statistical notation indicating summation (i.e.'the sum of …')." What is this a glossary definition of?
(Multiple Choice)
4.8/5 (28)
"The middle score of a set of scores.It is equal to the ((N + 1)/2)th value, where N is the number of scores in the data set." What statistic is this a glossary definition of?
(Multiple Choice)
4.8/5 (38)
Which of the following statements is likely to be false if the distribution of a variable is normally distributed?
(Multiple Choice)
4.8/5 (40)
This question relates to the output below: 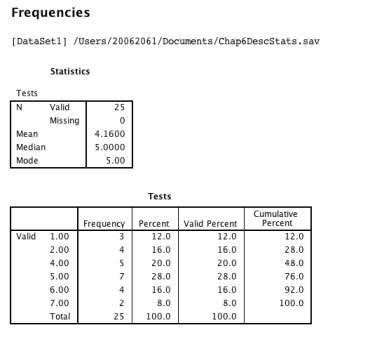 Which of the following statements is true?
(Multiple Choice)
4.8/5 (31)
"Numerical statements about the properties of some data." What type of statistics is this a glossary definition of?
(Multiple Choice)
4.8/5 (32)
"Statistical notation for the mean of X." What statistic is this a glossary definition of?
(Multiple Choice)
4.7/5 (38)
"A measure on which the obtained values reflect the ordering of responses on a continuum, but where the intervals between scores are not necessarily equal." What type of measure is this a glossary definition of?
(Multiple Choice)
5.0/5 (25)
The shaded bars in the histogram below represent the times (rounded to the nearest 10 milliseconds)that 50 people take to react to a loud noise.Which of the following statements is true? 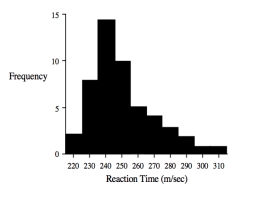
(Multiple Choice)
4.8/5 (27)
A researcher conducts a study to find out how many days out of the country people had had in the previous year.Six people participated in the study and the numbers of days they had been out of the country were 0, 2, 5, 7, 1 and 0.Which of the following statements is true?
(Multiple Choice)
4.8/5 (41)
This question relates to the output below:  How was the mean value of 4.16 calculated?
(Multiple Choice)
4.8/5 (30)
This question relates to the output below:  Why might the mean, median and mode appear to be bad measures of dispersion to use here?
(Multiple Choice)
5.0/5 (25)
A teacher conducts a study in which she records the names of students who come top in her statistics class every year to see if she can find any patterns over time.She has been doing this for 16 years.What type of dependent measure does her study have?
(Multiple Choice)
4.8/5 (34)
A researcher interested in observing sleep patterns asks people to come into her sleep laboratory so that their sleep behaviour can be systematically monitored.One of the things she is interested in is the relationship between the number of times a person rolls over in the night and their ability to perform a range of cognitive tasks the following day.If the shaded bars in the graph below represent the number of times a sample of 25 people roll over in the night, which of the following statements is true? 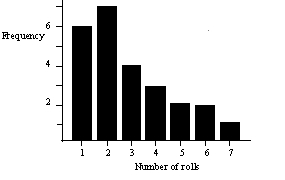
(Multiple Choice)
4.9/5 (40)
This question relates to the output below.Here scores for two variables, pride and prejudice, were collected from a sample of 100 people.Unfortunately scores for 75 participants on the pride variable were lost, but responses were obtained for all participants on the prejudice variable.From the SPSS output, what can you confidently say about the two variables? 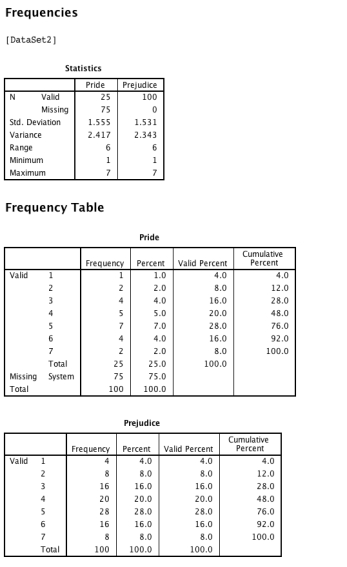
(Multiple Choice)
4.8/5 (26)
Filters
- Essay(0)
- Multiple Choice(0)
- Short Answer(0)
- True False(0)
- Matching(0)