Deck 3: Business Fluctuations: Aggregate Demand and Supply
Full screen (f)
Question
(Figure: Demand Curve) Which of the following statements is TRUE regarding the figure? 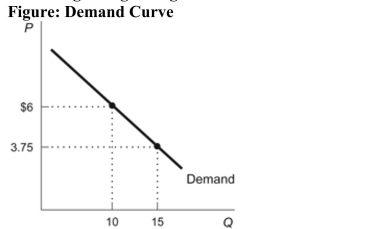 I. At a price of $6 per unit, consumers are willing and able to buy 10 units. II. The maximum price demanders are willing to pay for 15 units is $3.75 per unit. III. The higher the price, the greater the quantity demanded. IV. At a price of $3.75 per unit, consumers are indifferent between buying 10 and 15 units.
A) I only
B) I and II only
C) I, II, and III
D) I, II, and IV
I. At a price of $6 per unit, consumers are willing and able to buy 10 units. II. The maximum price demanders are willing to pay for 15 units is $3.75 per unit. III. The higher the price, the greater the quantity demanded. IV. At a price of $3.75 per unit, consumers are indifferent between buying 10 and 15 units.A) I only
B) I and II only
C) I, II, and III
D) I, II, and IV
Question
Question
Question
Question
(Figure: Demand Curve) Refer to the figure. What is the maximum price per book that buyers are willing to pay for 2,500 books? Figure: Demand Curve 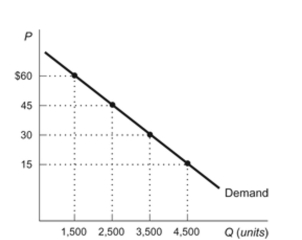
A) $60
B) $45
C) $30
D) $15
A) $60
B) $45
C) $30
D) $15
Question
Question
Question
(Figure: Consumer Surplus) Refer to the figure. Calculate the dollar amount of consumer surplus being earned in this market. 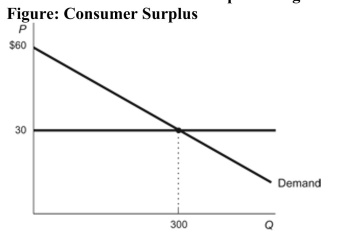
A) $4,500
B) $9,000
C) $18,000
D) $450
A) $4,500
B) $9,000
C) $18,000
D) $450
Question
(Figure: Willingness to Pay) Refer to the figure. What is the maximum amount that buyers are willing to buy at a price of $45 per book? 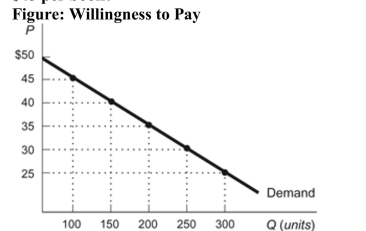
A) 300 books
B) 450 books
C) 0 books
D) 100 books
A) 300 books
B) 450 books
C) 0 books
D) 100 books
Question
Question
(Table: Excel Company) The table shows the results of Excel Company's market survey. If the market price of Excel computers is $1,200 each, how much total consumer surplus (in $) are the four consumers earning? 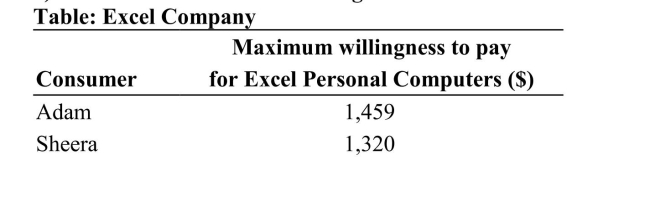

A) $380
B) $415
C) $345
D) $5,145
A) $380
B) $415
C) $345
D) $5,145
Question
(Table: Maximum Willingness to Pay) The table shows four individuals' maximum willingness to pay for one pound of bananas. If the market price of bananas is $0.50/lb, what is the total consumer surplus in the market? 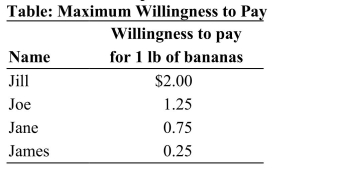
A) $4.00
B) $2.50
C) $2.75
D) $4.25
A) $4.00
B) $2.50
C) $2.75
D) $4.25
Question
Question
Question
Question
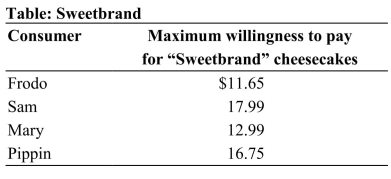 Reference: Ref 3-1 (Table: Sweetbrand) The table shows the maximum consumer willingness to pay for "Sweetbrand" cheesecakes. Which of the four consumers receives the smallest consumer surplus, if the market price of the cheesecakes is $12.50 each?
A) Frodo
B) Sam
C) Mary
D) Pippin
Question
Question
Question
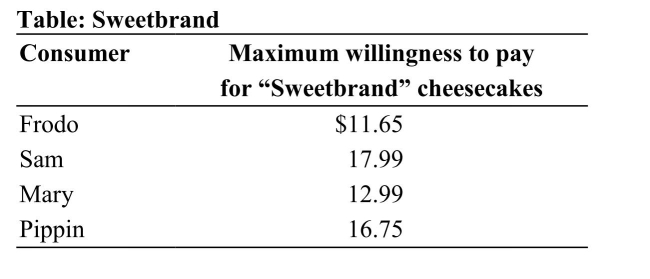 Reference: Ref 3-1 (Table: Sweetbrand) The table shows the maximum consumer willingness to pay for "Sweetbrand" cheesecakes. Which of the four consumers receives the most consumer surplus, if the market price of the cheesecakes is $12.50 each?
A) Frodo
B) Sam
C) Mary
D) Pippin
Question
Question
Question
Question
Question
Question
Question
(Figure: Demand Shift) Which of the following factors would cause the change in the figure? Figure: Demand Shift 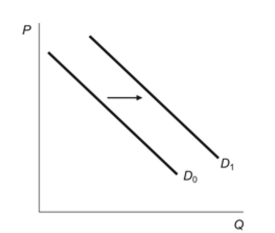 I. an increase in the price of a complement good II. an increase in production costs III. an increase in the price of a substitute good IV. an increase in income for an inferior good
A) I and III only
B) II and IV only
C) III only
D) I, II, and III
I. an increase in the price of a complement good II. an increase in production costs III. an increase in the price of a substitute good IV. an increase in income for an inferior goodA) I and III only
B) II and IV only
C) III only
D) I, II, and III
Question
Question
(Figure: Demand Shift) Which of the following could explain the figure? 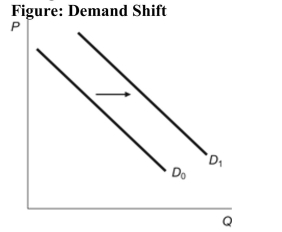
A) Consumer income increases in the market for a normal good.
B) Consumer income falls in the market for a normal good.
C) Consumer income rises in the market for an inferior good.
D) Consumer income falls in the market for a luxury good.
A) Consumer income increases in the market for a normal good.
B) Consumer income falls in the market for a normal good.
C) Consumer income rises in the market for an inferior good.
D) Consumer income falls in the market for a luxury good.
Question
Question
Question
(Figure: Earned Consumer Surplus) Refer to the figure. The market price of the product is $20 per unit. Calculate the dollar amount of consumer surplus being earned in this market. Figure: Earned Consumer Surplus 
A) $120,000
B) $60,000
C) $100,000
D) $80,000
A) $120,000
B) $60,000
C) $100,000
D) $80,000
Question
Question
Question
Question
Question
Question
Question
Question
Question
Question
(Figure: Oil Market) Refer to the figure. Which of the following events could cause the change in the figure? 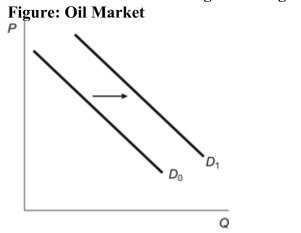
A) the expectation of an outbreak of war in the world's best oil producing regions
B) the expectation of a reduction in the future supply of oil
C) the expectation that next week's oil prices will be substantially higher
D) All of the answers are correct.
A) the expectation of an outbreak of war in the world's best oil producing regions
B) the expectation of a reduction in the future supply of oil
C) the expectation that next week's oil prices will be substantially higher
D) All of the answers are correct.
Question
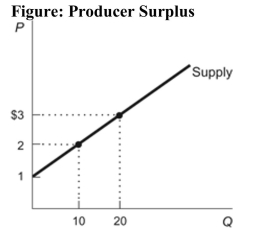 Reference: Ref 3-2 (Figure: Producer Surplus) Refer to the figure. What is the change in producer surplus if the price rises from $2 to $3 per unit?
A) $5
B) $10
C) $15
D) $20
Question
Question
Question
Question
Question
Question
Question
Question
Question
Question
Question
(Figure: Supply Curve) Refer to the figure. A vertical reading of the figure indicates that: 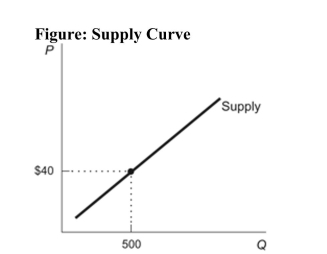
A) at a price higher than $40, the quantity supplied drops to zero.
B) to produce 500 units suppliers must be paid at least $40 per unit.
C) at a price of $40 per unit, suppliers are willing and able to sell
A) at a price higher than $40, the quantity supplied drops to zero.
B) to produce 500 units suppliers must be paid at least $40 per unit.
C) at a price of $40 per unit, suppliers are willing and able to sell
Question
Question
(Figure: Demand Shift) Refer to the figure. Which of the following factors would cause the change in the figure? 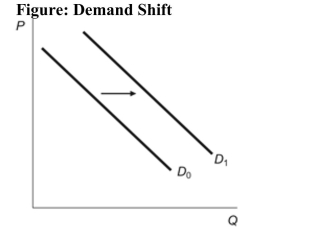 I. a decrease in the price of a complement good II. a decrease in the price of the product III. a decrease in the price of a substitute good IV. an increase in taxes
A) I only
B) II only
C) I, II, and III only
D) I and IV only
I. a decrease in the price of a complement good II. a decrease in the price of the product III. a decrease in the price of a substitute good IV. an increase in taxesA) I only
B) II only
C) I, II, and III only
D) I and IV only
Question
Question
Figure: Producer Surplus 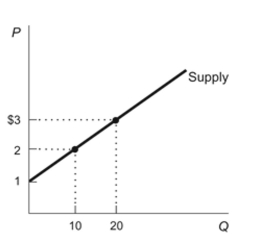 Reference: Ref 3-2 (Figure: Producer Surplus) Refer to the figure. What is the producer surplus at a price of $2 per unit?
A) $5
B) $6
C) $10
D) $20
Reference: Ref 3-2 (Figure: Producer Surplus) Refer to the figure. What is the producer surplus at a price of $2 per unit?A) $5
B) $6
C) $10
D) $20
Question
Question
Question
Question
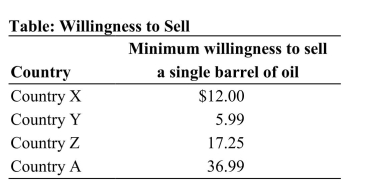 Reference: Ref 3-3 (Table: Willingness to Sell) Refer to the table. Which country is earning the most producer surplus at a market price of $35 per barrel of oil?
A) Country X
B) Country Y
C) Country Z
D) Country A
Question
Question
(Figure: Generic Market Producer Surplus) Refer to the figure. Calculate the total dollar amount of producer surplus earned in this market if the market price is $60. 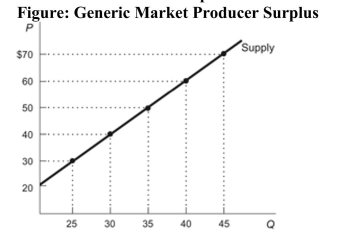
A) $800
B) $1,600
C) $2,400
D) $1,200
A) $800
B) $1,600
C) $2,400
D) $1,200
Question
Question
Question
Question
Question
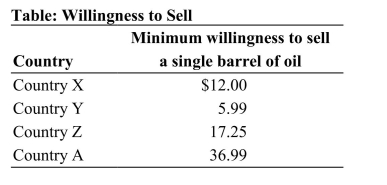 Reference: Ref 3-3 (Table: Willingness to Sell) Refer to the table. Which country is earning the least amount of producer surplus at a market price of $52 per barrel of oil?
A) Country X
B) Country Y
C) Country Z
D) Country A
Question
Question
Question
Question
(Figure: Supply Shift) According to the figure, the: Figure: Supply Shift 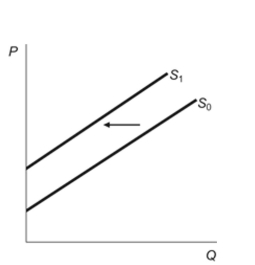
A) costs of producing output have decreased.
B) technology for producing output have improved.
C) costs of producing output have increased.
D) price of the product decreased.
A) costs of producing output have decreased.
B) technology for producing output have improved.
C) costs of producing output have increased.
D) price of the product decreased.
Question
(Figure: Earned Producer Surplus) Refer to the figure. Calculate the total dollar amount of producer surplus earned in this market at a price of $100. 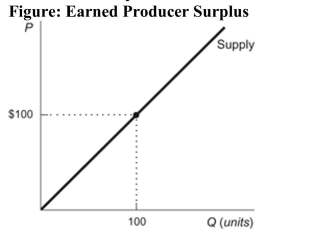
A) $5,000
B) $10,000
C) $100
D) $200
A) $5,000
B) $10,000
C) $100
D) $200
Question
(Figure A: Supply Right Shift) (Figure B: Supply Left Shift) Refer to the two figures. Which of the following statements is TRUE? 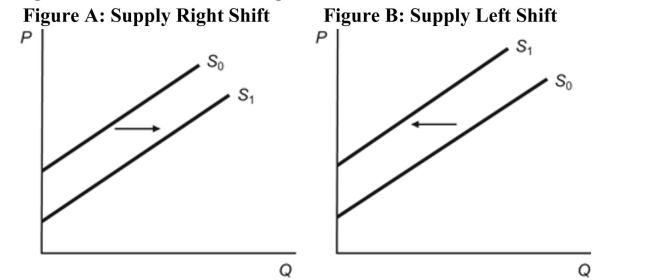 I. Figure A depicts the expectation that the future price will decrease. II. Figure A depicts the entry of foreign producers because of a reduction in trade barriers. III. Figure B depicts falling input prices. IV. Figure B depicts technological innovations. V. Figure B depicts a decrease in taxes.
A) I and II only
B) II and IV only
C) I, III, and V only
D) II, IV, and V only
I. Figure A depicts the expectation that the future price will decrease. II. Figure A depicts the entry of foreign producers because of a reduction in trade barriers. III. Figure B depicts falling input prices. IV. Figure B depicts technological innovations. V. Figure B depicts a decrease in taxes.A) I and II only
B) II and IV only
C) I, III, and V only
D) II, IV, and V only
Question
(Table: Barrels of Oil) Refer to the table. What is the total amount of producer surplus (per barrel of oil) earned by all four producers if the market price per barrel of oil is $51? Table: Barrels of Oil Minimum willingness to sell 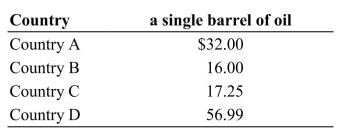
A) $65.25
B) $81.76
C) $87.75
D) $93.74
A) $65.25
B) $81.76
C) $87.75
D) $93.74
Question
Question
Question
Question
Question

Unlock Deck
Sign up to unlock the cards in this deck!
Unlock Deck
Unlock Deck
1/114
Play
Full screen (f)
Deck 3: Business Fluctuations: Aggregate Demand and Supply
1
(Figure: Demand Curve) Which of the following statements is TRUE regarding the figure? I. At a price of $6 per unit, consumers are willing and able to buy 10 units. II. The maximum price demanders are willing to pay for 15 units is $3.75 per unit. III. The higher the price, the greater the quantity demanded. IV. At a price of $3.75 per unit, consumers are indifferent between buying 10 and 15 units.
A) I only
B) I and II only
C) I, II, and III
D) I, II, and IV
I. At a price of $6 per unit, consumers are willing and able to buy 10 units. II. The maximum price demanders are willing to pay for 15 units is $3.75 per unit. III. The higher the price, the greater the quantity demanded. IV. At a price of $3.75 per unit, consumers are indifferent between buying 10 and 15 units.A) I only
B) I and II only
C) I, II, and III
D) I, II, and IV
B
2
Which of the following statements is TRUE?
A) When the price of oil is high, consumers will use oil only for its most valuable uses.
B) When the price of oil is low, consumers will use oil for both valuable and less valuable uses.
C) When the price of oil rises, consumers tend to use oil for uses (for example, transportation) in which there are few substitutes for oil.
D) All of these statements are correct.
D
3
Which of the following statements is TRUE? I. Consumer surplus is the difference between the maximum price a consumer is willing to pay for a good or service and its market price. II. Mr. Bill is willing to pay $10 for two pounds of clay. If the market price per pound of clay is $2.50, his consumer surplus is $7.50. III. Total consumer surplus is represented graphically by the area beneath the demand curve and above the market price.
A) I only
B) II only
C) I and III only
D) I, II, and III
A) I only
B) II only
C) I and III only
D) I, II, and III
C
4
The law of demand states that:
A) the lower the price, the greater the quantity demanded.
B) the higher the price, the higher the quantity demanded.
C) the demand curve is upward sloping.
D) an increase in income increases the quantity demanded.
A) the lower the price, the greater the quantity demanded.
B) the higher the price, the higher the quantity demanded.
C) the demand curve is upward sloping.
D) an increase in income increases the quantity demanded.
Unlock Deck
Unlock for access to all 114 flashcards in this deck.
Unlock Deck
k this deck
5
(Figure: Demand Curve) Refer to the figure. What is the maximum price per book that buyers are willing to pay for 2,500 books? Figure: Demand Curve
A) $60
B) $45
C) $30
D) $15
A) $60
B) $45
C) $30
D) $15
Unlock Deck
Unlock for access to all 114 flashcards in this deck.
Unlock Deck
k this deck
6
Which of the following statements correctly defines a demand curve?
A) A demand curve is a function that shows the relationship between prices and the quantity available for sale.
B) A demand curve is a function that shows the relationship between prices and their associated quantities supplied.
C) A demand curve is a function that shows the relationship between prices and their associated quantities demanded.
D) A demand curve is a function that shows the relationship between quantity demanded and quantity supplied.
Unlock Deck
Unlock for access to all 114 flashcards in this deck.
Unlock Deck
k this deck
7
What does the law of demand state? I. There is a negative relationship between price and quantity demanded. II. There is an inverse relationship between price and quantity that buyers are willing and able to purchase. III. There is an inverse relationship between price and demand.
A) I and II only
B) II and III only
C) I and III only
D) I, II, and III
A) I and II only
B) II and III only
C) I and III only
D) I, II, and III
Unlock Deck
Unlock for access to all 114 flashcards in this deck.
Unlock Deck
k this deck
8
(Figure: Consumer Surplus) Refer to the figure. Calculate the dollar amount of consumer surplus being earned in this market.
A) $4,500
B) $9,000
C) $18,000
D) $450
A) $4,500
B) $9,000
C) $18,000
D) $450
Unlock Deck
Unlock for access to all 114 flashcards in this deck.
Unlock Deck
k this deck
9
(Figure: Willingness to Pay) Refer to the figure. What is the maximum amount that buyers are willing to buy at a price of $45 per book?
A) 300 books
B) 450 books
C) 0 books
D) 100 books
A) 300 books
B) 450 books
C) 0 books
D) 100 books
Unlock Deck
Unlock for access to all 114 flashcards in this deck.
Unlock Deck
k this deck
10
What does the law of demand state?
A) As incomes increase, people consume more of all goods.
B) The demand for a good increases with the number of consumers in the market.
C) As the price of a good declines, consumers purchase more of that good.
D) The supply of a good increases in proportion to the demand for it.
A) As incomes increase, people consume more of all goods.
B) The demand for a good increases with the number of consumers in the market.
C) As the price of a good declines, consumers purchase more of that good.
D) The supply of a good increases in proportion to the demand for it.
Unlock Deck
Unlock for access to all 114 flashcards in this deck.
Unlock Deck
k this deck
11
(Table: Excel Company) The table shows the results of Excel Company's market survey. If the market price of Excel computers is $1,200 each, how much total consumer surplus (in $) are the four consumers earning?
A) $380
B) $415
C) $345
D) $5,145
A) $380
B) $415
C) $345
D) $5,145
Unlock Deck
Unlock for access to all 114 flashcards in this deck.
Unlock Deck
k this deck
12
(Table: Maximum Willingness to Pay) The table shows four individuals' maximum willingness to pay for one pound of bananas. If the market price of bananas is $0.50/lb, what is the total consumer surplus in the market?
A) $4.00
B) $2.50
C) $2.75
D) $4.25
A) $4.00
B) $2.50
C) $2.75
D) $4.25
Unlock Deck
Unlock for access to all 114 flashcards in this deck.
Unlock Deck
k this deck
13
If Maria is willing to pay $50 for a sweatshirt, how much consumer surplus does she earn if the market price for sweatshirts is $27.50 each?
A) $27.50
B) $50.00
C) $77.50
D) $22.50
A) $27.50
B) $50.00
C) $77.50
D) $22.50
Unlock Deck
Unlock for access to all 114 flashcards in this deck.
Unlock Deck
k this deck
14
Recall the discussion about the demand for oil in your textbook. Which of the following correctly explains why the demand curve for oil is negatively sloped? As the price of oil rises:
A) consumers use oil for more and varied purposes.
B) consumers increasingly use oil only for those purposes without good substitutes.
C) consumers have an incentive to use oil more freely.
D) more producers are more willing and able to produce oil.
A) consumers use oil for more and varied purposes.
B) consumers increasingly use oil only for those purposes without good substitutes.
C) consumers have an incentive to use oil more freely.
D) more producers are more willing and able to produce oil.
Unlock Deck
Unlock for access to all 114 flashcards in this deck.
Unlock Deck
k this deck
15
Which of the following is TRUE about demand curves?
A) Demand curves are negatively sloped.
B) Demand curves reflect the law of demand.
C) Demand curves are plots of quantities demanded at various prices.
D) All of the answers are correct.
A) Demand curves are negatively sloped.
B) Demand curves reflect the law of demand.
C) Demand curves are plots of quantities demanded at various prices.
D) All of the answers are correct.
Unlock Deck
Unlock for access to all 114 flashcards in this deck.
Unlock Deck
k this deck
16
Reference: Ref 3-1 (Table: Sweetbrand) The table shows the maximum consumer willingness to pay for "Sweetbrand" cheesecakes. Which of the four consumers receives the smallest consumer surplus, if the market price of the cheesecakes is $12.50 each?A) Frodo
B) Sam
C) Mary
D) Pippin
Unlock Deck
Unlock for access to all 114 flashcards in this deck.
Unlock Deck
k this deck
17
The quantity demanded of a good or service is the amount that:
A) consumers are willing and able to buy at a given price.
B) firms are willing to sell during a given time period at a given price.
C) a consumer would like to buy but might not be able to afford.
D) a consumer needs to consume during a given time period.
A) consumers are willing and able to buy at a given price.
B) firms are willing to sell during a given time period at a given price.
C) a consumer would like to buy but might not be able to afford.
D) a consumer needs to consume during a given time period.
Unlock Deck
Unlock for access to all 114 flashcards in this deck.
Unlock Deck
k this deck
18
Quantity demanded is:
A) the amount of a good or service that a buyer is able and willing to purchase at a given price.
B) the amount of a good or service that a buyer is able and willing to sell at a given price.
C) the amount of a good or service that a seller is able and willing to sell at a given price.
D) the amount of a good or service that a buyer is able and willing to purchase at various given prices.
Unlock Deck
Unlock for access to all 114 flashcards in this deck.
Unlock Deck
k this deck
19
Reference: Ref 3-1 (Table: Sweetbrand) The table shows the maximum consumer willingness to pay for "Sweetbrand" cheesecakes. Which of the four consumers receives the most consumer surplus, if the market price of the cheesecakes is $12.50 each?A) Frodo
B) Sam
C) Mary
D) Pippin
Unlock Deck
Unlock for access to all 114 flashcards in this deck.
Unlock Deck
k this deck
20
Which of the following statements about consumer surplus is incorrect?
A) Consumer surplus is the net benefit to consumers from the exchange that occurs in a market.
B) Consumer surplus is the gains from trade on the part of the consumer that result from a market transaction.
C) Total consumer surplus is the area beneath the demand curve and above the market price.
D) Consumer surplus is the difference between the minimum price the consumer is willing to pay and the market price.
Unlock Deck
Unlock for access to all 114 flashcards in this deck.
Unlock Deck
k this deck
21
Assume that spaghetti is an inferior good for most people. As their incomes increase, all other things held constant, the:
A) demand for spaghetti will decrease shifting the demand curve to the left.
B) demand for spaghetti will decrease shifting the demand curve to the right.
C) demand for spaghetti will increase shifting the demand curve to the left.
D) demand for spaghetti will increase shifting the demand curve to the right.
Unlock Deck
Unlock for access to all 114 flashcards in this deck.
Unlock Deck
k this deck
22
Which of the following are factors that shift the demand curve?
A) costs of production, price of the product, and subsidies
B) income, population, tastes, and input prices
C) expectations, opportunity costs, price of the product
D) price of substitutes, tastes, price of complements
A) costs of production, price of the product, and subsidies
B) income, population, tastes, and input prices
C) expectations, opportunity costs, price of the product
D) price of substitutes, tastes, price of complements
Unlock Deck
Unlock for access to all 114 flashcards in this deck.
Unlock Deck
k this deck
23
Coke and Pepsi are substitute soft drinks. Which of the following would cause the demand curve for Pepsi to shift to the left?
A) A report emerges that shows that drinking Pepsi helps to promote weight loss.
B) The price of Coke decreases.
C) The price of Pepsi rises.
D) The cost of making Pepsi rises.
A) A report emerges that shows that drinking Pepsi helps to promote weight loss.
B) The price of Coke decreases.
C) The price of Pepsi rises.
D) The cost of making Pepsi rises.
Unlock Deck
Unlock for access to all 114 flashcards in this deck.
Unlock Deck
k this deck
24
Which one of the following choices would cause the demand curve for an inferior good to shift to the left?
A) a fall in incomes
B) a fall in the price of the inferior good
C) a rise in incomes
D) a rise in the price of the inferior good
A) a fall in incomes
B) a fall in the price of the inferior good
C) a rise in incomes
D) a rise in the price of the inferior good
Unlock Deck
Unlock for access to all 114 flashcards in this deck.
Unlock Deck
k this deck
25
Which of the following does NOT shift the demand curve?
A) changes in the product's price
B) changes in income
C) changes in population
D) changes in tastes and preferences
A) changes in the product's price
B) changes in income
C) changes in population
D) changes in tastes and preferences
Unlock Deck
Unlock for access to all 114 flashcards in this deck.
Unlock Deck
k this deck
26
(Figure: Demand Shift) Which of the following factors would cause the change in the figure? Figure: Demand Shift I. an increase in the price of a complement good II. an increase in production costs III. an increase in the price of a substitute good IV. an increase in income for an inferior good
A) I and III only
B) II and IV only
C) III only
D) I, II, and III
I. an increase in the price of a complement good II. an increase in production costs III. an increase in the price of a substitute good IV. an increase in income for an inferior goodA) I and III only
B) II and IV only
C) III only
D) I, II, and III
Unlock Deck
Unlock for access to all 114 flashcards in this deck.
Unlock Deck
k this deck
27
A local university decides to double its enrollment over the next five years in order to increase tuition revenue. Which of the following would most likely occur in the market for rental housing in the surrounding community?
A) a decrease in the price of rental housing
B) an increase in the demand for rental housing
C) a decrease in the supply of rental housing
D) a population change leads to a change in quantity demanded, not demand
A) a decrease in the price of rental housing
B) an increase in the demand for rental housing
C) a decrease in the supply of rental housing
D) a population change leads to a change in quantity demanded, not demand
Unlock Deck
Unlock for access to all 114 flashcards in this deck.
Unlock Deck
k this deck
28
(Figure: Demand Shift) Which of the following could explain the figure?
A) Consumer income increases in the market for a normal good.
B) Consumer income falls in the market for a normal good.
C) Consumer income rises in the market for an inferior good.
D) Consumer income falls in the market for a luxury good.
A) Consumer income increases in the market for a normal good.
B) Consumer income falls in the market for a normal good.
C) Consumer income rises in the market for an inferior good.
D) Consumer income falls in the market for a luxury good.
Unlock Deck
Unlock for access to all 114 flashcards in this deck.
Unlock Deck
k this deck
29
A decrease in income causes demand for a normal good to ________, and an increase in income causes demand for an inferior good to ________.
A) decrease; decrease
B) increase; increase
C) decrease; increase
D) increase; decrease
A) decrease; decrease
B) increase; increase
C) decrease; increase
D) increase; decrease
Unlock Deck
Unlock for access to all 114 flashcards in this deck.
Unlock Deck
k this deck
30
Mario buys eight units of good X when his income is $2,000 a month. When his income increases to $2,700 per month, he buys only six units of good X. For Mario, good X is:
A) a normal good.
B) an expensive good.
C) an inferior good.
D) a useless good.
A) a normal good.
B) an expensive good.
C) an inferior good.
D) a useless good.
Unlock Deck
Unlock for access to all 114 flashcards in this deck.
Unlock Deck
k this deck
31
(Figure: Earned Consumer Surplus) Refer to the figure. The market price of the product is $20 per unit. Calculate the dollar amount of consumer surplus being earned in this market. Figure: Earned Consumer Surplus
A) $120,000
B) $60,000
C) $100,000
D) $80,000
A) $120,000
B) $60,000
C) $100,000
D) $80,000
Unlock Deck
Unlock for access to all 114 flashcards in this deck.
Unlock Deck
k this deck
32
Which of the following might happen as a result of an aging population?
A) An increase in the demand for healthcare.
B) Advertisers target young people in order to offset the demands of the growing elderly.
C) Prescription drug demand will become more horizontal.
D) An aging population will move us along age sensitive demand curves.
A) An increase in the demand for healthcare.
B) Advertisers target young people in order to offset the demands of the growing elderly.
C) Prescription drug demand will become more horizontal.
D) An aging population will move us along age sensitive demand curves.
Unlock Deck
Unlock for access to all 114 flashcards in this deck.
Unlock Deck
k this deck
33
As the population of elderly in the United States increases:
A) the supply and demand curves will both shift rightward.
B) the demand curve for certain products shifts rightward.
C) the supply curve will become vertical.
D) None of the answers is correct.
A) the supply and demand curves will both shift rightward.
B) the demand curve for certain products shifts rightward.
C) the supply curve will become vertical.
D) None of the answers is correct.
Unlock Deck
Unlock for access to all 114 flashcards in this deck.
Unlock Deck
k this deck
34
Michael graduates from college and his income increases by $40,000 a year. Other things held constant, he decreases the quantity of pizza he buys. For Michael, pizza is:
A) an inferior good.
B) a complement.
C) a substitute.
D) a normal good.
A) an inferior good.
B) a complement.
C) a substitute.
D) a normal good.
Unlock Deck
Unlock for access to all 114 flashcards in this deck.
Unlock Deck
k this deck
35
If Romaine lettuce and Iceberg lettuce are substitutes, an increase in the price of Romaine lettuce will ______ the demand for Iceberg lettuce.
A) reduce
B) increase
C) not shift
D) decrease
A) reduce
B) increase
C) not shift
D) decrease
Unlock Deck
Unlock for access to all 114 flashcards in this deck.
Unlock Deck
k this deck
36
The quantity of DVDs that people plan to buy this month depends on all of the following EXCEPT the:
A) price of DVDs.
B) price of movies for download.
C) population.
D) quantity of DVDs the sellers have stocked.
A) price of DVDs.
B) price of movies for download.
C) population.
D) quantity of DVDs the sellers have stocked.
Unlock Deck
Unlock for access to all 114 flashcards in this deck.
Unlock Deck
k this deck
37
Which of the following choices contains only factors that would cause a demand curve for a normal good to shift to the right?
A) a rise in population, economic growth, a fall in the price of a substitute good
B) a rise in preferences for the good, economic growth, and a rise in the price of a complementary good
C) positive expectations for the economy, economic growth, a fall in the price of a complementary good
D) a fall in population, economic growth, a rise in tastes and preferences for the product
Unlock Deck
Unlock for access to all 114 flashcards in this deck.
Unlock Deck
k this deck
38
Which of the following are likely to be complements?
A) hotdogs and hamburgers
B) books and book-lights
C) coffee and tea
D) cars and vans
A) hotdogs and hamburgers
B) books and book-lights
C) coffee and tea
D) cars and vans
Unlock Deck
Unlock for access to all 114 flashcards in this deck.
Unlock Deck
k this deck
39
If the price of computers ______, the demand for printers will ______.
A) increases; increase
B) decreases; decrease
C) decreases; not change
D) increases; decrease
A) increases; increase
B) decreases; decrease
C) decreases; not change
D) increases; decrease
Unlock Deck
Unlock for access to all 114 flashcards in this deck.
Unlock Deck
k this deck
40
If the university president valued a parking space close to the administration building at $500 and paid $30 for a parking permit, he would receive consumer surplus equal to:
A) $30.
B) $470.
C) $500.
D) $530.
A) $30.
B) $470.
C) $500.
D) $530.
Unlock Deck
Unlock for access to all 114 flashcards in this deck.
Unlock Deck
k this deck
41
(Figure: Oil Market) Refer to the figure. Which of the following events could cause the change in the figure?
A) the expectation of an outbreak of war in the world's best oil producing regions
B) the expectation of a reduction in the future supply of oil
C) the expectation that next week's oil prices will be substantially higher
D) All of the answers are correct.
A) the expectation of an outbreak of war in the world's best oil producing regions
B) the expectation of a reduction in the future supply of oil
C) the expectation that next week's oil prices will be substantially higher
D) All of the answers are correct.
Unlock Deck
Unlock for access to all 114 flashcards in this deck.
Unlock Deck
k this deck
42
Reference: Ref 3-2 (Figure: Producer Surplus) Refer to the figure. What is the change in producer surplus if the price rises from $2 to $3 per unit?A) $5
B) $10
C) $15
D) $20
Unlock Deck
Unlock for access to all 114 flashcards in this deck.
Unlock Deck
k this deck
43
Which of the following would cause the demand for hot dog buns to increase?
A) a fall in the price of hot dog buns
B) a fall in the price of hot dogs
C) a rise in the price of hot dogs
D) a rise in the price of hot dog buns
A) a fall in the price of hot dog buns
B) a fall in the price of hot dogs
C) a rise in the price of hot dogs
D) a rise in the price of hot dog buns
Unlock Deck
Unlock for access to all 114 flashcards in this deck.
Unlock Deck
k this deck
44
Recall the discussion in your textbook about the supply curve for oil. What explains why the supply curve for oil is positively sloped?
A) As the price of oil rises, producers' costs of drilling oil also rise.
B) As more and more producers enter the market, the price of oil rises.
C) As the price of oil rises, consumers buy less and less oil.
D) As the price of oil rises, more producers enter the market.
A) As the price of oil rises, producers' costs of drilling oil also rise.
B) As more and more producers enter the market, the price of oil rises.
C) As the price of oil rises, consumers buy less and less oil.
D) As the price of oil rises, more producers enter the market.
Unlock Deck
Unlock for access to all 114 flashcards in this deck.
Unlock Deck
k this deck
45
Suppose that consumers begin to believe that the price of housing will be lower next period. What will happen in the market for housing as a result of these expectations?
A) Nothing will happen yet. Consumers will wait for the price to actually decrease before changing their behavior.
B) Demand for housing will increase, causing the price of housing to increase rather than fall.
C) Demand for housing will begin to fall, and the price of housing will decrease.
D) Demand for housing will begin to rise as investors believe they are getting a "deal."
Unlock Deck
Unlock for access to all 114 flashcards in this deck.
Unlock Deck
k this deck
46
The quantity supplied of oil is the amount that:
A) producers plan to sell during a given time period at a given price.
B) is actually bought during a given time period at a given price.
C) producers wish they could sell at a higher price.
D) people are willing to buy during a given time period at a given price.
A) producers plan to sell during a given time period at a given price.
B) is actually bought during a given time period at a given price.
C) producers wish they could sell at a higher price.
D) people are willing to buy during a given time period at a given price.
Unlock Deck
Unlock for access to all 114 flashcards in this deck.
Unlock Deck
k this deck
47
The quantity supplied is the:
A) amount of inputs that a firm earns profit on.
B) change in the sellers' output multiplied by the change in price.
C) incremental cost of producing one more unit of output, holding all other things constant.
D) amount of a good that firms are willing and able to sell at a particular price during a given period of time.
Unlock Deck
Unlock for access to all 114 flashcards in this deck.
Unlock Deck
k this deck
48
Which of the following could cause an increase in the demand for gasoline?
A) the resolution of a civil war in one of the world's biggest oil producing nations
B) the expectation that the price of gasoline will decrease in the future
C) a new technology that makes the production of gasoline significantly less expensive
D) an approaching hurricane that threatens a major oil refinery in Texas
Unlock Deck
Unlock for access to all 114 flashcards in this deck.
Unlock Deck
k this deck
49
The quantity of cell phones that firms plan to sell this month depends on all of the following EXCEPT the:
A) number of producers of cell phones.
B) price of a cell phone.
C) wages of workers in electronics factories.
D) All of these choices affect market conditions.
A) number of producers of cell phones.
B) price of a cell phone.
C) wages of workers in electronics factories.
D) All of these choices affect market conditions.
Unlock Deck
Unlock for access to all 114 flashcards in this deck.
Unlock Deck
k this deck
50
What does the law of supply state?
A) There is a positive relationship between price and quantity supplied.
B) There is a negative relationship between price and quantity supplied.
C) When prices rise, suppliers sell more.
D) When prices rise, buyers buy less of the product.
A) There is a positive relationship between price and quantity supplied.
B) There is a negative relationship between price and quantity supplied.
C) When prices rise, suppliers sell more.
D) When prices rise, buyers buy less of the product.
Unlock Deck
Unlock for access to all 114 flashcards in this deck.
Unlock Deck
k this deck
51
New research indicates that running marathons is actually bad for the heart (it increases inflammatory markers associated with heart attacks). This news will:
A) lead to a decrease in the demand for running shoes.
B) have no effect on the demand or supply of running shoes.
C) increase the supply of running shoes.
D) lead to an increase in the demand for running shoes.
A) lead to a decrease in the demand for running shoes.
B) have no effect on the demand or supply of running shoes.
C) increase the supply of running shoes.
D) lead to an increase in the demand for running shoes.
Unlock Deck
Unlock for access to all 114 flashcards in this deck.
Unlock Deck
k this deck
52
Suppose that Country X is a high-cost producer of oil and Country Y is a low-cost producer of oil. The citizens of Country X use both oil produced in their own country as well as oil produced in Country Y. If the market price of oil decreases, oil production in Country X will _______, and the citizens of Country X will _________________.
A) decrease; purchase a larger fraction of their oil from Country Y
B) increase; purchase a larger fraction of their oil from Country X
C) decrease; not change their consumption mix between imported and domestic oil
D) increase; purchase a smaller fraction of their oil from Country Y
A) decrease; purchase a larger fraction of their oil from Country Y
B) increase; purchase a larger fraction of their oil from Country X
C) decrease; not change their consumption mix between imported and domestic oil
D) increase; purchase a smaller fraction of their oil from Country Y
Unlock Deck
Unlock for access to all 114 flashcards in this deck.
Unlock Deck
k this deck
53
(Figure: Supply Curve) Refer to the figure. A vertical reading of the figure indicates that:
A) at a price higher than $40, the quantity supplied drops to zero.
B) to produce 500 units suppliers must be paid at least $40 per unit.
C) at a price of $40 per unit, suppliers are willing and able to sell
A) at a price higher than $40, the quantity supplied drops to zero.
B) to produce 500 units suppliers must be paid at least $40 per unit.
C) at a price of $40 per unit, suppliers are willing and able to sell
Unlock Deck
Unlock for access to all 114 flashcards in this deck.
Unlock Deck
k this deck
54
The movie trilogy The Lord of the Rings was hugely successful, and, as a result, the demand for fantasy novels, action figures, and online role-playing games surged. The increase in demand can be explained by a(n):
A) increase in population.
B) change in expectations.
C) change in tastes.
D) change in the price of substitutes.
A) increase in population.
B) change in expectations.
C) change in tastes.
D) change in the price of substitutes.
Unlock Deck
Unlock for access to all 114 flashcards in this deck.
Unlock Deck
k this deck
55
(Figure: Demand Shift) Refer to the figure. Which of the following factors would cause the change in the figure? I. a decrease in the price of a complement good II. a decrease in the price of the product III. a decrease in the price of a substitute good IV. an increase in taxes
A) I only
B) II only
C) I, II, and III only
D) I and IV only
I. a decrease in the price of a complement good II. a decrease in the price of the product III. a decrease in the price of a substitute good IV. an increase in taxesA) I only
B) II only
C) I, II, and III only
D) I and IV only
Unlock Deck
Unlock for access to all 114 flashcards in this deck.
Unlock Deck
k this deck
56
Suppose it is widely believed that the price of flat-screen, high- definition televisions will be lower next year. What will happen as a result of such beliefs?
A) The demand for flat-screen TVs will increase now.
B) The demand for flat-screen TVs will increase next year when the prices fall.
C) The demand for flat-screen TVs will decrease now.
D) The demand for flat-screen TVs will not change.
A) The demand for flat-screen TVs will increase now.
B) The demand for flat-screen TVs will increase next year when the prices fall.
C) The demand for flat-screen TVs will decrease now.
D) The demand for flat-screen TVs will not change.
Unlock Deck
Unlock for access to all 114 flashcards in this deck.
Unlock Deck
k this deck
57
Figure: Producer Surplus Reference: Ref 3-2 (Figure: Producer Surplus) Refer to the figure. What is the producer surplus at a price of $2 per unit?
A) $5
B) $6
C) $10
D) $20
Reference: Ref 3-2 (Figure: Producer Surplus) Refer to the figure. What is the producer surplus at a price of $2 per unit?A) $5
B) $6
C) $10
D) $20
Unlock Deck
Unlock for access to all 114 flashcards in this deck.
Unlock Deck
k this deck
58
Weather forecasters predict that a major winter storm will strike your town within the next few days. Which of the following would NOT occur based upon the expected storm?
A) an increase in the demand for groceries
B) a decrease in the supply of winter clothing
C) an increase in the demand for gasoline and tire chains
D) an increase in the supply of electric generators to the area
A) an increase in the demand for groceries
B) a decrease in the supply of winter clothing
C) an increase in the demand for gasoline and tire chains
D) an increase in the supply of electric generators to the area
Unlock Deck
Unlock for access to all 114 flashcards in this deck.
Unlock Deck
k this deck
59
The supply curve illustrates:
A) that limited resources are available for society to use.
B) the relationship between the quantity supplied and the price of a good.
C) the total cost of producing a good.
D) the willingness to produce a good if the technology to produce it becomes available.
A) that limited resources are available for society to use.
B) the relationship between the quantity supplied and the price of a good.
C) the total cost of producing a good.
D) the willingness to produce a good if the technology to produce it becomes available.
Unlock Deck
Unlock for access to all 114 flashcards in this deck.
Unlock Deck
k this deck
60
If the price of shotguns ______, the demand for shotgun shells will _______.
A) increases; decrease
B) increases; increase
C) decreases; decrease
D) double; double
A) increases; decrease
B) increases; increase
C) decreases; decrease
D) double; double
Unlock Deck
Unlock for access to all 114 flashcards in this deck.
Unlock Deck
k this deck
61
Reference: Ref 3-3 (Table: Willingness to Sell) Refer to the table. Which country is earning the most producer surplus at a market price of $35 per barrel of oil?A) Country X
B) Country Y
C) Country Z
D) Country A
Unlock Deck
Unlock for access to all 114 flashcards in this deck.
Unlock Deck
k this deck
62
Which of the following factors causes a decrease in supply?
A) a decrease in demand
B) a decrease in the price of the product
C) an increase in the price of the product
D) new taxes on output
A) a decrease in demand
B) a decrease in the price of the product
C) an increase in the price of the product
D) new taxes on output
Unlock Deck
Unlock for access to all 114 flashcards in this deck.
Unlock Deck
k this deck
63
(Figure: Generic Market Producer Surplus) Refer to the figure. Calculate the total dollar amount of producer surplus earned in this market if the market price is $60.
A) $800
B) $1,600
C) $2,400
D) $1,200
A) $800
B) $1,600
C) $2,400
D) $1,200
Unlock Deck
Unlock for access to all 114 flashcards in this deck.
Unlock Deck
k this deck
64
Nigeria receives $53 of producer surplus from each barrel of oil sold at $60. At that level of production, Nigeria's cost to produce a barrel of oil is:
A) $1.13.
B) $7.
C) $53.
D) $113.
A) $1.13.
B) $7.
C) $53.
D) $113.
Unlock Deck
Unlock for access to all 114 flashcards in this deck.
Unlock Deck
k this deck
65
The price of coffee has increased, yet evidence suggests the demand for coffee has been stable. A possible explanation is that:
A) there has been no change in the supply of coffee.
B) there has been increased use of subsidies in coffee production.
C) wages of workers in coffee production might have decreased.
D) wages of workers in coffee production might have increased.
A) there has been no change in the supply of coffee.
B) there has been increased use of subsidies in coffee production.
C) wages of workers in coffee production might have decreased.
D) wages of workers in coffee production might have increased.
Unlock Deck
Unlock for access to all 114 flashcards in this deck.
Unlock Deck
k this deck
66
Which of the following choices contains only factors that cause the supply curve to shift to the right?
A) a fall in production costs, a rise in technology, an increase in taxes on output
B) a fall in tastes and preferences for the product, economic growth, and a rise in technology
C) a decrease in taxes on production, a fall in subsidies on production, a rise in costs of production
D) a rise in technology, a fall in the costs of production, a fall in taxes on output
Unlock Deck
Unlock for access to all 114 flashcards in this deck.
Unlock Deck
k this deck
67
In the oil market, an increase in the wage of oil workers will:
A) shift the supply curve of oil to the right.
B) shift the supply curve of oil to the left.
C) shift the demand curve for oil to the left.
D) shift the demand curve for oil to the right.
A) shift the supply curve of oil to the right.
B) shift the supply curve of oil to the left.
C) shift the demand curve for oil to the left.
D) shift the demand curve for oil to the right.
Unlock Deck
Unlock for access to all 114 flashcards in this deck.
Unlock Deck
k this deck
68
Reference: Ref 3-3 (Table: Willingness to Sell) Refer to the table. Which country is earning the least amount of producer surplus at a market price of $52 per barrel of oil?A) Country X
B) Country Y
C) Country Z
D) Country A
Unlock Deck
Unlock for access to all 114 flashcards in this deck.
Unlock Deck
k this deck
69
A government subsidy causes the:
A) supply of the product to increase.
B) supply of the product to decrease.
C) supply curve to change slope.
D) supply curve to shift up and to the left.
A) supply of the product to increase.
B) supply of the product to decrease.
C) supply curve to change slope.
D) supply curve to shift up and to the left.
Unlock Deck
Unlock for access to all 114 flashcards in this deck.
Unlock Deck
k this deck
70
A subsidy is a:
A) reverse tax.
B) means of shifting the supply curve left.
C) form of tax benefit.
D) movement along the supply curve.
A) reverse tax.
B) means of shifting the supply curve left.
C) form of tax benefit.
D) movement along the supply curve.
Unlock Deck
Unlock for access to all 114 flashcards in this deck.
Unlock Deck
k this deck
71
Firms are willing and able to sell 100 guitars per day at a price of $250 per guitar. What price will firms require to sell 100 guitars per day if there is a tax of $15 per guitar?
A) $235
B) $250
C) between $235 and $250
D) $265
A) $235
B) $250
C) between $235 and $250
D) $265
Unlock Deck
Unlock for access to all 114 flashcards in this deck.
Unlock Deck
k this deck
72
(Figure: Supply Shift) According to the figure, the: Figure: Supply Shift
A) costs of producing output have decreased.
B) technology for producing output have improved.
C) costs of producing output have increased.
D) price of the product decreased.
A) costs of producing output have decreased.
B) technology for producing output have improved.
C) costs of producing output have increased.
D) price of the product decreased.
Unlock Deck
Unlock for access to all 114 flashcards in this deck.
Unlock Deck
k this deck
73
(Figure: Earned Producer Surplus) Refer to the figure. Calculate the total dollar amount of producer surplus earned in this market at a price of $100.
A) $5,000
B) $10,000
C) $100
D) $200
A) $5,000
B) $10,000
C) $100
D) $200
Unlock Deck
Unlock for access to all 114 flashcards in this deck.
Unlock Deck
k this deck
74
(Figure A: Supply Right Shift) (Figure B: Supply Left Shift) Refer to the two figures. Which of the following statements is TRUE? I. Figure A depicts the expectation that the future price will decrease. II. Figure A depicts the entry of foreign producers because of a reduction in trade barriers. III. Figure B depicts falling input prices. IV. Figure B depicts technological innovations. V. Figure B depicts a decrease in taxes.
A) I and II only
B) II and IV only
C) I, III, and V only
D) II, IV, and V only
I. Figure A depicts the expectation that the future price will decrease. II. Figure A depicts the entry of foreign producers because of a reduction in trade barriers. III. Figure B depicts falling input prices. IV. Figure B depicts technological innovations. V. Figure B depicts a decrease in taxes.A) I and II only
B) II and IV only
C) I, III, and V only
D) II, IV, and V only
Unlock Deck
Unlock for access to all 114 flashcards in this deck.
Unlock Deck
k this deck
75
(Table: Barrels of Oil) Refer to the table. What is the total amount of producer surplus (per barrel of oil) earned by all four producers if the market price per barrel of oil is $51? Table: Barrels of Oil Minimum willingness to sell
A) $65.25
B) $81.76
C) $87.75
D) $93.74
A) $65.25
B) $81.76
C) $87.75
D) $93.74
Unlock Deck
Unlock for access to all 114 flashcards in this deck.
Unlock Deck
k this deck
76
New production technology in the manufacture of plasma television screens has reduced the number of defective screens. What effect will this have in the market for plasma televisions?
A) The demand curve will increase.
B) The supply curve will increase.
C) The demand and supply curve both increase.
D) The demand curve will decrease.
A) The demand curve will increase.
B) The supply curve will increase.
C) The demand and supply curve both increase.
D) The demand curve will decrease.
Unlock Deck
Unlock for access to all 114 flashcards in this deck.
Unlock Deck
k this deck
77
If producers form expectations that copper prices will be higher in the future, then this will shift the:
A) demand curve for copper to the left.
B) supply curve of copper to the right.
C) demand curve for copper to the right.
D) supply curve of copper to the left.
A) demand curve for copper to the left.
B) supply curve of copper to the right.
C) demand curve for copper to the right.
D) supply curve of copper to the left.
Unlock Deck
Unlock for access to all 114 flashcards in this deck.
Unlock Deck
k this deck
78
Which of the following factors does NOT result in a shift of the supply curve?
A) a change in the number of sellers in the market
B) a change in the demand for the product
C) a change in production technology
D) a change in the costs of production
A) a change in the number of sellers in the market
B) a change in the demand for the product
C) a change in production technology
D) a change in the costs of production
Unlock Deck
Unlock for access to all 114 flashcards in this deck.
Unlock Deck
k this deck
79
In the market for fertilizer, an:
A) increase in the wage rate will increase the demand for fertilizer.
B) advance in technology will increase the supply of fertilizer.
C) increase in the wage rate will increase the supply of fertilizer.
D) increase in the cost of equipment will increase the supply of fertilizer.
A) increase in the wage rate will increase the demand for fertilizer.
B) advance in technology will increase the supply of fertilizer.
C) increase in the wage rate will increase the supply of fertilizer.
D) increase in the cost of equipment will increase the supply of fertilizer.
Unlock Deck
Unlock for access to all 114 flashcards in this deck.
Unlock Deck
k this deck
80
Potato chips and popcorn are substitutes. A subsidy for potato chips will ______the demand for popcorn and the quantity of popcorn sold will ______.
A) increase; increase
B) increase; decrease
C) decrease; decrease
D) decrease; increase
A) increase; increase
B) increase; decrease
C) decrease; decrease
D) decrease; increase
Unlock Deck
Unlock for access to all 114 flashcards in this deck.
Unlock Deck
k this deck
Unlock Deck
Unlock for access to all 114 flashcards in this deck.


