Exam 3: Business Fluctuations: Aggregate Demand and Supply
Exam 1: The Big Ideas in Economics103 Questions
Exam 2: The Power of Trade and Comparative Advantage169 Questions
Exam 3: Business Fluctuations: Aggregate Demand and Supply114 Questions
Exam 4: Equilibrium: How Supply and Demand Determine Prices105 Questions
Exam 5: Elasticity and Its Applications153 Questions
Exam 6: Taxes and Subsidies100 Questions
Exam 7: The Price System: Signals, Speculation, and Prediction149 Questions
Exam 8: Price Ceilings and Floors199 Questions
Exam 9: International Trade78 Questions
Exam 10: Externalities: When the Price Is Not Right146 Questions
Exam 11: Costs and Profit Maximization Under Competition126 Questions
Exam 12: Competition and the Invisible Hand29 Questions
Exam 13: Monopoly144 Questions
Exam 14: Price Discrimination and Pricing Strategy152 Questions
Exam 15: Oligopoly and Game Theory127 Questions
Exam 16: Competing for Monopoly: the Economics of Network Goods51 Questions
Exam 17: Monopolistic Competition and Advertising143 Questions
Exam 18: Labor Markets148 Questions
Exam 19: Public Goods and the Tragedy of the Commons153 Questions
Exam 20: Political Economy and Public Choice151 Questions
Exam 21: Economics, Ethics, and Public Policy143 Questions
Exam 22: Managing Incentives140 Questions
Exam 23: Stock Markets and Personal Finance53 Questions
Exam 24: Asymmetric Information: Moral Hazard and Adverse Selection133 Questions
Exam 25: Consumer Choice141 Questions
Exam 26: Gdp and the Measurement of Progress135 Questions
Exam 27: The Wealth of Nations and Economic Growth155 Questions
Exam 28: Growth, Capital Accumulation, and the Economics of Ideas: Catching up Vs the Cutting Edge145 Questions
Exam 29: Saving, Investment, and the Financial System146 Questions
Exam 30: Supply and Demand183 Questions
Exam 31: Unemployment and Labor Force Participation96 Questions
Exam 32: Inflation and the Quantity Theory of Money165 Questions
Exam 33: Transmission and Amplification Mechanisms133 Questions
Exam 34: The Federal Reserve System and Open Market Operations144 Questions
Exam 35: Monetary Policy139 Questions
Exam 36: The Federal Budget: Taxes and Spending158 Questions
Select questions type
Which of the following would cause the demand for hot dog buns to increase?
Free
(Multiple Choice)
4.8/5  (37)
(37)
Correct Answer: Verified
B
What does the law of demand state?
Free
(Multiple Choice)
4.8/5 (35)
Correct Answer:Verified
C
Figure: Supply Shifts 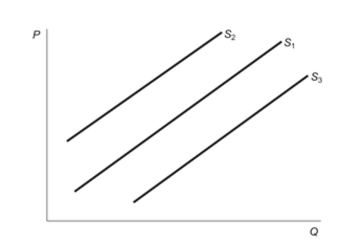 Reference: Ref 3-4 (Figure: Supply Shifts) In the figure, the initial supply curve is S1. Producers engage in market speculation with the belief that the price of the good will increase in the near future. This would be represented in the figure by shifting the:
Free
(Multiple Choice)
4.8/5 (38)
Correct Answer:Verified
A
In the oil market, an increase in the wage of oil workers will:
(Multiple Choice)
4.9/5 (36)
The quantity demanded of a good or service is the amount that:
(Multiple Choice)
4.7/5 (41)
Which one of the following choices would cause the demand curve for an inferior good to shift to the left?
(Multiple Choice)
4.8/5 (46)
Figure: Producer Surplus 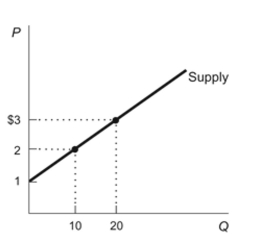 Reference: Ref 3-2 (Figure: Producer Surplus) Refer to the figure. What is the producer surplus at a price of $2 per unit?
(Multiple Choice)
4.9/5 (36)
A change in price is reflected by a movement along the same demand curve while a change in demand refers to a shift of the entire demand curve.
(True/False)
4.8/5 (35)
The price of coffee has increased, yet evidence suggests the demand for coffee has been stable. A possible explanation is that:
(Multiple Choice)
4.9/5 (36)
(Figure A: Supply Right Shift) (Figure B: Supply Left Shift) Refer to the two figures. Which of the following statements is TRUE? 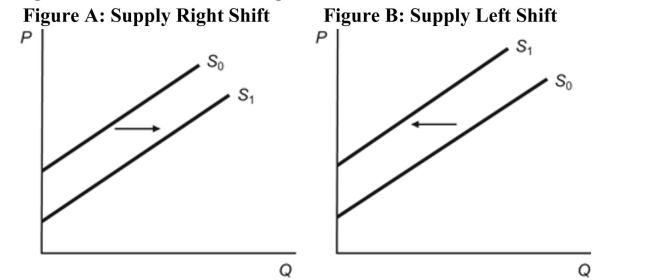 I. Figure A depicts the expectation that the future price will decrease. II. Figure A depicts the entry of foreign producers because of a reduction in trade barriers. III. Figure B depicts falling input prices. IV. Figure B depicts technological innovations. V. Figure B depicts a decrease in taxes.
(Multiple Choice)
4.8/5 (41)
A tax of $4 shifts the supply curve down and to the right by $4.
(True/False)
4.8/5 (42)
Advertising, fads, and fashion are examples of influences on demand that are generally referred to as altering expectations about products.
(True/False)
4.7/5 (38)
Which of the following might happen as a result of an aging population?
(Multiple Choice)
4.9/5 (35)
If Romaine lettuce and Iceberg lettuce are substitutes, an increase in the price of Romaine lettuce will ______ the demand for Iceberg lettuce.
(Multiple Choice)
4.7/5 (39)
A change in quantity supplied is reflected by a movement along the same supply curve while a change in supply refers to a shift in the entire supply curve.
(True/False)
4.8/5 (40)
Which of the following factors does NOT result in a shift of the supply curve?
(Multiple Choice)
5.0/5 (39)
A market has a supply equation as follows: Qs = P. The market price for the product is $50. Calculate the dollar amount of producer surplus in this market and illustrate your answer graphically.
(Essay)
4.7/5 (38)
What is the difference between a change in quantity demanded (Qd) and a change in demand? Explain what causes a change in Qd and what causes a change in demand, and illustrate using graphs.
(Essay)
4.7/5 (44)
If producers form expectations that copper prices will be higher in the future, then this will shift the:
(Multiple Choice)
4.9/5 (47)
(Figure: Earned Consumer Surplus) Refer to the figure. The market price of the product is $20 per unit. Calculate the dollar amount of consumer surplus being earned in this market. Figure: Earned Consumer Surplus 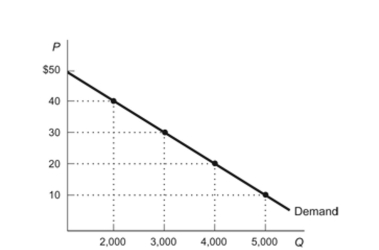
(Multiple Choice)
4.7/5 (46)
Filters
- Essay(0)
- Multiple Choice(0)
- Short Answer(0)
- True False(0)
- Matching(0)