Deck 5: Accumulated Change: the Definite Integral
Full screen (f)
Question
The following figure shows the rate of change of enrollment for a community college. Estimate the total change in enrollment over the first 6 years. 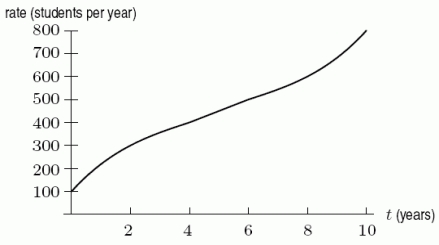
A)1900 students
B)2300 students
C)2700 students
D)2900 students
A)1900 students
B)2300 students
C)2700 students
D)2900 students
Question
Consider a sports car which accelerates from 0 ft/sec to 85 ft/sec in 5 seconds (85 ft/sec = 58 mph). The car's velocity is given in the following table. What is the lower bound for the number of feet the car travels in 5 seconds? 
Question
Find  for
for 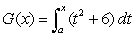 .
.
A)
B)
C)
D)
for .A)
B)
C)
D)
Question
The flow rate of water in a mountain stream due to spring runoff is given in the following table. Give your best estimate (average of upper and lower limit) of how many cubic meters of water flowed through from 6:00 pm to midnight. 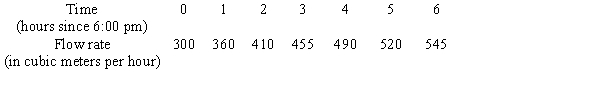
Question
The rate of pollution pouring into a lake is measured every 10 days, with results in the following table. About how many tons of pollution have entered the lake during the first 40 days? 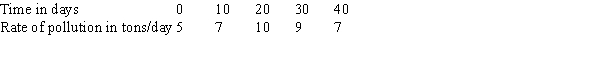
Question
Consider a sports car which accelerates from 0 ft/sec to 85 ft/sec in 5 seconds (85 ft/sec = 58 mph). The car's velocity is given in the following table. Over which time interval in the average acceleration the smallest? 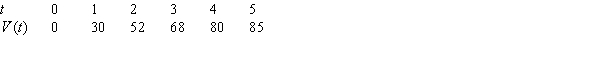
A)The last
B)The fourth
C)The third
D)The second
E)The first
A)The last
B)The fourth
C)The third
D)The second
E)The first
Question
Use a calculator to evaluate  . Round your answer to 2 decimal places.
. Round your answer to 2 decimal places. Question
Use a calculator to evaluate  . Round your answer to 2 decimal places.
. Round your answer to 2 decimal places. Question
The following figure shows the graph of the velocity, v, of an object (in meters/sec). If the graph were shifted up 4 units, how would the distance traveled between t = 0 and t = 6 change? 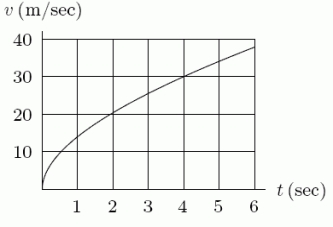
A)It would increase by 4 meters.
B)It would decrease by 4 meters.
C)It would increase by 24 meters.
D)It would decrease by 24 meters.
E)It would remain the same.
A)It would increase by 4 meters.
B)It would decrease by 4 meters.
C)It would increase by 24 meters.
D)It would decrease by 24 meters.
E)It would remain the same.
Question
At time t, in seconds, the velocity v, in miles per hour, of a car is given by  for
for  . Use
. Use  to estimate how many miles were traveled during this time (average left- and right-hand sums).
for . Use to estimate how many miles were traveled during this time (average left- and right-hand sums). Question
Two cars start at the same time and travel in the same direction along a straight road. The following figure gives the velocity, v, of each car as a function of time, t. Which car reached the larger maximum velocity? 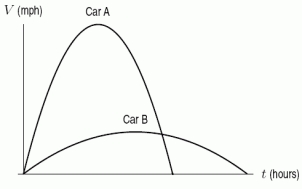
A)Car B
B)Car A
A)Car B
B)Car A
Question
Your velocity, in meters per second, is given by  , where t is time in seconds. Estimate your distance traveled over the first 6 seconds.
A)97 meters
B)103 meters
C)109 meters
D)115 meters
, where t is time in seconds. Estimate your distance traveled over the first 6 seconds.A)97 meters
B)103 meters
C)109 meters
D)115 meters
Question
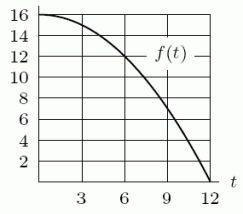
The graph below shows the velocity of an object (in meters/second). Find an upper bound for the number of meters traveled from t = 1 to t = 5 seconds. 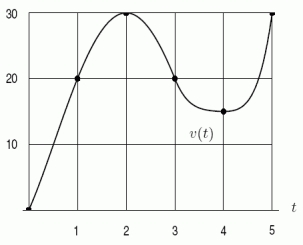
Question
At time t, in seconds, your velocity, v, in meters per second, is given by  for
for  . Use
. Use  to estimate how many meters you traveled during this time.
for . Use to estimate how many meters you traveled during this time. Question
A car is observed to have the following velocities at times t = 0, 2, 4, 6: 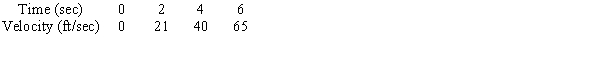 Give a lower estimate for the number of feet the car traveled in first 6 seconds.
Give a lower estimate for the number of feet the car traveled in first 6 seconds. Question
At time t, in seconds, your velocity, v, in meters per second, is given by  for
for  . Use
. Use  to estimate how many meters you traveled during this time.
for . Use to estimate how many meters you traveled during this time. Question
Use a calculator to estimate  . Round your answer to 2 decimal places.
. Round your answer to 2 decimal places. Question
The balance in an investment account increases at a rate of 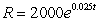 dollars per year, where t is time in years since 2000. Make a table of values for R and use it to give a n upper estimate for the total change in the value of the account between 2000 and 2004.
A)$8369
B)$8444
C)$8519
D)$8594
dollars per year, where t is time in years since 2000. Make a table of values for R and use it to give a n upper estimate for the total change in the value of the account between 2000 and 2004.A)$8369
B)$8444
C)$8519
D)$8594
Question
At time t, in seconds, the velocity v, in feet per second, of a car is given by 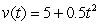 for
for  . A second car travels exactly 20 feet per second faster than the first car. How much greater will the left- and right-hand estimates for the distance traveled by the second car be that the left- and right-hand estimates for the distance traveled by the first car?
for . A second car travels exactly 20 feet per second faster than the first car. How much greater will the left- and right-hand estimates for the distance traveled by the second car be that the left- and right-hand estimates for the distance traveled by the first car? Question
A new factory worker is put to work assembling gadgets. He is fairly slow at first, but over a period of days gets much faster. His employer constructs the following table to evaluate his progress over the first 20 days he is on the job. Give a n upper estimate for the number of gadgets the worker assembled the first 10 days on the job. 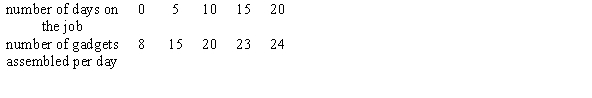
Question
Consider the graph of the function  shown in the following figure.
A. Approximate by using a right-hand sum with 3 subdivisions. Round to 2 decimal places.
B. Is your answer to part (A) a lower or an upper estimate?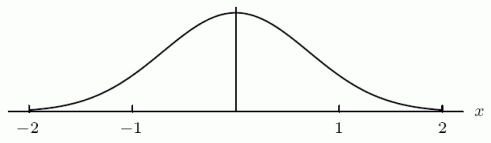
shown in the following figure.A. Approximate
by using a right-hand sum with 3 subdivisions. Round to 2 decimal places.B. Is your answer to part (A) a lower or an upper estimate?
Question
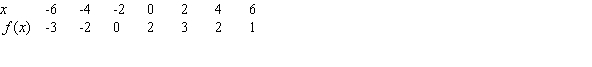
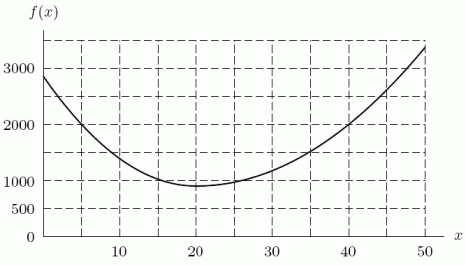
Which of the following is the best approximation for  , where f is shown in the following figure?
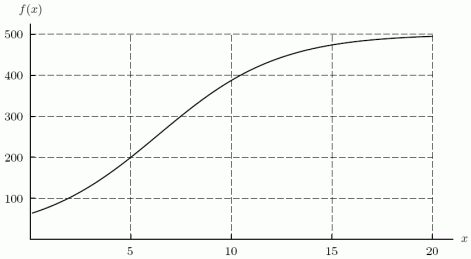
A)350
B)1000
C)4150
D)6025
, where f is shown in the following figure? A)350
B)1000
C)4150
D)6025
Question
If the upper estimate of the area of a region bounded by the curve in the following figure, the horizontal axis, and the vertical lines x = 3 and x = -3 is 15, what is the upper estimate if the graph is shifted up 2 units? 
Question
Use an integral to find the area under the graph of  for
for  .
.
A)17453.35
B)17437.15
C)17473.35
D)17457.15
for .A)17453.35
B)17437.15
C)17473.35
D)17457.15
Question
Use the following table to estimate  using
using  .
. 
using . Question
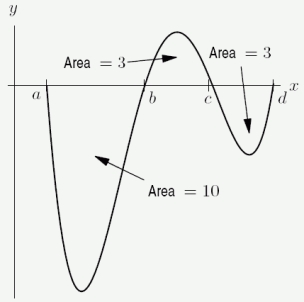
Suppose 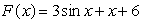 . Find the total area bounded by
  ,
,  ,
,  , and
, and  . Round to 1 decimal place.
. Find the total area bounded by , , , and . Round to 1 decimal place. Question
Your rich eccentric friend has hired you to cover his back yard with grass and patio stone. If the southwest corner of his yard is taken as the origin, with the x-axis pointing eastward and distances measured in feet, then the boundaries of the yard are the lines x = 0, x = 100, y = 0, and f(x) = 110-0.5x. The border between grass and stone is  , with grass covering all of the yard south of the curve. This border also bounds one side of the pool, the other side of the pool being surrounded by the curve
  . All of the rest of the yard is to be covered by stone. Estimate, to the nearest square yard, the area of the grass.
, with grass covering all of the yard south of the curve. This border also bounds one side of the pool, the other side of the pool being surrounded by the curve . All of the rest of the yard is to be covered by stone. Estimate, to the nearest square yard, the area of the grass. Question
Find the area included between the curves  and
and  , from x = 1 to x = 2. Round to 2 decimal places.
and , from x = 1 to x = 2. Round to 2 decimal places. Question
In the following graph, does  appear to be positive, negative, or zero?
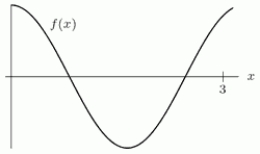
appear to be positive, negative, or zero? Question
Use the following graph to estimate  using the left Riemann sum with three terms.
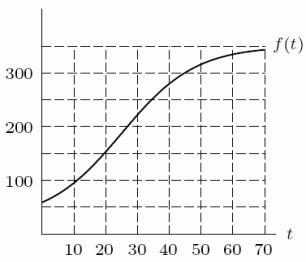
using the left Riemann sum with three terms. Question
Use the following table to estimate the area between  and the x-axis on the interval
  .
. 
A)3
B)8
C)22
D)36
and the x-axis on the interval . A)3
B)8
C)22
D)36
Question
Using the following figure, calculate the value of the right-hand Riemann sum for the function f on the interval  using
using  .
. 
using . Question
You plan to approximate the definite integral  by Riemann sums. Which Riemann sum will be larger, the right or the left?
by Riemann sums. Which Riemann sum will be larger, the right or the left? Question
Estimate the area of the region bounded by  ,
,  ,
,  , and
, and  . Round to 2 decimal places.
, , , and . Round to 2 decimal places. Question
Estimate the area of the region under the curve  for
for  . Round to 2 decimal places.
for . Round to 2 decimal places. Question
Consider the function  , as shown in the following figure. Taking
  , find the upper sum estimate for
  . Round to 3 decimal places.
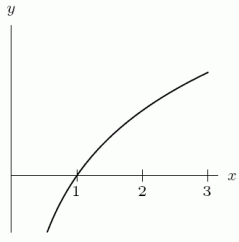
, as shown in the following figure. Taking , find the upper sum estimate for . Round to 3 decimal places. Question
A. Find a 4-term left Riemann sum approximation for the integral  . Round to 1 decimal place.
B. Is your answer in part (A) an underestimate or an overestimate?
. Round to 1 decimal place.B. Is your answer in part (A) an underestimate or an overestimate?
Question
Estimate the area of the region under the curve  and above the x-axis for
  . Round to 2 decimal places.
and above the x-axis for . Round to 2 decimal places. Question
Given the following graph of f, which is the best approximation for  ?
? 
A)51,000
B)78,750
C)84,500
D)100,000
? A)51,000
B)78,750
C)84,500
D)100,000
Question
Estimate the area above the curve  and below y = 4 for
  . Round to 2 decimal places.
and below y = 4 for . Round to 2 decimal places. Question
The marginal cost function for a manufacturing company is given by 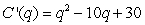 dollars per box, where q is the number of boxes manufactured. If
  , find the total cost of manufacturing 10 boxes. Round to the nearest dollar.
dollars per box, where q is the number of boxes manufactured. If , find the total cost of manufacturing 10 boxes. Round to the nearest dollar. Question
A large scale commercial bakery makes cream filling for snack cakes. The bakery puts a new machine into production. The machine ramps up gradually, increasing cream filling production at a rate of  pounds per day over the first week. How many pounds of cream filling does the new machine make during the first week of production?
A)3987
B)176
C)1469
D)4386
pounds per day over the first week. How many pounds of cream filling does the new machine make during the first week of production?A)3987
B)176
C)1469
D)4386
Question
The rate of growth of the net worth of a company is given by  dollars per year t years after its formation in 1990. How much did it increase in value between 1990 and 2005?
dollars per year t years after its formation in 1990. How much did it increase in value between 1990 and 2005? Question
A reagent is cooling in a laboratory instrument. Explain in words what  means if
  is the temperature of the reagent in degrees Fahrenheit and t is time in minutes.
means if is the temperature of the reagent in degrees Fahrenheit and t is time in minutes. Question
A large ice cube is melting at a rate of  cm3 per minute, where t is time in minutes. If
  is the volume of the ice cube at time t = 0 minutes, which one of the following expresses the volume of the ice cube after 4 hours?
A)
B)
C)
D)
cm3 per minute, where t is time in minutes. If is the volume of the ice cube at time t = 0 minutes, which one of the following expresses the volume of the ice cube after 4 hours?A)
B)
C)
D)
Question
A stamp collector has 3000 stamps in his collection on January 1, 2005, and is collecting more stamps at a rate of  stamps per week, where t is time in weeks since January 1, 2005. Which of the following expresses the number of stamps in his collection at the end of 2005?
A)
B)
C)
D)
stamps per week, where t is time in weeks since January 1, 2005. Which of the following expresses the number of stamps in his collection at the end of 2005?A)
B)
C)
D)
Question
The Ethnic food line at the Cougar Eat can serve customers at the rate of about 30 per hour. From 10 am until 4 pm one day, the rate R at which customers entered then line was about  customers per hour at t hours past 10 am. About how many customers were served between 10 am and 4 pm that day? Round to the nearest whole number.
customers per hour at t hours past 10 am. About how many customers were served between 10 am and 4 pm that day? Round to the nearest whole number. Question
If the velocity function  is measured in feet per second and t gives time in seconds, what are the units of measurement for
  ?
?
A)feet
B)feet/second
C)feet/second2
D)seconds/foot
is measured in feet per second and t gives time in seconds, what are the units of measurement for ?A)feet
B)feet/second
C)feet/second2
D)seconds/foot
Question
According to the European Journal of Clinical Pharmacology, the half-life of the ACE inhibitor lisinopril increases from 12 hours in people with normal kidney function to 24 hours in people with mild kidney failure. A group of patients takes a 5-mg dose of lisinopril at 6 am. The rate that lisinopril decreases in the bloodstream is given by  for normal kidney function and
  for impaired kidney function.
After 16 hours, what is the difference of the amount of lisinopril in the bloodstream between a person with normal kidney function and a person with impaired kidney function?
for normal kidney function and for impaired kidney function.After 16 hours, what is the difference of the amount of lisinopril in the bloodstream between a person with normal kidney function and a person with impaired kidney function?
Question
The Ethnic food line at the Cougar Eat can serve customers at the rate of about 30 per hour. From 10 am until 4 pm one day, the rate R at which customers entered then line was about  customers per hour at t hours past 10 am. About what time did a waiting line form?
A)11:15 am
B)11:00 am
C)11:30 am
D)11:45 am
customers per hour at t hours past 10 am. About what time did a waiting line form?A)11:15 am
B)11:00 am
C)11:30 am
D)11:45 am
Question
What are the units of  if t is measured in km/hr and f is in hours?
A)km
B)km/hr
C)km/hr2
D)km hr
hr
if t is measured in km/hr and f is in hours?A)km
B)km/hr
C)km/hr2
D)km
hr Question
The table below gives the average rate of monthly U.S. field production of crude oil for each decade from the 1920s through the 2000s (based on estimates calculated from the US Energy Information Administration). Use this data to estimate the total US field production from the 1920s to the 2000s. Note that there are 120 months in a decade. Production is given in millions of barrels per month. 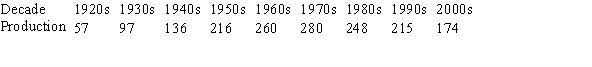
A)188,160,000,000 barrels
B)94,050,000,000 barrels
C)221,352,000,000 barrels
D)72,350,000,000 barrels
A)188,160,000,000 barrels
B)94,050,000,000 barrels
C)221,352,000,000 barrels
D)72,350,000,000 barrels
Question
Sales of a new product are increasing at a rate of  units per month, where t is time in months since the product was introduced. How many units were sold the first 3 months since the product was introduced? Set up an integral and use a calculator to evaluate it to the nearest whole unit.
units per month, where t is time in months since the product was introduced. How many units were sold the first 3 months since the product was introduced? Set up an integral and use a calculator to evaluate it to the nearest whole unit. Question
Question
After a foreign substance is introduced into the blood, the rate at which antibodies are made is given by  thousands of antibodies per minute, where time t is measured in minutes and
  . If there are no antibodies in the blood at t = 0, how many antibodies are there after 5 minutes? Round to the nearest whole number.
thousands of antibodies per minute, where time t is measured in minutes and . If there are no antibodies in the blood at t = 0, how many antibodies are there after 5 minutes? Round to the nearest whole number. Question
The Ethnic food line at the Cougar Eat can serve customers at the rate of about 30 per hour. From 10 am until 4 pm one day, the rate R at which customers entered then line was about  customers per hour at t hours past 10 am. About when was the waiting line the longest?
A)3:00 pm
B)2:45 pm
C)2:30 pm
D)2:15 pm
customers per hour at t hours past 10 am. About when was the waiting line the longest?A)3:00 pm
B)2:45 pm
C)2:30 pm
D)2:15 pm
Question
A shop is open from 9am-7pm. The function  graphed below gives the rate at which customers arrive (in people/hour) at time t. Suppose that the salespeople can serve customers at a rate of 80 people per hour.
A. People have to start waiting in line before being served at about _____ o'clock.
B. The number of people in line when the line is the longest is about _____.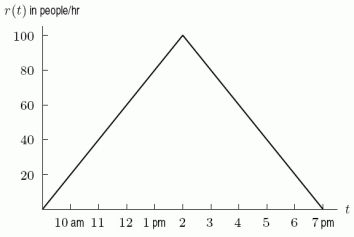
graphed below gives the rate at which customers arrive (in people/hour) at time t. Suppose that the salespeople can serve customers at a rate of 80 people per hour.A. People have to start waiting in line before being served at about _____ o'clock.
B. The number of people in line when the line is the longest is about _____.
Question
Equal numbers of two different species of ground squirrels are introduced into an area at time t = 0, with t in years. They have the growth rates shown in the following figure. Which species will have a larger population after 13 years? 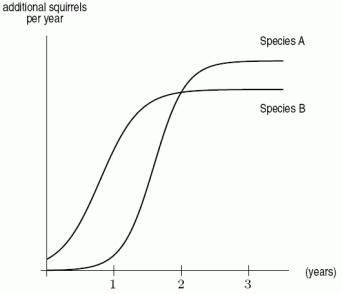
A)Species A
B)Species B
A)Species A
B)Species B
Question
A water line made of PVC decays and eventually breaks. The rate that water flows into the street from the break is given by the function 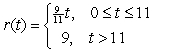 , in gallons per hour. Use a calculator or graph to determine how many gallons of water have been lost from the water line break after 13 hours.
A)67.5 gallons
B)166.5 gallons
C)93.5 gallons
D)112.5 gallons
, in gallons per hour. Use a calculator or graph to determine how many gallons of water have been lost from the water line break after 13 hours.A)67.5 gallons
B)166.5 gallons
C)93.5 gallons
D)112.5 gallons
Question
The upper half of the ellipse below has equation  . Find the area in the first quadrant between the ellipse and the line
  . Give your answer to two decimal places.
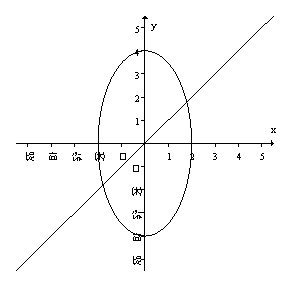
A)1.57
B)2.57
C)3.14
D)1.14
. Find the area in the first quadrant between the ellipse and the line . Give your answer to two decimal places. A)1.57
B)2.57
C)3.14
D)1.14
Question
The marginal cost in dollars per unit of producing q units is given in the following table. Estimate the total variable cost to produce 25 units. 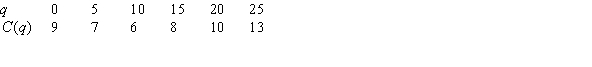
Question
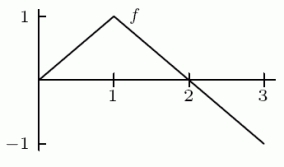
The marginal cost function of producing a particular product is given by 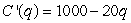 , where q is quantity. If the fixed costs are $3000, what is the total cost to produce 10 items?
, where q is quantity. If the fixed costs are $3000, what is the total cost to produce 10 items? Question
The following table gives the rate  , in cubic centimeters, that air is leaking from a balloon t seconds after it is inflated. Estimate
  .
. 
A)192.5 cubic centimeters
B)49 cubic centimeters
C)245 cubic centimeters
D)75.5 cubic centimeters
, in cubic centimeters, that air is leaking from a balloon t seconds after it is inflated. Estimate . A)192.5 cubic centimeters
B)49 cubic centimeters
C)245 cubic centimeters
D)75.5 cubic centimeters
Question
Use the following figure to find the value of 

Question
If  is a production rate, measured in items per hour, then how many items were produced from hour 2 to hour 6?
is a production rate, measured in items per hour, then how many items were produced from hour 2 to hour 6? Question
The graph of f is shown in the following figure. Find  if
if  and
and  .
. 
if and . Question
Suppose  and
and  . Then
  has a local _______ (maximum/minimum) on
  at x = _____.
and . Then has a local _______ (maximum/minimum) on at x = _____. Question
The graph below shows a marginal cost function,  $ per item. If the fixed cost is $900, estimate the total cost of producing 250 items.
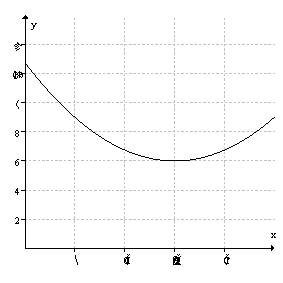
A)$ 2850
B)$ 1950
C)$1530
D)$2950
$ per item. If the fixed cost is $900, estimate the total cost of producing 250 items. A)$ 2850
B)$ 1950
C)$1530
D)$2950
Question
Question
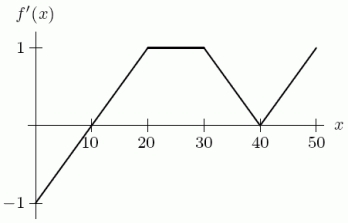
The graph of  is shown in the following figure. Given that
  , find
  .
. 
is shown in the following figure. Given that , find . Question
The graph of  is shown below. If f is increasing at x = -1, which of the following must be true? Choose all that apply.
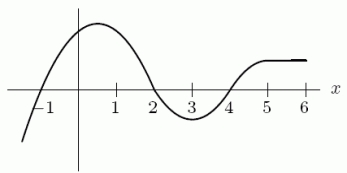

A)
B)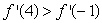
C)
D)
is shown below. If f is increasing at x = -1, which of the following must be true? Choose all that apply. A)
B)
C)
D)
Question
A local business produces souvenirs for the tourist trade. The business has fixed costs of $6 thousand, and it costs an additional $9.93 thousand in variable costs to produce 10 thousand souvenirs. A consultant told the business that their marginal cost function is 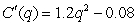 dollars per thousand souvenirs. What will it cost to increase their production to 19 thousand souvenirs?
A)$ 2,735
B)$ 2,582
C)$ 1,397
D)$ 2,324
dollars per thousand souvenirs. What will it cost to increase their production to 19 thousand souvenirs?A)$ 2,735
B)$ 2,582
C)$ 1,397
D)$ 2,324
Question
If  and f is continuous, then f must have at least one zero between a and b (assume
  ).
).
and f is continuous, then f must have at least one zero between a and b (assume ). Question
Use the following figure to estimate  (average left- and right-hand sums).
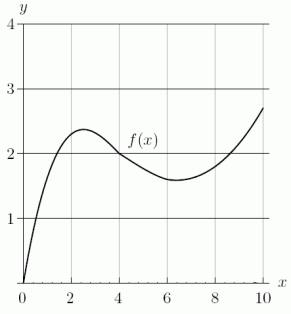
(average left- and right-hand sums). Question
The following table gives the rate, in cubic centimeters, that air is leaking from a balloon t seconds after it is inflated. Let  be that rate. What is the meaning of
  ?
? 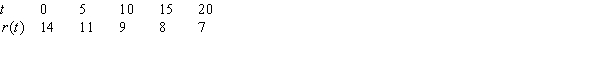
A)The rate in cubic centimeters per second that air is leaking out of the balloon after 15 seconds.
B)The total number of cubic centimeters of air that have leaked out of the balloon after 15 seconds.
C)The number of seconds it takes for 15 cubic centimeters of air to leak out of the balloon.
D)The number of seconds it takes for the rate air is leaking out of the balloon to be 15 cubic centimeters per minute.
be that rate. What is the meaning of ? A)The rate in cubic centimeters per second that air is leaking out of the balloon after 15 seconds.
B)The total number of cubic centimeters of air that have leaked out of the balloon after 15 seconds.
C)The number of seconds it takes for 15 cubic centimeters of air to leak out of the balloon.
D)The number of seconds it takes for the rate air is leaking out of the balloon to be 15 cubic centimeters per minute.
Question
If  represents the rate at which a country's debt is growing, then the increase in its debt between 1980 and 1985 is given by
A)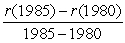
B)
C)
D)
E)
represents the rate at which a country's debt is growing, then the increase in its debt between 1980 and 1985 is given byA)
B)
C)
D)
E)
Question
The marginal cost function of producing a particular product is given by  , where q is the number of items produced. If the fixed costs are $4000 and the items are sold for $700 each, what is the break even point?
, where q is the number of items produced. If the fixed costs are $4000 and the items are sold for $700 each, what is the break even point? Question
Suppose  and
and  . Use a calculator to calculate
  .
.
and . Use a calculator to calculate . Question
Water is flowing into a container at an increasing rate, as shown in the following table. Give a lower estimate for the total number of gallons of water in the container after 30 minutes. 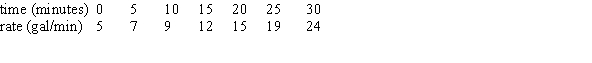
Question
Use the following figure to find the value of 

Unlock Deck
Sign up to unlock the cards in this deck!
Unlock Deck
Unlock Deck
1/93
Play
Full screen (f)
Deck 5: Accumulated Change: the Definite Integral
1
The following figure shows the rate of change of enrollment for a community college. Estimate the total change in enrollment over the first 6 years.
A)1900 students
B)2300 students
C)2700 students
D)2900 students
A)1900 students
B)2300 students
C)2700 students
D)2900 students
1900 students
2
Consider a sports car which accelerates from 0 ft/sec to 85 ft/sec in 5 seconds (85 ft/sec = 58 mph). The car's velocity is given in the following table. What is the lower bound for the number of feet the car travels in 5 seconds?
230
3
Find for .
A)
B)
C)
D)
for .A)
B)
C)
D)
4
The flow rate of water in a mountain stream due to spring runoff is given in the following table. Give your best estimate (average of upper and lower limit) of how many cubic meters of water flowed through from 6:00 pm to midnight.
Unlock Deck
Unlock for access to all 93 flashcards in this deck.
Unlock Deck
k this deck
5
The rate of pollution pouring into a lake is measured every 10 days, with results in the following table. About how many tons of pollution have entered the lake during the first 40 days?
Unlock Deck
Unlock for access to all 93 flashcards in this deck.
Unlock Deck
k this deck
6
Consider a sports car which accelerates from 0 ft/sec to 85 ft/sec in 5 seconds (85 ft/sec = 58 mph). The car's velocity is given in the following table. Over which time interval in the average acceleration the smallest?
A)The last
B)The fourth
C)The third
D)The second
E)The first
A)The last
B)The fourth
C)The third
D)The second
E)The first
Unlock Deck
Unlock for access to all 93 flashcards in this deck.
Unlock Deck
k this deck
7
Use a calculator to evaluate . Round your answer to 2 decimal places.
. Round your answer to 2 decimal places. Unlock Deck
Unlock for access to all 93 flashcards in this deck.
Unlock Deck
k this deck
8
Use a calculator to evaluate . Round your answer to 2 decimal places.
. Round your answer to 2 decimal places. Unlock Deck
Unlock for access to all 93 flashcards in this deck.
Unlock Deck
k this deck
9
The following figure shows the graph of the velocity, v, of an object (in meters/sec). If the graph were shifted up 4 units, how would the distance traveled between t = 0 and t = 6 change?
A)It would increase by 4 meters.
B)It would decrease by 4 meters.
C)It would increase by 24 meters.
D)It would decrease by 24 meters.
E)It would remain the same.
A)It would increase by 4 meters.
B)It would decrease by 4 meters.
C)It would increase by 24 meters.
D)It would decrease by 24 meters.
E)It would remain the same.
Unlock Deck
Unlock for access to all 93 flashcards in this deck.
Unlock Deck
k this deck
10
At time t, in seconds, the velocity v, in miles per hour, of a car is given by for . Use to estimate how many miles were traveled during this time (average left- and right-hand sums).
for . Use to estimate how many miles were traveled during this time (average left- and right-hand sums). Unlock Deck
Unlock for access to all 93 flashcards in this deck.
Unlock Deck
k this deck
11
Two cars start at the same time and travel in the same direction along a straight road. The following figure gives the velocity, v, of each car as a function of time, t. Which car reached the larger maximum velocity?
A)Car B
B)Car A
A)Car B
B)Car A
Unlock Deck
Unlock for access to all 93 flashcards in this deck.
Unlock Deck
k this deck
12
Your velocity, in meters per second, is given by , where t is time in seconds. Estimate your distance traveled over the first 6 seconds.
A)97 meters
B)103 meters
C)109 meters
D)115 meters
, where t is time in seconds. Estimate your distance traveled over the first 6 seconds.A)97 meters
B)103 meters
C)109 meters
D)115 meters
Unlock Deck
Unlock for access to all 93 flashcards in this deck.
Unlock Deck
k this deck
13
The graph below shows the velocity of an object (in meters/second). Find an upper bound for the number of meters traveled from t = 1 to t = 5 seconds.
Unlock Deck
Unlock for access to all 93 flashcards in this deck.
Unlock Deck
k this deck
14
At time t, in seconds, your velocity, v, in meters per second, is given by for . Use to estimate how many meters you traveled during this time.
for . Use to estimate how many meters you traveled during this time. Unlock Deck
Unlock for access to all 93 flashcards in this deck.
Unlock Deck
k this deck
15
A car is observed to have the following velocities at times t = 0, 2, 4, 6: Give a lower estimate for the number of feet the car traveled in first 6 seconds.
Give a lower estimate for the number of feet the car traveled in first 6 seconds. Unlock Deck
Unlock for access to all 93 flashcards in this deck.
Unlock Deck
k this deck
16
At time t, in seconds, your velocity, v, in meters per second, is given by for . Use to estimate how many meters you traveled during this time.
for . Use to estimate how many meters you traveled during this time. Unlock Deck
Unlock for access to all 93 flashcards in this deck.
Unlock Deck
k this deck
17
Use a calculator to estimate . Round your answer to 2 decimal places.
. Round your answer to 2 decimal places. Unlock Deck
Unlock for access to all 93 flashcards in this deck.
Unlock Deck
k this deck
18
The balance in an investment account increases at a rate of dollars per year, where t is time in years since 2000. Make a table of values for R and use it to give a n upper estimate for the total change in the value of the account between 2000 and 2004.
A)$8369
B)$8444
C)$8519
D)$8594
dollars per year, where t is time in years since 2000. Make a table of values for R and use it to give a n upper estimate for the total change in the value of the account between 2000 and 2004.A)$8369
B)$8444
C)$8519
D)$8594
Unlock Deck
Unlock for access to all 93 flashcards in this deck.
Unlock Deck
k this deck
19
At time t, in seconds, the velocity v, in feet per second, of a car is given by for . A second car travels exactly 20 feet per second faster than the first car. How much greater will the left- and right-hand estimates for the distance traveled by the second car be that the left- and right-hand estimates for the distance traveled by the first car?
for . A second car travels exactly 20 feet per second faster than the first car. How much greater will the left- and right-hand estimates for the distance traveled by the second car be that the left- and right-hand estimates for the distance traveled by the first car? Unlock Deck
Unlock for access to all 93 flashcards in this deck.
Unlock Deck
k this deck
20
A new factory worker is put to work assembling gadgets. He is fairly slow at first, but over a period of days gets much faster. His employer constructs the following table to evaluate his progress over the first 20 days he is on the job. Give a n upper estimate for the number of gadgets the worker assembled the first 10 days on the job.
Unlock Deck
Unlock for access to all 93 flashcards in this deck.
Unlock Deck
k this deck
21
Consider the graph of the function shown in the following figure.
A. Approximate by using a right-hand sum with 3 subdivisions. Round to 2 decimal places.
B. Is your answer to part (A) a lower or an upper estimate?
shown in the following figure.A. Approximate
by using a right-hand sum with 3 subdivisions. Round to 2 decimal places.B. Is your answer to part (A) a lower or an upper estimate?
Unlock Deck
Unlock for access to all 93 flashcards in this deck.
Unlock Deck
k this deck
22
Which of the following is the best approximation for , where f is shown in the following figure?
A)350
B)1000
C)4150
D)6025
, where f is shown in the following figure? A)350
B)1000
C)4150
D)6025
Unlock Deck
Unlock for access to all 93 flashcards in this deck.
Unlock Deck
k this deck
23
If the upper estimate of the area of a region bounded by the curve in the following figure, the horizontal axis, and the vertical lines x = 3 and x = -3 is 15, what is the upper estimate if the graph is shifted up 2 units?
Unlock Deck
Unlock for access to all 93 flashcards in this deck.
Unlock Deck
k this deck
24
Use an integral to find the area under the graph of for .
A)17453.35
B)17437.15
C)17473.35
D)17457.15
for .A)17453.35
B)17437.15
C)17473.35
D)17457.15
Unlock Deck
Unlock for access to all 93 flashcards in this deck.
Unlock Deck
k this deck
25
Use the following table to estimate using .
using . Unlock Deck
Unlock for access to all 93 flashcards in this deck.
Unlock Deck
k this deck
26
Suppose . Find the total area bounded by , , , and . Round to 1 decimal place.
. Find the total area bounded by , , , and . Round to 1 decimal place. Unlock Deck
Unlock for access to all 93 flashcards in this deck.
Unlock Deck
k this deck
27
Your rich eccentric friend has hired you to cover his back yard with grass and patio stone. If the southwest corner of his yard is taken as the origin, with the x-axis pointing eastward and distances measured in feet, then the boundaries of the yard are the lines x = 0, x = 100, y = 0, and f(x) = 110-0.5x. The border between grass and stone is , with grass covering all of the yard south of the curve. This border also bounds one side of the pool, the other side of the pool being surrounded by the curve . All of the rest of the yard is to be covered by stone. Estimate, to the nearest square yard, the area of the grass.
, with grass covering all of the yard south of the curve. This border also bounds one side of the pool, the other side of the pool being surrounded by the curve . All of the rest of the yard is to be covered by stone. Estimate, to the nearest square yard, the area of the grass. Unlock Deck
Unlock for access to all 93 flashcards in this deck.
Unlock Deck
k this deck
28
Find the area included between the curves and , from x = 1 to x = 2. Round to 2 decimal places.
and , from x = 1 to x = 2. Round to 2 decimal places. Unlock Deck
Unlock for access to all 93 flashcards in this deck.
Unlock Deck
k this deck
29
In the following graph, does appear to be positive, negative, or zero?
appear to be positive, negative, or zero? Unlock Deck
Unlock for access to all 93 flashcards in this deck.
Unlock Deck
k this deck
30
Use the following graph to estimate using the left Riemann sum with three terms.
using the left Riemann sum with three terms. Unlock Deck
Unlock for access to all 93 flashcards in this deck.
Unlock Deck
k this deck
31
Use the following table to estimate the area between and the x-axis on the interval .
A)3
B)8
C)22
D)36
and the x-axis on the interval . A)3
B)8
C)22
D)36
Unlock Deck
Unlock for access to all 93 flashcards in this deck.
Unlock Deck
k this deck
32
Using the following figure, calculate the value of the right-hand Riemann sum for the function f on the interval using .
using . Unlock Deck
Unlock for access to all 93 flashcards in this deck.
Unlock Deck
k this deck
33
You plan to approximate the definite integral by Riemann sums. Which Riemann sum will be larger, the right or the left?
by Riemann sums. Which Riemann sum will be larger, the right or the left? Unlock Deck
Unlock for access to all 93 flashcards in this deck.
Unlock Deck
k this deck
34
Estimate the area of the region bounded by , , , and . Round to 2 decimal places.
, , , and . Round to 2 decimal places. Unlock Deck
Unlock for access to all 93 flashcards in this deck.
Unlock Deck
k this deck
35
Estimate the area of the region under the curve for . Round to 2 decimal places.
for . Round to 2 decimal places. Unlock Deck
Unlock for access to all 93 flashcards in this deck.
Unlock Deck
k this deck
36
Consider the function , as shown in the following figure. Taking , find the upper sum estimate for . Round to 3 decimal places.
, as shown in the following figure. Taking , find the upper sum estimate for . Round to 3 decimal places. Unlock Deck
Unlock for access to all 93 flashcards in this deck.
Unlock Deck
k this deck
37
A. Find a 4-term left Riemann sum approximation for the integral . Round to 1 decimal place.
B. Is your answer in part (A) an underestimate or an overestimate?
. Round to 1 decimal place.B. Is your answer in part (A) an underestimate or an overestimate?
Unlock Deck
Unlock for access to all 93 flashcards in this deck.
Unlock Deck
k this deck
38
Estimate the area of the region under the curve and above the x-axis for . Round to 2 decimal places.
and above the x-axis for . Round to 2 decimal places. Unlock Deck
Unlock for access to all 93 flashcards in this deck.
Unlock Deck
k this deck
39
Given the following graph of f, which is the best approximation for ?
A)51,000
B)78,750
C)84,500
D)100,000
? A)51,000
B)78,750
C)84,500
D)100,000
Unlock Deck
Unlock for access to all 93 flashcards in this deck.
Unlock Deck
k this deck
40
Estimate the area above the curve and below y = 4 for . Round to 2 decimal places.
and below y = 4 for . Round to 2 decimal places. Unlock Deck
Unlock for access to all 93 flashcards in this deck.
Unlock Deck
k this deck
41
The marginal cost function for a manufacturing company is given by dollars per box, where q is the number of boxes manufactured. If , find the total cost of manufacturing 10 boxes. Round to the nearest dollar.
dollars per box, where q is the number of boxes manufactured. If , find the total cost of manufacturing 10 boxes. Round to the nearest dollar. Unlock Deck
Unlock for access to all 93 flashcards in this deck.
Unlock Deck
k this deck
42
A large scale commercial bakery makes cream filling for snack cakes. The bakery puts a new machine into production. The machine ramps up gradually, increasing cream filling production at a rate of pounds per day over the first week. How many pounds of cream filling does the new machine make during the first week of production?
A)3987
B)176
C)1469
D)4386
pounds per day over the first week. How many pounds of cream filling does the new machine make during the first week of production?A)3987
B)176
C)1469
D)4386
Unlock Deck
Unlock for access to all 93 flashcards in this deck.
Unlock Deck
k this deck
43
The rate of growth of the net worth of a company is given by dollars per year t years after its formation in 1990. How much did it increase in value between 1990 and 2005?
dollars per year t years after its formation in 1990. How much did it increase in value between 1990 and 2005? Unlock Deck
Unlock for access to all 93 flashcards in this deck.
Unlock Deck
k this deck
44
A reagent is cooling in a laboratory instrument. Explain in words what means if is the temperature of the reagent in degrees Fahrenheit and t is time in minutes.
means if is the temperature of the reagent in degrees Fahrenheit and t is time in minutes. Unlock Deck
Unlock for access to all 93 flashcards in this deck.
Unlock Deck
k this deck
45
A large ice cube is melting at a rate of cm3 per minute, where t is time in minutes. If is the volume of the ice cube at time t = 0 minutes, which one of the following expresses the volume of the ice cube after 4 hours?
A)
B)
C)
D)
cm3 per minute, where t is time in minutes. If is the volume of the ice cube at time t = 0 minutes, which one of the following expresses the volume of the ice cube after 4 hours?A)
B)
C)
D)
Unlock Deck
Unlock for access to all 93 flashcards in this deck.
Unlock Deck
k this deck
46
A stamp collector has 3000 stamps in his collection on January 1, 2005, and is collecting more stamps at a rate of stamps per week, where t is time in weeks since January 1, 2005. Which of the following expresses the number of stamps in his collection at the end of 2005?
A)
B)
C)
D)
stamps per week, where t is time in weeks since January 1, 2005. Which of the following expresses the number of stamps in his collection at the end of 2005?A)
B)
C)
D)
Unlock Deck
Unlock for access to all 93 flashcards in this deck.
Unlock Deck
k this deck
47
The Ethnic food line at the Cougar Eat can serve customers at the rate of about 30 per hour. From 10 am until 4 pm one day, the rate R at which customers entered then line was about customers per hour at t hours past 10 am. About how many customers were served between 10 am and 4 pm that day? Round to the nearest whole number.
customers per hour at t hours past 10 am. About how many customers were served between 10 am and 4 pm that day? Round to the nearest whole number. Unlock Deck
Unlock for access to all 93 flashcards in this deck.
Unlock Deck
k this deck
48
If the velocity function is measured in feet per second and t gives time in seconds, what are the units of measurement for ?
A)feet
B)feet/second
C)feet/second2
D)seconds/foot
is measured in feet per second and t gives time in seconds, what are the units of measurement for ?A)feet
B)feet/second
C)feet/second2
D)seconds/foot
Unlock Deck
Unlock for access to all 93 flashcards in this deck.
Unlock Deck
k this deck
49
According to the European Journal of Clinical Pharmacology, the half-life of the ACE inhibitor lisinopril increases from 12 hours in people with normal kidney function to 24 hours in people with mild kidney failure. A group of patients takes a 5-mg dose of lisinopril at 6 am. The rate that lisinopril decreases in the bloodstream is given by for normal kidney function and for impaired kidney function.
After 16 hours, what is the difference of the amount of lisinopril in the bloodstream between a person with normal kidney function and a person with impaired kidney function?
for normal kidney function and for impaired kidney function.After 16 hours, what is the difference of the amount of lisinopril in the bloodstream between a person with normal kidney function and a person with impaired kidney function?
Unlock Deck
Unlock for access to all 93 flashcards in this deck.
Unlock Deck
k this deck
50
The Ethnic food line at the Cougar Eat can serve customers at the rate of about 30 per hour. From 10 am until 4 pm one day, the rate R at which customers entered then line was about customers per hour at t hours past 10 am. About what time did a waiting line form?
A)11:15 am
B)11:00 am
C)11:30 am
D)11:45 am
customers per hour at t hours past 10 am. About what time did a waiting line form?A)11:15 am
B)11:00 am
C)11:30 am
D)11:45 am
Unlock Deck
Unlock for access to all 93 flashcards in this deck.
Unlock Deck
k this deck
51
What are the units of if t is measured in km/hr and f is in hours?
A)km
B)km/hr
C)km/hr2
D)km hr
if t is measured in km/hr and f is in hours?A)km
B)km/hr
C)km/hr2
D)km
hr Unlock Deck
Unlock for access to all 93 flashcards in this deck.
Unlock Deck
k this deck
52
The table below gives the average rate of monthly U.S. field production of crude oil for each decade from the 1920s through the 2000s (based on estimates calculated from the US Energy Information Administration). Use this data to estimate the total US field production from the 1920s to the 2000s. Note that there are 120 months in a decade. Production is given in millions of barrels per month.
A)188,160,000,000 barrels
B)94,050,000,000 barrels
C)221,352,000,000 barrels
D)72,350,000,000 barrels
A)188,160,000,000 barrels
B)94,050,000,000 barrels
C)221,352,000,000 barrels
D)72,350,000,000 barrels
Unlock Deck
Unlock for access to all 93 flashcards in this deck.
Unlock Deck
k this deck
53
Sales of a new product are increasing at a rate of units per month, where t is time in months since the product was introduced. How many units were sold the first 3 months since the product was introduced? Set up an integral and use a calculator to evaluate it to the nearest whole unit.
units per month, where t is time in months since the product was introduced. How many units were sold the first 3 months since the product was introduced? Set up an integral and use a calculator to evaluate it to the nearest whole unit. Unlock Deck
Unlock for access to all 93 flashcards in this deck.
Unlock Deck
k this deck
54
On a recently discovered planetoid, acceleration due to gravity is 13 feet/ sec2. While building a research habitat, a hammer is dropped from the top of a tower and hits the ground in 15 seconds. Because the hammer is dropped, its initial velocity is 0. Use a graph of the velocity function to determine the height of the tower.
A)1463 feet
B)1125 feet
C)1170 feet
D)1755 feet
A)1463 feet
B)1125 feet
C)1170 feet
D)1755 feet
Unlock Deck
Unlock for access to all 93 flashcards in this deck.
Unlock Deck
k this deck
55
After a foreign substance is introduced into the blood, the rate at which antibodies are made is given by thousands of antibodies per minute, where time t is measured in minutes and . If there are no antibodies in the blood at t = 0, how many antibodies are there after 5 minutes? Round to the nearest whole number.
thousands of antibodies per minute, where time t is measured in minutes and . If there are no antibodies in the blood at t = 0, how many antibodies are there after 5 minutes? Round to the nearest whole number. Unlock Deck
Unlock for access to all 93 flashcards in this deck.
Unlock Deck
k this deck
56
The Ethnic food line at the Cougar Eat can serve customers at the rate of about 30 per hour. From 10 am until 4 pm one day, the rate R at which customers entered then line was about customers per hour at t hours past 10 am. About when was the waiting line the longest?
A)3:00 pm
B)2:45 pm
C)2:30 pm
D)2:15 pm
customers per hour at t hours past 10 am. About when was the waiting line the longest?A)3:00 pm
B)2:45 pm
C)2:30 pm
D)2:15 pm
Unlock Deck
Unlock for access to all 93 flashcards in this deck.
Unlock Deck
k this deck
57
A shop is open from 9am-7pm. The function graphed below gives the rate at which customers arrive (in people/hour) at time t. Suppose that the salespeople can serve customers at a rate of 80 people per hour.
A. People have to start waiting in line before being served at about _____ o'clock.
B. The number of people in line when the line is the longest is about _____.
graphed below gives the rate at which customers arrive (in people/hour) at time t. Suppose that the salespeople can serve customers at a rate of 80 people per hour.A. People have to start waiting in line before being served at about _____ o'clock.
B. The number of people in line when the line is the longest is about _____.
Unlock Deck
Unlock for access to all 93 flashcards in this deck.
Unlock Deck
k this deck
58
Equal numbers of two different species of ground squirrels are introduced into an area at time t = 0, with t in years. They have the growth rates shown in the following figure. Which species will have a larger population after 13 years?
A)Species A
B)Species B
A)Species A
B)Species B
Unlock Deck
Unlock for access to all 93 flashcards in this deck.
Unlock Deck
k this deck
59
A water line made of PVC decays and eventually breaks. The rate that water flows into the street from the break is given by the function , in gallons per hour. Use a calculator or graph to determine how many gallons of water have been lost from the water line break after 13 hours.
A)67.5 gallons
B)166.5 gallons
C)93.5 gallons
D)112.5 gallons
, in gallons per hour. Use a calculator or graph to determine how many gallons of water have been lost from the water line break after 13 hours.A)67.5 gallons
B)166.5 gallons
C)93.5 gallons
D)112.5 gallons
Unlock Deck
Unlock for access to all 93 flashcards in this deck.
Unlock Deck
k this deck
60
The upper half of the ellipse below has equation . Find the area in the first quadrant between the ellipse and the line . Give your answer to two decimal places.
A)1.57
B)2.57
C)3.14
D)1.14
. Find the area in the first quadrant between the ellipse and the line . Give your answer to two decimal places. A)1.57
B)2.57
C)3.14
D)1.14
Unlock Deck
Unlock for access to all 93 flashcards in this deck.
Unlock Deck
k this deck
61
The marginal cost in dollars per unit of producing q units is given in the following table. Estimate the total variable cost to produce 25 units.
Unlock Deck
Unlock for access to all 93 flashcards in this deck.
Unlock Deck
k this deck
62
The marginal cost function of producing a particular product is given by , where q is quantity. If the fixed costs are $3000, what is the total cost to produce 10 items?
, where q is quantity. If the fixed costs are $3000, what is the total cost to produce 10 items? Unlock Deck
Unlock for access to all 93 flashcards in this deck.
Unlock Deck
k this deck
63
The following table gives the rate , in cubic centimeters, that air is leaking from a balloon t seconds after it is inflated. Estimate .
A)192.5 cubic centimeters
B)49 cubic centimeters
C)245 cubic centimeters
D)75.5 cubic centimeters
, in cubic centimeters, that air is leaking from a balloon t seconds after it is inflated. Estimate . A)192.5 cubic centimeters
B)49 cubic centimeters
C)245 cubic centimeters
D)75.5 cubic centimeters
Unlock Deck
Unlock for access to all 93 flashcards in this deck.
Unlock Deck
k this deck
64
Use the following figure to find the value of
Unlock Deck
Unlock for access to all 93 flashcards in this deck.
Unlock Deck
k this deck
65
If is a production rate, measured in items per hour, then how many items were produced from hour 2 to hour 6?
is a production rate, measured in items per hour, then how many items were produced from hour 2 to hour 6? Unlock Deck
Unlock for access to all 93 flashcards in this deck.
Unlock Deck
k this deck
66
The graph of f is shown in the following figure. Find if and .
if and . Unlock Deck
Unlock for access to all 93 flashcards in this deck.
Unlock Deck
k this deck
67
Suppose and . Then has a local _______ (maximum/minimum) on at x = _____.
and . Then has a local _______ (maximum/minimum) on at x = _____. Unlock Deck
Unlock for access to all 93 flashcards in this deck.
Unlock Deck
k this deck
68
The graph below shows a marginal cost function, $ per item. If the fixed cost is $900, estimate the total cost of producing 250 items.
A)$ 2850
B)$ 1950
C)$1530
D)$2950
$ per item. If the fixed cost is $900, estimate the total cost of producing 250 items. A)$ 2850
B)$ 1950
C)$1530
D)$2950
Unlock Deck
Unlock for access to all 93 flashcards in this deck.
Unlock Deck
k this deck
69
If a function is concave up, then the left-hand Reimann sums are always less than the right-hand Reimann sums with the same subdivisions, over the same intervals.
Unlock Deck
Unlock for access to all 93 flashcards in this deck.
Unlock Deck
k this deck
70
The graph of is shown in the following figure. Given that , find .
is shown in the following figure. Given that , find . Unlock Deck
Unlock for access to all 93 flashcards in this deck.
Unlock Deck
k this deck
71
The graph of is shown below. If f is increasing at x = -1, which of the following must be true? Choose all that apply.
A)
B)
C)
D)
is shown below. If f is increasing at x = -1, which of the following must be true? Choose all that apply. A)
B)
C)
D)
Unlock Deck
Unlock for access to all 93 flashcards in this deck.
Unlock Deck
k this deck
72
A local business produces souvenirs for the tourist trade. The business has fixed costs of $6 thousand, and it costs an additional $9.93 thousand in variable costs to produce 10 thousand souvenirs. A consultant told the business that their marginal cost function is dollars per thousand souvenirs. What will it cost to increase their production to 19 thousand souvenirs?
A)$ 2,735
B)$ 2,582
C)$ 1,397
D)$ 2,324
dollars per thousand souvenirs. What will it cost to increase their production to 19 thousand souvenirs?A)$ 2,735
B)$ 2,582
C)$ 1,397
D)$ 2,324
Unlock Deck
Unlock for access to all 93 flashcards in this deck.
Unlock Deck
k this deck
73
If and f is continuous, then f must have at least one zero between a and b (assume ).
and f is continuous, then f must have at least one zero between a and b (assume ). Unlock Deck
Unlock for access to all 93 flashcards in this deck.
Unlock Deck
k this deck
74
Use the following figure to estimate (average left- and right-hand sums).
(average left- and right-hand sums). Unlock Deck
Unlock for access to all 93 flashcards in this deck.
Unlock Deck
k this deck
75
The following table gives the rate, in cubic centimeters, that air is leaking from a balloon t seconds after it is inflated. Let be that rate. What is the meaning of ?
A)The rate in cubic centimeters per second that air is leaking out of the balloon after 15 seconds.
B)The total number of cubic centimeters of air that have leaked out of the balloon after 15 seconds.
C)The number of seconds it takes for 15 cubic centimeters of air to leak out of the balloon.
D)The number of seconds it takes for the rate air is leaking out of the balloon to be 15 cubic centimeters per minute.
be that rate. What is the meaning of ? A)The rate in cubic centimeters per second that air is leaking out of the balloon after 15 seconds.
B)The total number of cubic centimeters of air that have leaked out of the balloon after 15 seconds.
C)The number of seconds it takes for 15 cubic centimeters of air to leak out of the balloon.
D)The number of seconds it takes for the rate air is leaking out of the balloon to be 15 cubic centimeters per minute.
Unlock Deck
Unlock for access to all 93 flashcards in this deck.
Unlock Deck
k this deck
76
If represents the rate at which a country's debt is growing, then the increase in its debt between 1980 and 1985 is given by
A)
B)
C)
D)
E)
represents the rate at which a country's debt is growing, then the increase in its debt between 1980 and 1985 is given byA)
B)
C)
D)
E)
Unlock Deck
Unlock for access to all 93 flashcards in this deck.
Unlock Deck
k this deck
77
The marginal cost function of producing a particular product is given by , where q is the number of items produced. If the fixed costs are $4000 and the items are sold for $700 each, what is the break even point?
, where q is the number of items produced. If the fixed costs are $4000 and the items are sold for $700 each, what is the break even point? Unlock Deck
Unlock for access to all 93 flashcards in this deck.
Unlock Deck
k this deck
78
Suppose and . Use a calculator to calculate .
and . Use a calculator to calculate . Unlock Deck
Unlock for access to all 93 flashcards in this deck.
Unlock Deck
k this deck
79
Water is flowing into a container at an increasing rate, as shown in the following table. Give a lower estimate for the total number of gallons of water in the container after 30 minutes.
Unlock Deck
Unlock for access to all 93 flashcards in this deck.
Unlock Deck
k this deck
80
Use the following figure to find the value of
Unlock Deck
Unlock for access to all 93 flashcards in this deck.
Unlock Deck
k this deck
Unlock Deck
Unlock for access to all 93 flashcards in this deck.


