Exam 5: Accumulated Change: the Definite Integral
Exam 1: Functions and Change204 Questions
Exam 2: Rate of Change: the Derivative132 Questions
Exam 3: Shortcuts to Differentiation178 Questions
Exam 4: Using the Derivative94 Questions
Exam 5: Accumulated Change: the Definite Integral93 Questions
Exam 6: Antiderivatives and Applications122 Questions
Exam 7: Probability68 Questions
Exam 8: Functions of Several Variables134 Questions
Exam 9: Mathematical Modeling Using Differential Equations121 Questions
Exam 10: Geometric Series65 Questions
Select questions type
The upper half of the ellipse below has equation  . Find the area in the first quadrant between the ellipse and the line
  . Give your answer to two decimal places.
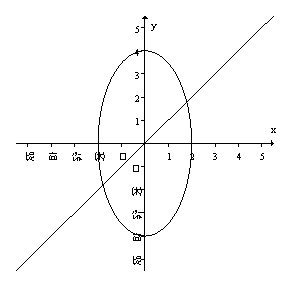
Free
(Multiple Choice)
4.8/5  (35)
(35)
Correct Answer: Verified
A
After a foreign substance is introduced into the blood, the rate at which antibodies are made is given by  thousands of antibodies per minute, where time t is measured in minutes and
  . If there are no antibodies in the blood at t = 0, how many antibodies are there after 5 minutes? Round to the nearest whole number.
Free
(Short Answer)
4.9/5 (31)
Correct Answer:Verified
1629
The flow rate of water in a mountain stream due to spring runoff is given in the following table. Give your best estimate (average of upper and lower limit) of how many cubic meters of water flowed through from 6:00 pm to midnight. 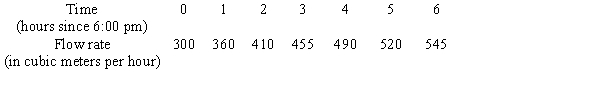
Free
(Short Answer)
4.8/5 (39)
Correct Answer:Verified
2657.5
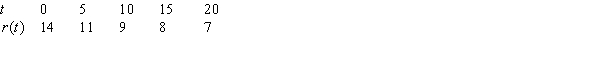
The following table gives the rate  , in cubic centimeters, that air is leaking from a balloon t seconds after it is inflated. Estimate
  .
. 
(Multiple Choice)
4.9/5 (36)
At time t, in seconds, your velocity, v, in meters per second, is given by  for
for  . Use
. Use  to estimate how many meters you traveled during this time.
(Short Answer)
4.7/5 (35)
The rate of growth of the net worth of a company is given by  dollars per year t years after its formation in 1990. How much did it increase in value between 1990 and 2005?
(Short Answer)
4.8/5 (35)
The graph below shows a marginal cost function,  $ per item. If the fixed cost is $900, estimate the total cost of producing 250 items.
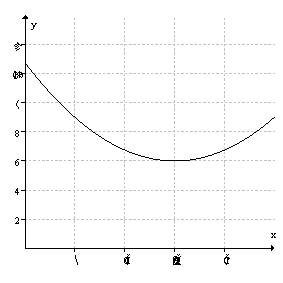
(Multiple Choice)
4.7/5 (34)
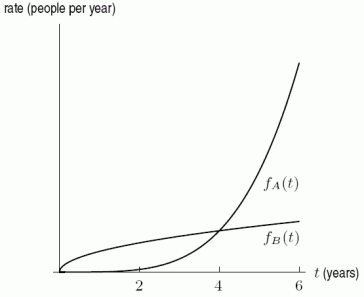
The following figure shows the rate of growth of two cities, with  being the growth of City A after t years and
  being the growth of City B after t years. If the two cities have the same population at t = 0, arrange the following values in order from smallest to largest by placing a "1" by the smallest, a "2" by the next smallest, and so forth.
A.
being the growth of City B after t years. If the two cities have the same population at t = 0, arrange the following values in order from smallest to largest by placing a "1" by the smallest, a "2" by the next smallest, and so forth.
A.  B.
B.  C.
C.  D.
D. 
(Short Answer)
4.9/5 (35)
The rate of pollution pouring into a lake is measured every 10 days, with results in the following table. About how many tons of pollution have entered the lake during the first 40 days? 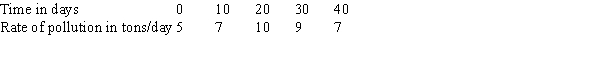
(Short Answer)
4.9/5 (39)
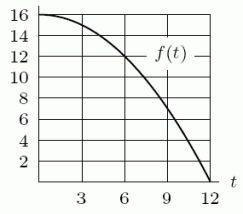
Using the following figure, calculate the value of the right-hand Riemann sum for the function f on the interval  using
using  .
. 
(Short Answer)
4.7/5 (36)
Use a calculator to evaluate  . Round your answer to 2 decimal places.
(Short Answer)
4.9/5 (39)
The following figure shows the graph of the velocity, v, of an object (in meters/sec). If the graph were shifted up 4 units, how would the distance traveled between t = 0 and t = 6 change? 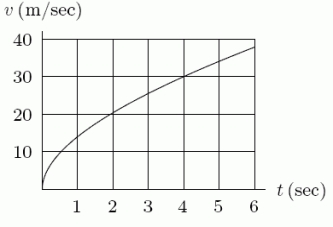
(Multiple Choice)
4.9/5 (39)
If  and f is continuous, then f must have at least one zero between a and b (assume
  ).
).
(True/False)
4.8/5 (41)
Consider a sports car which accelerates from 0 ft/sec to 85 ft/sec in 5 seconds (85 ft/sec = 58 mph). The car's velocity is given in the following table. What is the lower bound for the number of feet the car travels in 5 seconds? 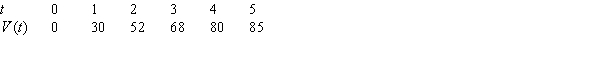
(Short Answer)
4.9/5 (29)
The graph below shows the velocity of an object (in meters/second). Find an upper bound for the number of meters traveled from t = 1 to t = 5 seconds. 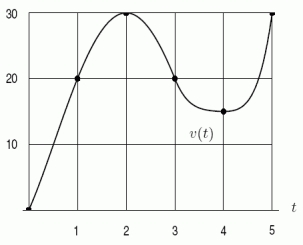
(Short Answer)
4.9/5 (29)
The marginal cost function of producing a particular product is given by  , where q is the number of items produced. If the fixed costs are $4000 and the items are sold for $700 each, what is the break even point?
(Short Answer)
4.8/5 (33)
Consider the graph of the function  shown in the following figure.
A. Approximate
shown in the following figure.
A. Approximate  by using a right-hand sum with 3 subdivisions. Round to 2 decimal places.
B. Is your answer to part (A) a lower or an upper estimate?
by using a right-hand sum with 3 subdivisions. Round to 2 decimal places.
B. Is your answer to part (A) a lower or an upper estimate? 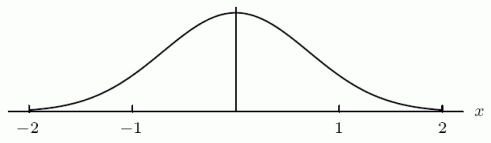
(Short Answer)
4.9/5 (36)
The following figure shows the rate of change of enrollment for a community college. Estimate the total change in enrollment over the first 6 years. 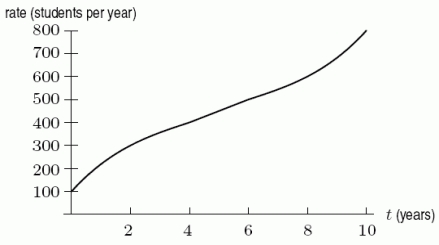
(Multiple Choice)
4.8/5 (34)
Filters
- Essay(0)
- Multiple Choice(0)
- Short Answer(0)
- True False(0)
- Matching(0)