Deck 20: The Written Research Report
Full screen (f)
Question
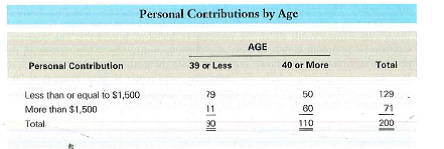
A social organization was interested in determining if there were various demographic characteristics that might be related to people's propensity to contribute to charities. The organization was particularly interested in determining if individuals 40 years of age or over were more likely to contribute larger amounts than individuals under 40. The average contribution in the population was $1,500, and this figure was used to form two groups based on a median-split. The following table presents a two-way classification of the number of individuals by contributions and age.
Does the amount of personal contributions depend on age Generate a table for a report that communicates the relevant information.
Does the amount of personal contributions depend on age Generate a table for a report that communicates the relevant information.
Question
Question
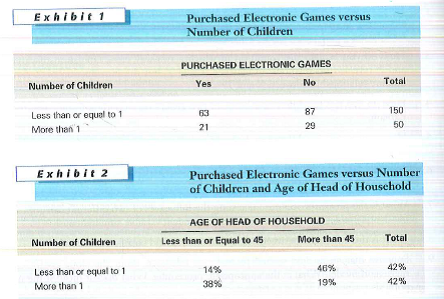
A large toy manufacturer wants to determine the characteristics of families who have purchased a new electronic game that is designed and marketed for all age groups. Management needs your assistance in interpreting the cross-tab tables in Exhibits 1 and 2.
a. What does Exhibit 1 indicate Explain and show calculations where necessary.
b. What does Exhibit 2 indicate Have your conclusions changed or remained the same Explain.
a. What does Exhibit 1 indicate Explain and show calculations where necessary.
b. What does Exhibit 2 indicate Have your conclusions changed or remained the same Explain.
Question
Question
Plaza AutoMall is a medium-sized automobile dealership located in a small city in the southeastern United States. The dealership sells and services new and pre-owned automobiles. In recent months, revenues from the automotive servicing side of the business have been flat, while revenues from new car sales have been rising. The owner suspects that part of the service and repair business may have shifted to a new auto repair shop that opened about a year ago on the other side of town. The new repair shop is much more conveniently located for consumers who live on that side of town. To better understand the perceptions and behaviors of the dealership's customer base (i.e., those who had purchased a car from the dealership) regarding auto servicing, the owner brought in a team of researchers. The researchers developed a mail questionnaire that asked respondents the percentage of times they use Plaza AutoMall for auto repairs (assessed on a 0% to 100% scale). The researchers also coded the return envelopes so that they could deter-mine in which section of town the respondent resides (the city can easily be divided into three well-defined areas, which the researchers coded A, B, and C). The questionnaire was sent to a random sample of the dealership's customer base. Mean scores on the de-pendent variable were as follows: region A (where the dealership is located) = 93; region B = 82; and region C (where the competing auto repair shop is located) = 70. The researchers utilized the analysis of variance technique to determine if the difference in these means is statistically significant, producing the following ANOVA table:
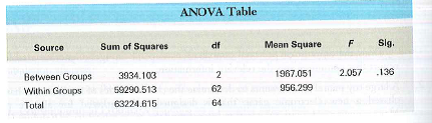
a. Assuming = 0.05, can the researchers reject the null hypothesis of no difference across groups Why or why not
b. Suppose that the researchers were willing to change the level of significance to = 0.15; would your answer to part (a) change What would be the consequences for Type Ierror Explain.
a. Assuming = 0.05, can the researchers reject the null hypothesis of no difference across groups Why or why not
b. Suppose that the researchers were willing to change the level of significance to = 0.15; would your answer to part (a) change What would be the consequences for Type Ierror Explain.
Question
Question
The researchers working with Plaza AutoMall decided to take a closer look at the data. In addition to information about the region where the respondent was located (see Problem 3), they also knew whether or not the respondent had purchased a new or pre-owned car from Plaza. Mean scores (representing the percentage of times the respondent uses the dealership for auto repairs, assessed on a 0% to 100% scale) broken down by region and type of car are as follows:
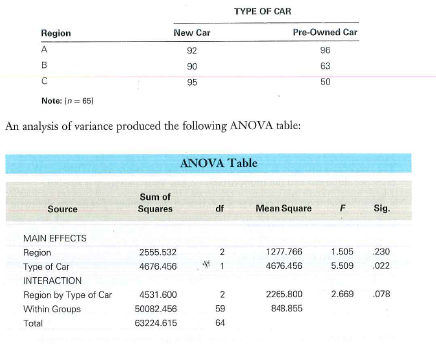
a. Examine closely the mean scores reported above for the six combinations of region and type of car. Based on these results, does it appear that there is a relationship between region and the proportion of times owners take their cars to Plaza for repair If so, what is the nature of this relationship
b. Explain the ANOVA table. What can you conclude about the effects of region and type of car on the proportion of times owners take their cars to Plaza for repair
Question
Question
Question
Crystallo Bottling Company, which provides plastic bottles to various soft drink manufacturers, his the following information pertaining to the number of cases per shipment and the corresponding transportation costs:
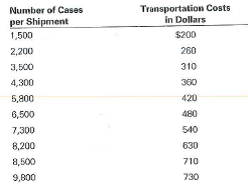
The marketing manager is interested in studying the relationship between the number of cases per shipment and the transportation costs. Your assistance is needed.
a. Plot the transportation costs as a function of the number of cases per shipment.
b. Interpret the scatter diagram.
c. Using a statistical software package, enter the data and calculate the Pearson product-moment correlation coefficient.
d. Does it appear that there is a relationship` between number of cases and transportation costs Explain.
Question
The marketing manager at Crystallo Bottling Company is studying the relationship between number of cases per shipment and transportation costs. An analysis of the data from the previous problem produced the following simple regression output:
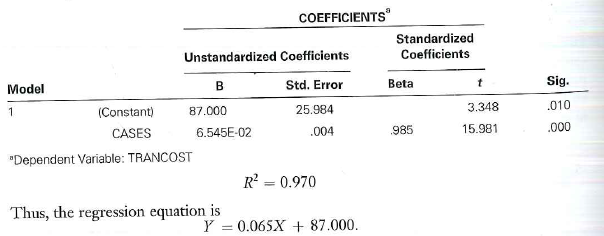
a. What is the interpretation of the slope coefficient
b. Does it appear that number of cases per shipment influences transportation cost
c. If so, how strong is the relationship between the variables
a. What is the interpretation of the slope coefficient
b. Does it appear that number of cases per shipment influences transportation cost
c. If so, how strong is the relationship between the variables
Question

Unlock Deck
Sign up to unlock the cards in this deck!
Unlock Deck
Unlock Deck
1/12
Play
Full screen (f)
Deck 20: The Written Research Report
1
A social organization was interested in determining if there were various demographic characteristics that might be related to people's propensity to contribute to charities. The organization was particularly interested in determining if individuals 40 years of age or over were more likely to contribute larger amounts than individuals under 40. The average contribution in the population was $1,500, and this figure was used to form two groups based on a median-split. The following table presents a two-way classification of the number of individuals by contributions and age.
Does the amount of personal contributions depend on age Generate a table for a report that communicates the relevant information.
Does the amount of personal contributions depend on age Generate a table for a report that communicates the relevant information.
Cross Tabulation:
It is a multivariate method which is used in order to study the association between any two or more than two categorical variables.
Consider that a societal organization had been interested in shaping if there had been various demographic characteristic that might be related to people's tendency in order to contribute to charities. Further, the organization was especially interested in finding out whether the individuals of 40 years of age or over had been more likely to contribute the larger amount than individual under 40. In this situation, column percentages can give an idea about their contribution. The calculation for column percentages is as follows:
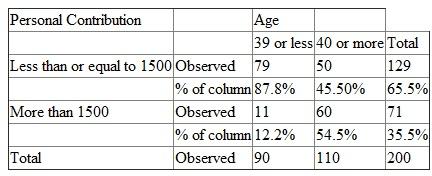 It is clear from the table that personal contributions depend on age as 55% of individuals of age 40 or more are contributing to $1,500 or more to the personal contributions.
It is a multivariate method which is used in order to study the association between any two or more than two categorical variables.
Consider that a societal organization had been interested in shaping if there had been various demographic characteristic that might be related to people's tendency in order to contribute to charities. Further, the organization was especially interested in finding out whether the individuals of 40 years of age or over had been more likely to contribute the larger amount than individual under 40. In this situation, column percentages can give an idea about their contribution. The calculation for column percentages is as follows:
It is clear from the table that personal contributions depend on age as 55% of individuals of age 40 or more are contributing to $1,500 or more to the personal contributions. 2
What is the proper procedure for investigating the following hypotheses using cross-tabulation analysis
a. Consumption of Product X depends on a person's income.
b. Consumption of Product X depends on a person's education.
a. Consumption of Product X depends on a person's income.
b. Consumption of Product X depends on a person's education.
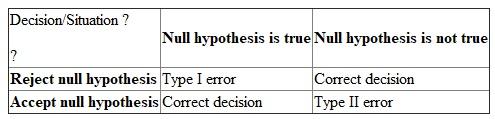
Cross Tabulation: This is a multivariate method used for studying the relationship between any two or more than two categorical variables. The method considers the joint distribution of the sample elements across the variables. In Cross Tabulation, the investigation of the influence of one variable (the independent variable) on another variable (the dependent variable) is performed.Hypothesis: A hypothesis is a base of any research study which should be developed with deep thought and understanding. It is helpful in determining the information to be sought in such a way that it specifies whether what type of relationship is to be investigated between different variables. It affects the question and the response form which is used in order to collect the information.Let T be the test statistic and let C be the critical value so that the decision criteria is to reject null hypothesis when
 . There are 4 possible consequences that will occur while making the decisions based on the test statistic and the defined critical region. The decisions are written in the below tabular form:
 The p -value:
It is the probability of observing a result at least as extreme as the measured result if the null hypothesis is true.a.Here in this situation, Pearson chi-square test of independence is applied. Let's consider the below hypothesis test:
Null Hypothesis: The consumption of Product X is not dependent on person's income (Y).Alternative Hypothesis: The consumption of Product X is dependent on person's income (Y).Then, by using the chi-square test, the test statistic is computed and compared with critical value. If the value of the test statistic is more than the critical value, then reject the null hypothesis.b.Here in this situation, Pearson chi-square test of independence is applied. Let's consider the following hypothesis test:
Null Hypothesis: The consumption of Product X is not dependent on person's Education.
Alternative Hypothesis: The consumption of Product X is dependent on person's Education.
Then, by using the chi-square test, the test statistic is computed and compared with critical value. If the value of the test statistic is more than the critical value, then reject the null hypothesis.
. There are 4 possible consequences that will occur while making the decisions based on the test statistic and the defined critical region. The decisions are written in the below tabular form: The p -value: It is the probability of observing a result at least as extreme as the measured result if the null hypothesis is true.a.Here in this situation, Pearson chi-square test of independence is applied. Let's consider the below hypothesis test:
Null Hypothesis: The consumption of Product X is not dependent on person's income (Y).Alternative Hypothesis: The consumption of Product X is dependent on person's income (Y).Then, by using the chi-square test, the test statistic is computed and compared with critical value. If the value of the test statistic is more than the critical value, then reject the null hypothesis.b.Here in this situation, Pearson chi-square test of independence is applied. Let's consider the following hypothesis test:
Null Hypothesis: The consumption of Product X is not dependent on person's Education.
Alternative Hypothesis: The consumption of Product X is dependent on person's Education.
Then, by using the chi-square test, the test statistic is computed and compared with critical value. If the value of the test statistic is more than the critical value, then reject the null hypothesis.
3
A large toy manufacturer wants to determine the characteristics of families who have purchased a new electronic game that is designed and marketed for all age groups. Management needs your assistance in interpreting the cross-tab tables in Exhibits 1 and 2.
a. What does Exhibit 1 indicate Explain and show calculations where necessary.
b. What does Exhibit 2 indicate Have your conclusions changed or remained the same Explain.
a. What does Exhibit 1 indicate Explain and show calculations where necessary.
b. What does Exhibit 2 indicate Have your conclusions changed or remained the same Explain.
Cross Tabulation
An approach that is used for studying the association between two or more than two categorical variables is called cross tabulation. It is a multivariate method.a.Consider that a large toy manufacturer was interested in decisive the characteristic of families who bought a new electrical game that is intended and marked for all age groups. Here, the number of children is key factor hence the row percentage is considered based on Exhibit 1. The calculation for row percentages is as shown in the below table:
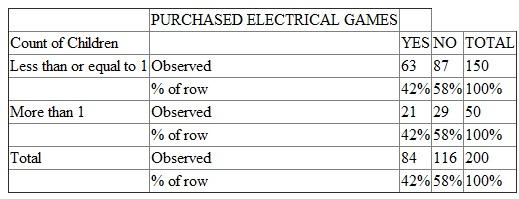 The above table illustrates that the purchasing of electronic games is independent of the number of children.b.Consider the exhibit 2 as shown below:
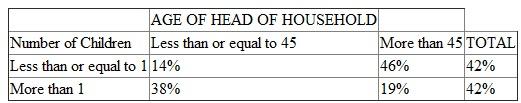 From above exhibit it can be observed that the purchase of electronic game is depending on the count of children when the age of head of household is considered. When the age of head of household is less than or equal to 45 then number of children purchasing electronic games is higher than when the age of head of family is more than 45. Thus, our conclusion changed vividly when a third variable age of head of household is introduced.
An approach that is used for studying the association between two or more than two categorical variables is called cross tabulation. It is a multivariate method.a.Consider that a large toy manufacturer was interested in decisive the characteristic of families who bought a new electrical game that is intended and marked for all age groups. Here, the number of children is key factor hence the row percentage is considered based on Exhibit 1. The calculation for row percentages is as shown in the below table:
The above table illustrates that the purchasing of electronic games is independent of the number of children.b.Consider the exhibit 2 as shown below: From above exhibit it can be observed that the purchase of electronic game is depending on the count of children when the age of head of household is considered. When the age of head of household is less than or equal to 45 then number of children purchasing electronic games is higher than when the age of head of family is more than 45. Thus, our conclusion changed vividly when a third variable age of head of household is introduced. 4
Illustrate the procedure from Question 1 with data of your own choosing; that is, develop the tables, fill in the assumed numbers, and indicate the conclusions to be drawn from each table.
(Reference Question 1)
What is the proper procedure for investigating the following hypotheses using cross-tabulation analysis
a. Consumption of Product X depends on a person's income.
b. Consumption of Product X depends on a person's education.
(Reference Question 1)
What is the proper procedure for investigating the following hypotheses using cross-tabulation analysis
a. Consumption of Product X depends on a person's income.
b. Consumption of Product X depends on a person's education.
Unlock Deck
Unlock for access to all 12 flashcards in this deck.
Unlock Deck
k this deck
5
Plaza AutoMall is a medium-sized automobile dealership located in a small city in the southeastern United States. The dealership sells and services new and pre-owned automobiles. In recent months, revenues from the automotive servicing side of the business have been flat, while revenues from new car sales have been rising. The owner suspects that part of the service and repair business may have shifted to a new auto repair shop that opened about a year ago on the other side of town. The new repair shop is much more conveniently located for consumers who live on that side of town. To better understand the perceptions and behaviors of the dealership's customer base (i.e., those who had purchased a car from the dealership) regarding auto servicing, the owner brought in a team of researchers. The researchers developed a mail questionnaire that asked respondents the percentage of times they use Plaza AutoMall for auto repairs (assessed on a 0% to 100% scale). The researchers also coded the return envelopes so that they could deter-mine in which section of town the respondent resides (the city can easily be divided into three well-defined areas, which the researchers coded A, B, and C). The questionnaire was sent to a random sample of the dealership's customer base. Mean scores on the de-pendent variable were as follows: region A (where the dealership is located) = 93; region B = 82; and region C (where the competing auto repair shop is located) = 70. The researchers utilized the analysis of variance technique to determine if the difference in these means is statistically significant, producing the following ANOVA table:
a. Assuming = 0.05, can the researchers reject the null hypothesis of no difference across groups Why or why not
b. Suppose that the researchers were willing to change the level of significance to = 0.15; would your answer to part (a) change What would be the consequences for Type Ierror Explain.
a. Assuming = 0.05, can the researchers reject the null hypothesis of no difference across groups Why or why not
b. Suppose that the researchers were willing to change the level of significance to = 0.15; would your answer to part (a) change What would be the consequences for Type Ierror Explain.
Unlock Deck
Unlock for access to all 12 flashcards in this deck.
Unlock Deck
k this deck
6
How do you explain the condition in which a two-way cross tabulation of variables X and Y revealed no relationship between X and Y, but the introduction of Z revealed a definite relationship between X and Y
Unlock Deck
Unlock for access to all 12 flashcards in this deck.
Unlock Deck
k this deck
7
The researchers working with Plaza AutoMall decided to take a closer look at the data. In addition to information about the region where the respondent was located (see Problem 3), they also knew whether or not the respondent had purchased a new or pre-owned car from Plaza. Mean scores (representing the percentage of times the respondent uses the dealership for auto repairs, assessed on a 0% to 100% scale) broken down by region and type of car are as follows:
a. Examine closely the mean scores reported above for the six combinations of region and type of car. Based on these results, does it appear that there is a relationship between region and the proportion of times owners take their cars to Plaza for repair If so, what is the nature of this relationship
b. Explain the ANOVA table. What can you conclude about the effects of region and type of car on the proportion of times owners take their cars to Plaza for repair
Unlock Deck
Unlock for access to all 12 flashcards in this deck.
Unlock Deck
k this deck
8
How do you test for differences between two groups on a continuous outcome measure Explain.
Unlock Deck
Unlock for access to all 12 flashcards in this deck.
Unlock Deck
k this deck
9
The chancellor of Enormous State University (ESU) has decided that ESU needs to develop a new marketing plan in order to attract the best students. The objective is to attract students who will have the best chance of graduating within four years of their matriculation. The administration has assigned you, the associate vice chancellor, the responsibility for carrying out this project. You have decided that, as part of the research to be performed in designing the new marketing plan, it would be helpful to know what, if any, characteristics possessed by high school seniors are associated with success in college. You decide that a multiple regression approach seems to be the way to proceed. Your task is simplified by the existence of a large, comprehensive database that contains the results of several broad-based surveys of high school seniors, many of whom later attended ESU. However, you know that simply mining the database is not likely to be much help. Accordingly, your first task is to develop a theory of why students succeed in college. After explaining your theory, specify the dependent variable and predictor variables that you will use in the regression equation. How serious a problem is muilticollinearity in the data likely to be, given your objective
Unlock Deck
Unlock for access to all 12 flashcards in this deck.
Unlock Deck
k this deck
10
Crystallo Bottling Company, which provides plastic bottles to various soft drink manufacturers, his the following information pertaining to the number of cases per shipment and the corresponding transportation costs:
The marketing manager is interested in studying the relationship between the number of cases per shipment and the transportation costs. Your assistance is needed.
a. Plot the transportation costs as a function of the number of cases per shipment.
b. Interpret the scatter diagram.
c. Using a statistical software package, enter the data and calculate the Pearson product-moment correlation coefficient.
d. Does it appear that there is a relationship` between number of cases and transportation costs Explain.
Unlock Deck
Unlock for access to all 12 flashcards in this deck.
Unlock Deck
k this deck
11
The marketing manager at Crystallo Bottling Company is studying the relationship between number of cases per shipment and transportation costs. An analysis of the data from the previous problem produced the following simple regression output:
a. What is the interpretation of the slope coefficient
b. Does it appear that number of cases per shipment influences transportation cost
c. If so, how strong is the relationship between the variables
a. What is the interpretation of the slope coefficient
b. Does it appear that number of cases per shipment influences transportation cost
c. If so, how strong is the relationship between the variables
Unlock Deck
Unlock for access to all 12 flashcards in this deck.
Unlock Deck
k this deck
12
The marketing manager of Crystallo Bottling Company is considering multiple regression analysis with the number of cartons per shipment and the size of cartons as predictor variables and transportation costs as the dependent variable (refer to the previous two problems). He has devised the following regression equation:
Y = 23.95 X 1 + 24.44 X 2 - 41.44
Where X 1 is the number of cartons per shipment and X 2 is the size of the cartons.
a. Interpret each of the values in the regression equation.
b. Is multiple regression appropriate in this situation If yes, why If no, why not
Use the AFC member survey (Figure 18.1), codebook (Figure 18.3), and data to perform the analyses in Problems 9 through 15. The data are available in raw form ("AFC.txt") or as an SPSS data file ("AFC.sav") at www.cengage.com/marketing/churchill.
Unlock Deck
Unlock for access to all 12 flashcards in this deck.
Unlock Deck
k this deck
Unlock Deck
Unlock for access to all 12 flashcards in this deck.


