Deck 14: Analysis of Categorical Data
Full screen (f)
Question
Question
Question
Suppose you wish to test the null hypothesis that three binomial parameters  ,
,  , and
, and  are equal versus the alternative hypothesis that at least two of the parameters differ. Independent random samples of 100 observations were selected from each of the populations. The data are shown in the table:
 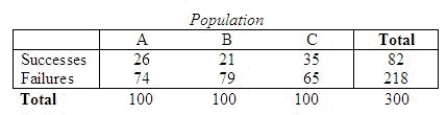 Write the null and alternative hypotheses for testing the equality of the three binomial proportions.
  :
:  ______________
Test statistic: = ______________
What is the p-value?
______________
______________ .
.
There is ______________ sufficient evidence to indicate that the proportions depend upon the population from which they were drawn.
, , and are equal versus the alternative hypothesis that at least two of the parameters differ. Independent random samples of 100 observations were selected from each of the populations. The data are shown in the table: Write the null and alternative hypotheses for testing the equality of the three binomial proportions. : ______________Test statistic:
= ______________What is the p-value?
______________
______________
.There is ______________ sufficient evidence to indicate that the proportions depend upon the population from which they were drawn.
Question
If we want to perform a two-tail test for differences between two populations of nominal data with exactly two categories, we can employ either the z-test of  , or the chi-square test of homogeneity, since squaring the value of the z statistic yields the value of
  statistics.
, or the chi-square test of homogeneity, since squaring the value of the z statistic yields the value of statistics. Question
Question
Question
A study of the purchase decisions of three stock portfolio managers, A, B, C, was conducted to compare the numbers of stock purchases that resulted in profits over a time period less than or equal to 1 year. One hundred randomly selected purchases were examined for each of the managers. 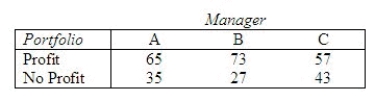 Do the data provide evidence of differences among the rates of successful purchases for the three managers?
Compute = ______________
The p-value is ______________.
Conclude that there ______________ enough information to conclude that the proportion of successful purchases will differ among the managers.
Do the data provide evidence of differences among the rates of successful purchases for the three managers?Compute
= ______________The p-value is ______________.
Conclude that there ______________ enough information to conclude that the proportion of successful purchases will differ among the managers.
Question
Question
Question
Question
Question
The following table shows the results of a study in which random samples of 200 members of each of five large unions were asked whether they are for, undecided, or against a certain piece of legislation. 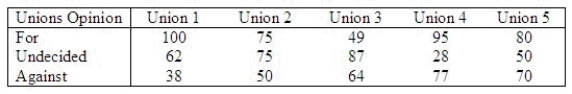 Use the 0.025 level of significance to test whether the unions differ with respect to their views.
Compute = ______________
Reject when
when  > ______________.
Conclude:
The unions ______________ different views.
Use the 0.025 level of significance to test whether the unions differ with respect to their views.Compute
= ______________Reject
when > ______________.Conclude:
The unions ______________ different views.
Question
Question
Question
The data that result from two binomial experiment can be displayed as a two-way classification with 2 rows and 2 columns, so that the chi-square test of homogeneity can be used to compare the two binomial proportions  and
and  .
.
and . Question
The goodness-of-fit test is a two-way classification will cell probabilities specified in  .
.
. Question
Question
Question
Question
Question
Chi-square tests of independence are always lower-tailed because a perfect fit between  and
and  makes
makes  equal to zero.
and makes equal to zero. Question
Question
In a chi-square test of independence, the value of the test statistic was  15.652, and the critical value at
  was 11.1433. Thus, we must reject the null hypothesis at
  .
.
15.652, and the critical value at was 11.1433. Thus, we must reject the null hypothesis at . Question
Question
Question
Question
Question
Question
Question
Question
Question
Question
Question
Question
Question
In a typical chi-square test of independence, we calculate each expected cell frequency (  ) as the product of row total (
  ) times column total (
  ) times sample size (n).
) as the product of row total ( ) times column total ( ) times sample size (n). Question
Question
Question
Chi-square tests of independence are always lower-tailed because a perfect fit between  and
and  makes the test statistic
  equal to zero.
and makes the test statistic equal to zero. Question
Question
Question
In a chi-square test of independence, the value of the test statistic was  = 9.572, and the critical value at
  was 11.1433. Thus,
A) we fail to reject the null hypothesis at
B) we reject the null hypothesis at
C) we don't have enough evidence to accept or reject the null hypothesis at
D) we should decrease the level of significance in order to reject the null hypothesis
E) none of these
= 9.572, and the critical value at was 11.1433. Thus,A) we fail to reject the null hypothesis at
B) we reject the null hypothesis at
C) we don't have enough evidence to accept or reject the null hypothesis at
D) we should decrease the level of significance in order to reject the null hypothesis
E) none of these
Question
Question
A market research study was conducted to compare three different brands of car oil. The results of the study are summarized below. 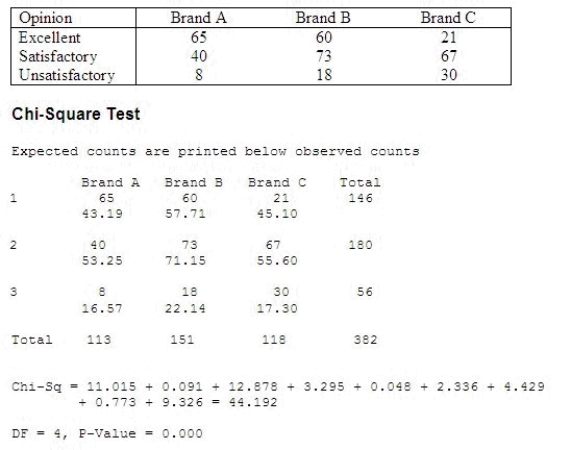 Use the accompanying MINITAB output and
  = 0.005 to determine whether the brand of oil is independent of opinion.
Compute = ______________
Reject when
when  > ______________.
Conclude that the two variables are ______________.
Use the accompanying MINITAB output and = 0.005 to determine whether the brand of oil is independent of opinion.Compute
= ______________Reject
when > ______________.Conclude that the two variables are ______________.
Question
Question
Question
Question
Question
Question
A pollster was interested in determining whether three television dramas are equally preferable among men and women. The following data was recorded: 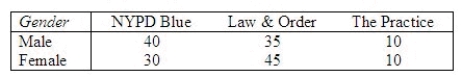 Compute
  = ______________
Reject when
when  > ______________.
Conclude that the preference of television drama is ______________ the viewer's gender.
Compute = ______________Reject
when > ______________.Conclude that the preference of television drama is ______________ the viewer's gender.
Question
Question
Question
The owner of Fit Forever Health Club is considering adding an indoor swimming pool to his facility. The manager decided to take a survey to determine whether member opinion about the addition of a pool was independent of the age of the member. Two hundred members were selected at random and asked to state their opinion. The following data was recorded: 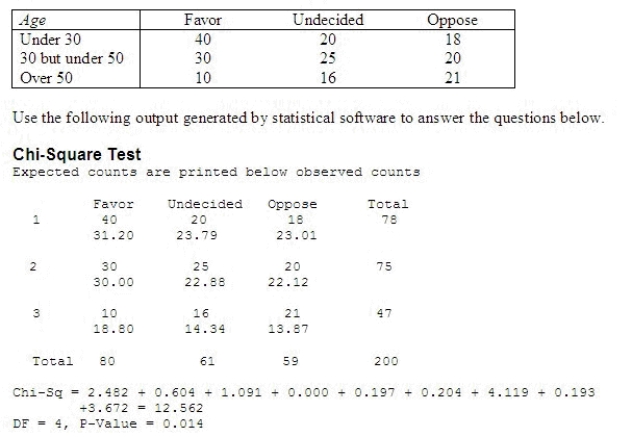 What is
  ?
?
______________
What is the p-value associated with the test?
______________
Conclude that member's opinion concerning the addition of an indoor pool is ______________ the member's age.
What is ?______________
What is the p-value associated with the test?
______________
Conclude that member's opinion concerning the addition of an indoor pool is ______________ the member's age.
Question
Question
Question
Question
Question
Question
Question
Question
A sport preference poll showed the following data for men and women: 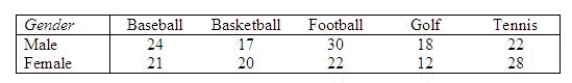 Use the 5% level of significance and test to determine whether sport preferences depend on gender.
  = ______________
Critical Value = ______________
Conclusion: ______________
Sport preferences ______________ on gender.
Use the 5% level of significance and test to determine whether sport preferences depend on gender. = ______________Critical Value = ______________
Conclusion: ______________
Sport preferences ______________ on gender.
Question
Is there a difference in the spending patterns of high school seniors depending on their gender? A study to investigate this question focused on 196 employed high school seniors. Students were asked to classify the amount of their earnings that they spent on their car during a given month: 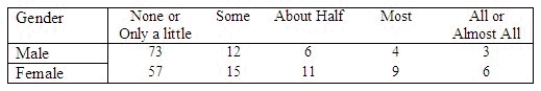 A portion of the Minitab printout is given here.
 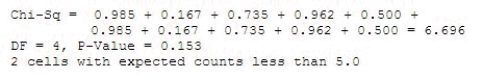 Use the printout to analyze the relationship between spending patterns and gender.
What is ?
?
______________
What is the p-value?
______________
Conclude that there ______________ sufficient evidence to indicate a difference in spending patterns between males and females.
A portion of the Minitab printout is given here. Use the printout to analyze the relationship between spending patterns and gender.What is
?______________
What is the p-value?
______________
Conclude that there ______________ sufficient evidence to indicate a difference in spending patterns between males and females.
Question
Question
The number of Americans who visit fast-food restaurants regularly has grown steadily over the last decade. For this reason, marketing experts are interested in the demographics of fast-food customers. Is a customer's preference for a fast- food chain affected by the age of the customer? If so, advertising might need to target a particular age group. Suppose a random sample of 400 fast-food customers aged 16 and older was selected, and their favorite fast-food restaurants along with their age groups were recorded, as shown in the table: 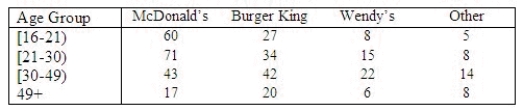 Use an appropriate method to determine whether or not a customer's fast-food preference is dependent on age.
Compute :
:
______________
What is the p-value?
______________
Conclude that there ______________ a dependence between age group and favorite fast food restaurant.
Write a short paragraph presenting your statistical conclusions and their practical implications for marketing experts.
________________________________________________________
Use an appropriate method to determine whether or not a customer's fast-food preference is dependent on age.Compute
:______________
What is the p-value?
______________
Conclude that there ______________ a dependence between age group and favorite fast food restaurant.
Write a short paragraph presenting your statistical conclusions and their practical implications for marketing experts.
________________________________________________________
Question
A marketing research professor at Ferris State University conducted a survey to determine whether mode of transportation to the university and the person's position at the university were independent. The following data was recorded: 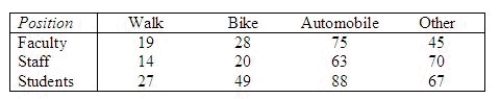 Perform the appropriate test of hypothesis using
  = 0.10.
Compute = ______________
Reject when
when  > ______________.
Conclude that the mode of transportation to the university and person's position at the university are ______________.
Perform the appropriate test of hypothesis using = 0.10.Compute
= ______________Reject
when > ______________.Conclude that the mode of transportation to the university and person's position at the university are ______________.
Question
Question
Question
A study of educational levels of 500 voters and their political party affiliations in a southern state in the USA showed the following results: 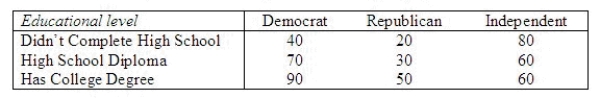 Use the 1% level of significance and test to see if party affiliation is independent of the educational level of the voters.
  = ______________
Critical Value = ______________
Conclusion: ______________
Political party affiliation ______________ on the educational level of the voters.
Use the 1% level of significance and test to see if party affiliation is independent of the educational level of the voters. = ______________Critical Value = ______________
Conclusion: ______________
Political party affiliation ______________ on the educational level of the voters.
Question
Question
An experiment was conducted to investigate the effect of general hospital experience on the attitudes of physicians toward lower-class people. A random sample of 50 physicians who had just completed 4 weeks of service in a general hospital were categorized according to their concern for lower-class people before and after their general hospital experience. The data are shown in the table. 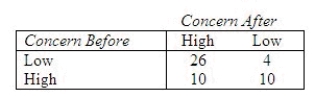 Do the data provide sufficient evidence to indicate a change in "concern" after the general hospital experience?
Compute = ______________
Give a range for the p-value. ______________
Conclude that there is ______________ enough evidence to indicate a change in concern due to the general hospital experience.
Do the data provide sufficient evidence to indicate a change in "concern" after the general hospital experience?Compute
= ______________Give a range for the p-value. ______________
Conclude that there is ______________ enough evidence to indicate a change in concern due to the general hospital experience.
Question
A large carpet store wishes to determine if the brand of carpet purchased is related to the purchaser's family income. As a sampling frame, they mailed a survey to people who have a store credit card. Five hundred customers returned the survey and the results follow: 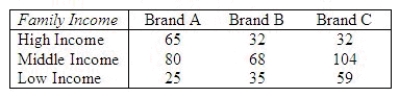 At the 5% level of significance, can you conclude that the brand of carpet purchased is related to the purchaser's family income?
Test statistic = ______________
Critical Value = ______________
Conclusion: ______________
We can conclude that the brand of carpet purchased ______________ related to the purchaser's family income.
At the 5% level of significance, can you conclude that the brand of carpet purchased is related to the purchaser's family income?Test statistic = ______________
Critical Value = ______________
Conclusion: ______________
We can conclude that the brand of carpet purchased ______________ related to the purchaser's family income.
Question
A major insurance firm interviewed a random sample of 1200 college students to find out the type of life insurance preferred, if any. The results follow: 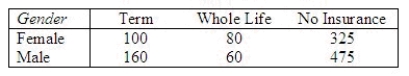 Is there evidence that life insurance preference of male students is different than that of female students? Test using the 5% level of significance.
Test statistic = ______________
Critical Value = ______________
Conclusion: ______________
Life insurance preference ______________ on gender.
Is there evidence that life insurance preference of male students is different than that of female students? Test using the 5% level of significance.Test statistic = ______________
Critical Value = ______________
Conclusion: ______________
Life insurance preference ______________ on gender.
Question
A survey of 500 respondents produced these cell counts in a 2  3 contingency table:
 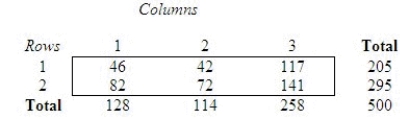 If you wish to test the null hypothesis of "independence" - that the probability that a response falls in any one row is independent of the column it falls in - and you plan to use a chi-square test, how many degrees of freedom will be associated with the
  statistic?
df = ______________
Compute : = ______________
Reject when
when  > ______________.
Conclude that there ______________ reason to expect a dependence between rows and columns.
Find the approximate p-value for the test.
The p-value ______________ .10
3 contingency table: If you wish to test the null hypothesis of "independence" - that the probability that a response falls in any one row is independent of the column it falls in - and you plan to use a chi-square test, how many degrees of freedom will be associated with the statistic?df = ______________
Compute
: = ______________Reject
when > ______________.Conclude that there ______________ reason to expect a dependence between rows and columns.
Find the approximate p-value for the test.
The p-value ______________ .10
Question
The personnel manager of a consumer products company asked a random sample of employees how they felt about the work they were doing. The following table gives a breakdown of their responses by age. 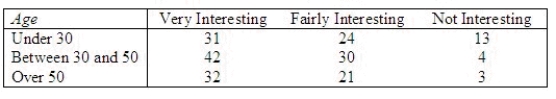 Is there sufficient evidence to conclude that the level of job satisfaction is related to age? Use
  = 0.10.
What is ?
?
______________
Critical Value = ______________
Conclusion: ______________
Job satisfaction ______________ related to age.
Is there sufficient evidence to conclude that the level of job satisfaction is related to age? Use = 0.10.What is
?______________
Critical Value = ______________
Conclusion: ______________
Job satisfaction ______________ related to age.
Question
Question
The personnel manager of a consumer product company asked a random sample of employees how they felt about the work they were doing. The following table gives a breakdown of their responses by gender. 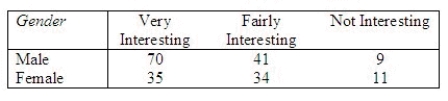 Do the data provide sufficient evidence to conclude that the level of job satisfaction is related to gender? Conduct the test at the 0.10 level of significance.
Test statistic = ______________
Critical Value(s) = ______________
Conclusion: ______________
The data provide ______________ evidence to conclude that the level of job satisfaction is related to gender.
Do the data provide sufficient evidence to conclude that the level of job satisfaction is related to gender? Conduct the test at the 0.10 level of significance.Test statistic = ______________
Critical Value(s) = ______________
Conclusion: ______________
The data provide ______________ evidence to conclude that the level of job satisfaction is related to gender.
Question
Question
Question
Question
A study was conducted to determine whether opinion concerning the addition of seat belts in school buses is independent of the population density in which a person resides. The following data was recorded: 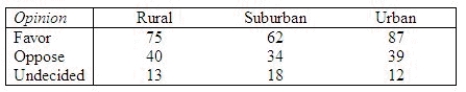 Use the following output generated using Minitab to answer the questions below.
 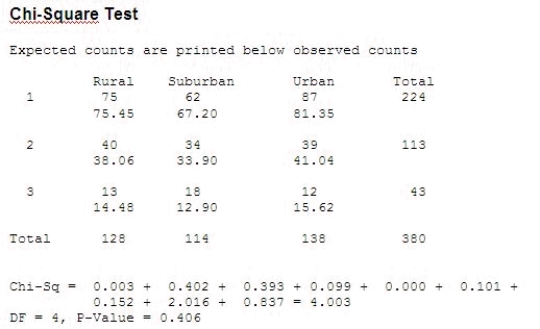 What is
  ?
?
______________
What is the p-value associated with the test?
______________
Conclude that opinion concerning the addition of seat belts to school buses is ______________ the population density where the person resides.
Use the following output generated using Minitab to answer the questions below. What is ?______________
What is the p-value associated with the test?
______________
Conclude that opinion concerning the addition of seat belts to school buses is ______________ the population density where the person resides.

Unlock Deck
Sign up to unlock the cards in this deck!
Unlock Deck
Unlock Deck
1/136
Play
Full screen (f)
Deck 14: Analysis of Categorical Data
1
All expected cell counts must equal ten in order that the chi-square approximation is valid.
False
2
The total degrees of freedom for an r x c (fixed-column) contingency table are rc + 1.
False
3
Suppose you wish to test the null hypothesis that three binomial parameters , , and are equal versus the alternative hypothesis that at least two of the parameters differ. Independent random samples of 100 observations were selected from each of the populations. The data are shown in the table: Write the null and alternative hypotheses for testing the equality of the three binomial proportions. : ______________
Test statistic: = ______________
What is the p-value?
______________
______________ .
There is ______________ sufficient evidence to indicate that the proportions depend upon the population from which they were drawn.
, , and are equal versus the alternative hypothesis that at least two of the parameters differ. Independent random samples of 100 observations were selected from each of the populations. The data are shown in the table: Write the null and alternative hypotheses for testing the equality of the three binomial proportions. : ______________Test statistic:
= ______________What is the p-value?
______________
______________
.There is ______________ sufficient evidence to indicate that the proportions depend upon the population from which they were drawn.
For all i,j; 5.0682; .0793; Do not reject; insufficient
4
If we want to perform a two-tail test for differences between two populations of nominal data with exactly two categories, we can employ either the z-test of , or the chi-square test of homogeneity, since squaring the value of the z statistic yields the value of statistics.
, or the chi-square test of homogeneity, since squaring the value of the z statistic yields the value of statistics. Unlock Deck
Unlock for access to all 136 flashcards in this deck.
Unlock Deck
k this deck
5
To be valid, the chi-square test requires that all expected frequencies equal:
A) 30 or more
B) 30 or less
C) 30 precisely
D) both 30 or more and 30 or less
E) none of these
A) 30 or more
B) 30 or less
C) 30 precisely
D) both 30 or more and 30 or less
E) none of these
Unlock Deck
Unlock for access to all 136 flashcards in this deck.
Unlock Deck
k this deck
6
When there are only 2 categories in a multinomial experiment, the experiment reduces to a binomial experiment.
Unlock Deck
Unlock for access to all 136 flashcards in this deck.
Unlock Deck
k this deck
7
A study of the purchase decisions of three stock portfolio managers, A, B, C, was conducted to compare the numbers of stock purchases that resulted in profits over a time period less than or equal to 1 year. One hundred randomly selected purchases were examined for each of the managers. Do the data provide evidence of differences among the rates of successful purchases for the three managers?
Compute = ______________
The p-value is ______________.
Conclude that there ______________ enough information to conclude that the proportion of successful purchases will differ among the managers.
Do the data provide evidence of differences among the rates of successful purchases for the three managers?Compute
= ______________The p-value is ______________.
Conclude that there ______________ enough information to conclude that the proportion of successful purchases will differ among the managers.
Unlock Deck
Unlock for access to all 136 flashcards in this deck.
Unlock Deck
k this deck
8
Numbers in a contingency table show the frequency of occurrence of all possible combinations of categories.
Unlock Deck
Unlock for access to all 136 flashcards in this deck.
Unlock Deck
k this deck
9
The large-sample z tests for one and two binomial proportions are special cases of the chi-square statistic.
Unlock Deck
Unlock for access to all 136 flashcards in this deck.
Unlock Deck
k this deck
10
If we want to conduct a two-tail test of a population proportion, we can employ:
A) z-test of a population proportion
B) the chi-square goodness-of-fit test since
C) the chi-square test of independence
D) z-test of a population proportion and the chi-square goodness-of-fit test since
E) z-test of a population proportion and the chi-square test of independence
A) z-test of a population proportion
B) the chi-square goodness-of-fit test since
C) the chi-square test of independence
D) z-test of a population proportion and the chi-square goodness-of-fit test since
E) z-test of a population proportion and the chi-square test of independence
Unlock Deck
Unlock for access to all 136 flashcards in this deck.
Unlock Deck
k this deck
11
The chi-square technique is a statistical technique for testing the alleged independence of two qualitative variables, making inferences about the relative sizes of more than two population proportions, and conducting goodness-of-fit tests to assess the plausibility that sample data come from a population that conforms to a specified probability distribution.
Unlock Deck
Unlock for access to all 136 flashcards in this deck.
Unlock Deck
k this deck
12
The following table shows the results of a study in which random samples of 200 members of each of five large unions were asked whether they are for, undecided, or against a certain piece of legislation. Use the 0.025 level of significance to test whether the unions differ with respect to their views.
Compute = ______________
Reject when > ______________.
Conclude:
The unions ______________ different views.
Use the 0.025 level of significance to test whether the unions differ with respect to their views.Compute
= ______________Reject
when > ______________.Conclude:
The unions ______________ different views.
Unlock Deck
Unlock for access to all 136 flashcards in this deck.
Unlock Deck
k this deck
13
When either the row or column totals in a contingency table are fixed, the test of independence of classifications becomes a test of the homogeneity of cell probabilities for several multinomial experiments.
Unlock Deck
Unlock for access to all 136 flashcards in this deck.
Unlock Deck
k this deck
14
Tests of homogeneity are used to compare several binomial populations.
Unlock Deck
Unlock for access to all 136 flashcards in this deck.
Unlock Deck
k this deck
15
The data that result from two binomial experiment can be displayed as a two-way classification with 2 rows and 2 columns, so that the chi-square test of homogeneity can be used to compare the two binomial proportions and .
and . Unlock Deck
Unlock for access to all 136 flashcards in this deck.
Unlock Deck
k this deck
16
The goodness-of-fit test is a two-way classification will cell probabilities specified in .
. Unlock Deck
Unlock for access to all 136 flashcards in this deck.
Unlock Deck
k this deck
17
The chi-square technique has numerous applications, including:
A) testing the alleged independence of two qualitative variables
B) making inferences about the relative sizes of more than two population proportions
C) conducting a goodness-of-fit-test to determine whether data are consistent with data drawn from a particular probability distribution
D) all of these
E) none of these
Unlock Deck
Unlock for access to all 136 flashcards in this deck.
Unlock Deck
k this deck
18
If there are more than two row categories in a contingency table with fixed c column totals, then the test of independence is equivalent to a test of the equality of c sets of multinomial proportions.
Unlock Deck
Unlock for access to all 136 flashcards in this deck.
Unlock Deck
k this deck
19
If we want to conduct a one-tail test of a population proportion, we can employ:
A) z-test of a population proportion
B) the chi-square goodness-of-fit test since
C) the chi-square test of independence
D) none of these
E) all of these
A) z-test of a population proportion
B) the chi-square goodness-of-fit test since
C) the chi-square test of independence
D) none of these
E) all of these
Unlock Deck
Unlock for access to all 136 flashcards in this deck.
Unlock Deck
k this deck
20
A contingency table classifies data with respect to two qualitative variables that are each divided into two or more categories.
Unlock Deck
Unlock for access to all 136 flashcards in this deck.
Unlock Deck
k this deck
21
Chi-square tests of independence are always lower-tailed because a perfect fit between and makes equal to zero.
and makes equal to zero. Unlock Deck
Unlock for access to all 136 flashcards in this deck.
Unlock Deck
k this deck
22
The chi-square test of a contingency table is used to determine if there is enough evidence to infer that two nominal variables are related, and to infer that differences exist among two or more populations of nominal variables.
Unlock Deck
Unlock for access to all 136 flashcards in this deck.
Unlock Deck
k this deck
23
In a chi-square test of independence, the value of the test statistic was 15.652, and the critical value at was 11.1433. Thus, we must reject the null hypothesis at .
15.652, and the critical value at was 11.1433. Thus, we must reject the null hypothesis at . Unlock Deck
Unlock for access to all 136 flashcards in this deck.
Unlock Deck
k this deck
24
A contingency table classifies data with respect to two qualitative variables that are each divided into two or more categories.
Unlock Deck
Unlock for access to all 136 flashcards in this deck.
Unlock Deck
k this deck
25
Numbers in a contingency table show the frequency of occurrence of all possible combinations of categories.
Unlock Deck
Unlock for access to all 136 flashcards in this deck.
Unlock Deck
k this deck
26
A chi-square test for independence is applied to a contingency table with 4 rows and 4 columns for two qualitative variables. The degrees of freedom for this test must be 9.
Unlock Deck
Unlock for access to all 136 flashcards in this deck.
Unlock Deck
k this deck
27
A contingency table classifies data according to two or more categories associated with each of two qualitative variables that are statistically independent of one another.
Unlock Deck
Unlock for access to all 136 flashcards in this deck.
Unlock Deck
k this deck
28
In a typical contingency-table test, we calculate each expected cell frequency as the product of row total times column total times sample size.
Unlock Deck
Unlock for access to all 136 flashcards in this deck.
Unlock Deck
k this deck
29
The degrees of freedom associated with a chi-square test of independence where data are summarized in a contingency table with r rows and c columns equal the number of rows times the number of columns in the table; that is, rc.
Unlock Deck
Unlock for access to all 136 flashcards in this deck.
Unlock Deck
k this deck
30
The chi-square test of independence is based upon three or more quantitative variables.
Unlock Deck
Unlock for access to all 136 flashcards in this deck.
Unlock Deck
k this deck
31
A chi-square test for independence with 6 degrees of freedom results in a test statistic of 13.25. Using the chi-square table, the most accurate statement that can be made about the p-value for this test is that p-value is greater than 0.025 but smaller than 0.05.
Unlock Deck
Unlock for access to all 136 flashcards in this deck.
Unlock Deck
k this deck
32
The degrees of freedom associated with a contingency-table test of independence equal the number of rows times the number of columns in the table.
Unlock Deck
Unlock for access to all 136 flashcards in this deck.
Unlock Deck
k this deck
33
A chi-square test for independence with 10 degrees of freedom results in a test statistic of 17.894. Using the chi-square table, the most accurate statement that can be made about the p-value for this test is that 0.05 < p-value < 0.10.
Unlock Deck
Unlock for access to all 136 flashcards in this deck.
Unlock Deck
k this deck
34
A chi-square test for independence is applied to a contingency table with 3 rows and 4 columns for two qualitative variables. The degrees of freedom for this test must be 12.
Unlock Deck
Unlock for access to all 136 flashcards in this deck.
Unlock Deck
k this deck
35
To be valid, a chi-square test of independence requires that each expected frequency equal 30 or more.
Unlock Deck
Unlock for access to all 136 flashcards in this deck.
Unlock Deck
k this deck
36
In a typical chi-square test of independence, we calculate each expected cell frequency ( ) as the product of row total ( ) times column total ( ) times sample size (n).
) as the product of row total ( ) times column total ( ) times sample size (n). Unlock Deck
Unlock for access to all 136 flashcards in this deck.
Unlock Deck
k this deck
37
A chi-square test for independence is applied to a contingency table with 3 rows and 5 columns for two qualitative variables. The degrees of freedom for this test is 8.
Unlock Deck
Unlock for access to all 136 flashcards in this deck.
Unlock Deck
k this deck
38
In a chi-square test of independence with 6 degrees of freedom and a level of significance of 0.05, the critical value from the chi-square table is 12.5916. The computed value of the test statistics is 11.264. This will lead us to reject the null hypothesis.
Unlock Deck
Unlock for access to all 136 flashcards in this deck.
Unlock Deck
k this deck
39
Chi-square tests of independence are always lower-tailed because a perfect fit between and makes the test statistic equal to zero.
and makes the test statistic equal to zero. Unlock Deck
Unlock for access to all 136 flashcards in this deck.
Unlock Deck
k this deck
40
To be valid, a chi-square test of independence requires that the expected frequency for each cell in the contingency table equal 10 or more.
Unlock Deck
Unlock for access to all 136 flashcards in this deck.
Unlock Deck
k this deck
41
Consider a cell in a contingency table. Given the cell's row total of 200, the cell's column total of 75, and a sample size of 1,000, the cell's expected frequency:
A) equals 10
B) equals 15
C) equals 20
D) equals 25
E) cannot possibly be determined without additional information
A) equals 10
B) equals 15
C) equals 20
D) equals 25
E) cannot possibly be determined without additional information
Unlock Deck
Unlock for access to all 136 flashcards in this deck.
Unlock Deck
k this deck
42
In a chi-square test of independence, the value of the test statistic was = 9.572, and the critical value at was 11.1433. Thus,
A) we fail to reject the null hypothesis at
B) we reject the null hypothesis at
C) we don't have enough evidence to accept or reject the null hypothesis at
D) we should decrease the level of significance in order to reject the null hypothesis
E) none of these
= 9.572, and the critical value at was 11.1433. Thus,A) we fail to reject the null hypothesis at
B) we reject the null hypothesis at
C) we don't have enough evidence to accept or reject the null hypothesis at
D) we should decrease the level of significance in order to reject the null hypothesis
E) none of these
Unlock Deck
Unlock for access to all 136 flashcards in this deck.
Unlock Deck
k this deck
43
The number of degrees of freedom for a contingency table with 6 rows and 6 columns is:
A) 36
B) 25
C) 12
D) 6
E) 0
A) 36
B) 25
C) 12
D) 6
E) 0
Unlock Deck
Unlock for access to all 136 flashcards in this deck.
Unlock Deck
k this deck
44
A market research study was conducted to compare three different brands of car oil. The results of the study are summarized below. Use the accompanying MINITAB output and = 0.005 to determine whether the brand of oil is independent of opinion.
Compute = ______________
Reject when > ______________.
Conclude that the two variables are ______________.
Use the accompanying MINITAB output and = 0.005 to determine whether the brand of oil is independent of opinion.Compute
= ______________Reject
when > ______________.Conclude that the two variables are ______________.
Unlock Deck
Unlock for access to all 136 flashcards in this deck.
Unlock Deck
k this deck
45
The president of a state university collected data from students concerning building a new library, and classified the responses into different categories (strongly agree, agree, undecided, disagree, strongly disagree) and according to whether the student was male or female. To determine whether the data provide sufficient evidence to indicate that the responses depend upon gender, the most appropriate test is:
A) chi-square goodness-of-fit test
B) chi-square test of a contingency table (test of independence)
C) chi-square test of normality
D) none of these
E) all of these
A) chi-square goodness-of-fit test
B) chi-square test of a contingency table (test of independence)
C) chi-square test of normality
D) none of these
E) all of these
Unlock Deck
Unlock for access to all 136 flashcards in this deck.
Unlock Deck
k this deck
46
A chi-square test of a contingency table with 4 rows and 5 columns shows that the value of the test statistic is 22.18. The most accurate statement that can be made about the p-value for this test is that:
A) p-value is greater than 0.05
B) p-value is smaller than 0.025
C) p-value is greater than 0.025 but smaller than 0.05
D) p-value is greater than 0.10
E) Not enough information is given to determine the p- value.
A) p-value is greater than 0.05
B) p-value is smaller than 0.025
C) p-value is greater than 0.025 but smaller than 0.05
D) p-value is greater than 0.10
E) Not enough information is given to determine the p- value.
Unlock Deck
Unlock for access to all 136 flashcards in this deck.
Unlock Deck
k this deck
47
Which statistical technique is appropriate when we wish to analyze the relationship between two qualitative variables with two or more categories?
A) The chi-square test of a multinomial experiment.
B) The chi-square test of a contingency table.
C) The t-test of the difference between two means.
D) The z test of the difference between two proportions.
E) None of these.
A) The chi-square test of a multinomial experiment.
B) The chi-square test of a contingency table.
C) The t-test of the difference between two means.
D) The z test of the difference between two proportions.
E) None of these.
Unlock Deck
Unlock for access to all 136 flashcards in this deck.
Unlock Deck
k this deck
48
A contingency table:
A) classifies data with respect to two qualitative variables
B) divides each variable into two or more categories
C) contains numbers that show the frequency of occurrence of all possible combinations of categories
D) all of these
E) none of these
A) classifies data with respect to two qualitative variables
B) divides each variable into two or more categories
C) contains numbers that show the frequency of occurrence of all possible combinations of categories
D) all of these
E) none of these
Unlock Deck
Unlock for access to all 136 flashcards in this deck.
Unlock Deck
k this deck
49
Contingency tables are used in:
A) testing independence of two samples
B) testing dependence in matched pairs
C) testing independence of two populations
D) describing a single population
E) testing independence of two quantitative variables in a population
A) testing independence of two samples
B) testing dependence in matched pairs
C) testing independence of two populations
D) describing a single population
E) testing independence of two quantitative variables in a population
Unlock Deck
Unlock for access to all 136 flashcards in this deck.
Unlock Deck
k this deck
50
A pollster was interested in determining whether three television dramas are equally preferable among men and women. The following data was recorded: Compute = ______________
Reject when > ______________.
Conclude that the preference of television drama is ______________ the viewer's gender.
Compute = ______________Reject
when > ______________.Conclude that the preference of television drama is ______________ the viewer's gender.
Unlock Deck
Unlock for access to all 136 flashcards in this deck.
Unlock Deck
k this deck
51
A chi-square test of independence is applied to a contingency table with 4 rows and 5 columns for two qualitative variables. The degrees of freedom for this test will be:
A) 20
B) 16
C) 15
D) 12
E) 9
A) 20
B) 16
C) 15
D) 12
E) 9
Unlock Deck
Unlock for access to all 136 flashcards in this deck.
Unlock Deck
k this deck
52
A chi-square test of independence with 10 degrees of freedom results in a test statistic of 19.25. Using the chi-square table, the most accurate statement that can be made about the p-value for this test is that:
A) p-value < 0.025
B) 0.025 < p-value < 0.05
C) 0.05 < p-value < 0.10
D) 0.10 < p-value < 0.20
E) p-value > 0.2
A) p-value < 0.025
B) 0.025 < p-value < 0.05
C) 0.05 < p-value < 0.10
D) 0.10 < p-value < 0.20
E) p-value > 0.2
Unlock Deck
Unlock for access to all 136 flashcards in this deck.
Unlock Deck
k this deck
53
The owner of Fit Forever Health Club is considering adding an indoor swimming pool to his facility. The manager decided to take a survey to determine whether member opinion about the addition of a pool was independent of the age of the member. Two hundred members were selected at random and asked to state their opinion. The following data was recorded: What is ?
______________
What is the p-value associated with the test?
______________
Conclude that member's opinion concerning the addition of an indoor pool is ______________ the member's age.
What is ?______________
What is the p-value associated with the test?
______________
Conclude that member's opinion concerning the addition of an indoor pool is ______________ the member's age.
Unlock Deck
Unlock for access to all 136 flashcards in this deck.
Unlock Deck
k this deck
54
Which of the following statements about a goodness-of-fit test is false?
A) It determines the likelihood that sample data have been generated from a population that conforms to a specified type of probability distribution.
B) It compares the entire shapes of two (discrete or continuous) probability distributions: one describing known population data and the other one describing hypothetical sample data.
C) The aim of the test might be limited to identifying only the family to which the underlying distribution belongs.
D) The aim of the test might be limited to identifying only the family to which the underlying distribution belongs or it might go further, seeking even to identify a particular member of that family.
E) None of these.
Unlock Deck
Unlock for access to all 136 flashcards in this deck.
Unlock Deck
k this deck
55
Which of the following statements about the chi-square distribution is false?
A) A different chi-square distribution exists for each possible number of degrees of freedom.
B) Because the chi-square random variable is a sum of squared deviations, negative values are impossible.
C) All values range between zero and one.
D) All chi-square distributions are skewed to the right.
E) All of these.
Unlock Deck
Unlock for access to all 136 flashcards in this deck.
Unlock Deck
k this deck
56
The chi-square test of independence is based upon:
A) two qualitative variables
B) two quantitative variables
C) three or more qualitative variables
D) three or more quantitative variables
E) a quantitative and a qualitative variable
A) two qualitative variables
B) two quantitative variables
C) three or more qualitative variables
D) three or more quantitative variables
E) a quantitative and a qualitative variable
Unlock Deck
Unlock for access to all 136 flashcards in this deck.
Unlock Deck
k this deck
57
Which of the following statements about a contingency table test is false?
A) The nature of the sampling distribution of chi-square depends on the number of degrees of freedom associated with the problem under investigation.
B) The degrees of freedom are found as (r - 2)(c - 2), where r represents number of rows and c represents number of columns.
C) The contingency table must have a minimum of 2 rows and 2 columns.
D) All of these.
E) None of these.
Unlock Deck
Unlock for access to all 136 flashcards in this deck.
Unlock Deck
k this deck
58
A contingency table test with 4 rows and 30 degrees of freedom implies that the table must have:
A) 7 columns
B) 9 columns
C) 11 columns
D) 13 columns
E) 15 columns
A) 7 columns
B) 9 columns
C) 11 columns
D) 13 columns
E) 15 columns
Unlock Deck
Unlock for access to all 136 flashcards in this deck.
Unlock Deck
k this deck
59
The chi-square test of a contingency table is based upon:
A) two qualitative variables
B) two quantitative variables
C) three or more qualitative variables
D) three or more quantitative variables
E) all of these
A) two qualitative variables
B) two quantitative variables
C) three or more qualitative variables
D) three or more quantitative variables
E) all of these
Unlock Deck
Unlock for access to all 136 flashcards in this deck.
Unlock Deck
k this deck
60
A contingency table test with 4 rows and 15 degrees of freedom implies:
A) 5 columns
B) 6 columns
C) 9 columns
D) 11 columns
E) 60 columns
A) 5 columns
B) 6 columns
C) 9 columns
D) 11 columns
E) 60 columns
Unlock Deck
Unlock for access to all 136 flashcards in this deck.
Unlock Deck
k this deck
61
A sport preference poll showed the following data for men and women: Use the 5% level of significance and test to determine whether sport preferences depend on gender. = ______________
Critical Value = ______________
Conclusion: ______________
Sport preferences ______________ on gender.
Use the 5% level of significance and test to determine whether sport preferences depend on gender. = ______________Critical Value = ______________
Conclusion: ______________
Sport preferences ______________ on gender.
Unlock Deck
Unlock for access to all 136 flashcards in this deck.
Unlock Deck
k this deck
62
Is there a difference in the spending patterns of high school seniors depending on their gender? A study to investigate this question focused on 196 employed high school seniors. Students were asked to classify the amount of their earnings that they spent on their car during a given month: A portion of the Minitab printout is given here. Use the printout to analyze the relationship between spending patterns and gender.
What is ?
______________
What is the p-value?
______________
Conclude that there ______________ sufficient evidence to indicate a difference in spending patterns between males and females.
A portion of the Minitab printout is given here. Use the printout to analyze the relationship between spending patterns and gender.What is
?______________
What is the p-value?
______________
Conclude that there ______________ sufficient evidence to indicate a difference in spending patterns between males and females.
Unlock Deck
Unlock for access to all 136 flashcards in this deck.
Unlock Deck
k this deck
63
A chi-square goodness-of-fit test with 3 degrees of freedom results in a test statistic of 6.789. Using the chi-square table, the most accurate statement that can be made about the p-value for this test is that 0.05 < p-value < 0.10.
Unlock Deck
Unlock for access to all 136 flashcards in this deck.
Unlock Deck
k this deck
64
The number of Americans who visit fast-food restaurants regularly has grown steadily over the last decade. For this reason, marketing experts are interested in the demographics of fast-food customers. Is a customer's preference for a fast- food chain affected by the age of the customer? If so, advertising might need to target a particular age group. Suppose a random sample of 400 fast-food customers aged 16 and older was selected, and their favorite fast-food restaurants along with their age groups were recorded, as shown in the table: Use an appropriate method to determine whether or not a customer's fast-food preference is dependent on age.
Compute :
______________
What is the p-value?
______________
Conclude that there ______________ a dependence between age group and favorite fast food restaurant.
Write a short paragraph presenting your statistical conclusions and their practical implications for marketing experts.
________________________________________________________
Use an appropriate method to determine whether or not a customer's fast-food preference is dependent on age.Compute
:______________
What is the p-value?
______________
Conclude that there ______________ a dependence between age group and favorite fast food restaurant.
Write a short paragraph presenting your statistical conclusions and their practical implications for marketing experts.
________________________________________________________
Unlock Deck
Unlock for access to all 136 flashcards in this deck.
Unlock Deck
k this deck
65
A marketing research professor at Ferris State University conducted a survey to determine whether mode of transportation to the university and the person's position at the university were independent. The following data was recorded: Perform the appropriate test of hypothesis using = 0.10.
Compute = ______________
Reject when > ______________.
Conclude that the mode of transportation to the university and person's position at the university are ______________.
Perform the appropriate test of hypothesis using = 0.10.Compute
= ______________Reject
when > ______________.Conclude that the mode of transportation to the university and person's position at the university are ______________.
Unlock Deck
Unlock for access to all 136 flashcards in this deck.
Unlock Deck
k this deck
66
All chi-square distributions are skewed to the right and their means equal the associated degrees of freedom.
Unlock Deck
Unlock for access to all 136 flashcards in this deck.
Unlock Deck
k this deck
67
Because the chi-square random variable is a sum of squares, it cannot take on negative values.
Unlock Deck
Unlock for access to all 136 flashcards in this deck.
Unlock Deck
k this deck
68
A study of educational levels of 500 voters and their political party affiliations in a southern state in the USA showed the following results: Use the 1% level of significance and test to see if party affiliation is independent of the educational level of the voters. = ______________
Critical Value = ______________
Conclusion: ______________
Political party affiliation ______________ on the educational level of the voters.
Use the 1% level of significance and test to see if party affiliation is independent of the educational level of the voters. = ______________Critical Value = ______________
Conclusion: ______________
Political party affiliation ______________ on the educational level of the voters.
Unlock Deck
Unlock for access to all 136 flashcards in this deck.
Unlock Deck
k this deck
69
Whenever the expected frequency of a cell is less than 5, one remedy for this condition is to increase the significance level.
Unlock Deck
Unlock for access to all 136 flashcards in this deck.
Unlock Deck
k this deck
70
An experiment was conducted to investigate the effect of general hospital experience on the attitudes of physicians toward lower-class people. A random sample of 50 physicians who had just completed 4 weeks of service in a general hospital were categorized according to their concern for lower-class people before and after their general hospital experience. The data are shown in the table. Do the data provide sufficient evidence to indicate a change in "concern" after the general hospital experience?
Compute = ______________
Give a range for the p-value. ______________
Conclude that there is ______________ enough evidence to indicate a change in concern due to the general hospital experience.
Do the data provide sufficient evidence to indicate a change in "concern" after the general hospital experience?Compute
= ______________Give a range for the p-value. ______________
Conclude that there is ______________ enough evidence to indicate a change in concern due to the general hospital experience.
Unlock Deck
Unlock for access to all 136 flashcards in this deck.
Unlock Deck
k this deck
71
A large carpet store wishes to determine if the brand of carpet purchased is related to the purchaser's family income. As a sampling frame, they mailed a survey to people who have a store credit card. Five hundred customers returned the survey and the results follow: At the 5% level of significance, can you conclude that the brand of carpet purchased is related to the purchaser's family income?
Test statistic = ______________
Critical Value = ______________
Conclusion: ______________
We can conclude that the brand of carpet purchased ______________ related to the purchaser's family income.
At the 5% level of significance, can you conclude that the brand of carpet purchased is related to the purchaser's family income?Test statistic = ______________
Critical Value = ______________
Conclusion: ______________
We can conclude that the brand of carpet purchased ______________ related to the purchaser's family income.
Unlock Deck
Unlock for access to all 136 flashcards in this deck.
Unlock Deck
k this deck
72
A major insurance firm interviewed a random sample of 1200 college students to find out the type of life insurance preferred, if any. The results follow: Is there evidence that life insurance preference of male students is different than that of female students? Test using the 5% level of significance.
Test statistic = ______________
Critical Value = ______________
Conclusion: ______________
Life insurance preference ______________ on gender.
Is there evidence that life insurance preference of male students is different than that of female students? Test using the 5% level of significance.Test statistic = ______________
Critical Value = ______________
Conclusion: ______________
Life insurance preference ______________ on gender.
Unlock Deck
Unlock for access to all 136 flashcards in this deck.
Unlock Deck
k this deck
73
A survey of 500 respondents produced these cell counts in a 2 3 contingency table: If you wish to test the null hypothesis of "independence" - that the probability that a response falls in any one row is independent of the column it falls in - and you plan to use a chi-square test, how many degrees of freedom will be associated with the statistic?
df = ______________
Compute : = ______________
Reject when > ______________.
Conclude that there ______________ reason to expect a dependence between rows and columns.
Find the approximate p-value for the test.
The p-value ______________ .10
3 contingency table: If you wish to test the null hypothesis of "independence" - that the probability that a response falls in any one row is independent of the column it falls in - and you plan to use a chi-square test, how many degrees of freedom will be associated with the statistic?df = ______________
Compute
: = ______________Reject
when > ______________.Conclude that there ______________ reason to expect a dependence between rows and columns.
Find the approximate p-value for the test.
The p-value ______________ .10
Unlock Deck
Unlock for access to all 136 flashcards in this deck.
Unlock Deck
k this deck
74
The personnel manager of a consumer products company asked a random sample of employees how they felt about the work they were doing. The following table gives a breakdown of their responses by age. Is there sufficient evidence to conclude that the level of job satisfaction is related to age? Use = 0.10.
What is ?
______________
Critical Value = ______________
Conclusion: ______________
Job satisfaction ______________ related to age.
Is there sufficient evidence to conclude that the level of job satisfaction is related to age? Use = 0.10.What is
?______________
Critical Value = ______________
Conclusion: ______________
Job satisfaction ______________ related to age.
Unlock Deck
Unlock for access to all 136 flashcards in this deck.
Unlock Deck
k this deck
75
The degrees of freedom associated with a goodness-of-fit test equal the number of rows times the number of columns in the table.
Unlock Deck
Unlock for access to all 136 flashcards in this deck.
Unlock Deck
k this deck
76
The personnel manager of a consumer product company asked a random sample of employees how they felt about the work they were doing. The following table gives a breakdown of their responses by gender. Do the data provide sufficient evidence to conclude that the level of job satisfaction is related to gender? Conduct the test at the 0.10 level of significance.
Test statistic = ______________
Critical Value(s) = ______________
Conclusion: ______________
The data provide ______________ evidence to conclude that the level of job satisfaction is related to gender.
Do the data provide sufficient evidence to conclude that the level of job satisfaction is related to gender? Conduct the test at the 0.10 level of significance.Test statistic = ______________
Critical Value(s) = ______________
Conclusion: ______________
The data provide ______________ evidence to conclude that the level of job satisfaction is related to gender.
Unlock Deck
Unlock for access to all 136 flashcards in this deck.
Unlock Deck
k this deck
77
A right-tailed area in the chi-square distribution equals 0.05. For 6 degrees of freedom the table value equals 12.5916.
Unlock Deck
Unlock for access to all 136 flashcards in this deck.
Unlock Deck
k this deck
78
A goodness-of-fit test determines the likelihood that sample data have been generated from a population that conforms to a specified type of probability distribution.
Unlock Deck
Unlock for access to all 136 flashcards in this deck.
Unlock Deck
k this deck
79
A chi-square goodness-of-fit test is always conducted as a two-tail test.
Unlock Deck
Unlock for access to all 136 flashcards in this deck.
Unlock Deck
k this deck
80
A study was conducted to determine whether opinion concerning the addition of seat belts in school buses is independent of the population density in which a person resides. The following data was recorded: Use the following output generated using Minitab to answer the questions below. What is ?
______________
What is the p-value associated with the test?
______________
Conclude that opinion concerning the addition of seat belts to school buses is ______________ the population density where the person resides.
Use the following output generated using Minitab to answer the questions below. What is ?______________
What is the p-value associated with the test?
______________
Conclude that opinion concerning the addition of seat belts to school buses is ______________ the population density where the person resides.
Unlock Deck
Unlock for access to all 136 flashcards in this deck.
Unlock Deck
k this deck
Unlock Deck
Unlock for access to all 136 flashcards in this deck.


