Exam 14: Analysis of Categorical Data
Exam 1: Describing Data With Graphs94 Questions
Exam 2: Describing Data With Numerical Measures186 Questions
Exam 3: Describing Bivariate Data35 Questions
Exam 4: Probability and Probability Distributions136 Questions
Exam 5: Several Useful Discrete Distributions129 Questions
Exam 6: The Normal Probability Distribution196 Questions
Exam 7: Sampling Distributions162 Questions
Exam 8: Large-Sample Estimation173 Questions
Exam 9: Large-Sample Tests of Hypotheses210 Questions
Exam 10: Inference From Small Samples261 Questions
Exam 11: The Analysis of Variance156 Questions
Exam 12: Linear Regression and Correlation165 Questions
Exam 13: Multiple Regression Analysis178 Questions
Exam 14: Analysis of Categorical Data136 Questions
Exam 15: Nonparametric Statistics198 Questions
Select questions type
A major insurance firm interviewed a random sample of 1200 college students to find out the type of life insurance preferred, if any. The results follow: 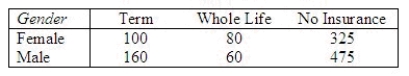 Is there evidence that life insurance preference of male students is different than that of female students? Test using the 5% level of significance.
Test statistic = ______________
Critical Value = ______________
Conclusion: ______________
Life insurance preference ______________ on gender.
Is there evidence that life insurance preference of male students is different than that of female students? Test using the 5% level of significance.
Test statistic = ______________
Critical Value = ______________
Conclusion: ______________
Life insurance preference ______________ on gender.
Free
(Short Answer)
4.8/5  (30)
(30)
Correct Answer: Verified
15.124; 5.991; Reject H0; depends
A chi-square test of independence with 10 degrees of freedom results in a test statistic of 19.25. Using the chi-square table, the most accurate statement that can be made about the p-value for this test is that:
Free
(Multiple Choice)
4.9/5 (32)
Correct Answer:Verified
B
All expected cell counts must equal ten in order that the chi-square approximation is valid.
Free
(True/False)
5.0/5 (40)
Correct Answer:Verified
False
Is there a difference in the spending patterns of high school seniors depending on their gender? A study to investigate this question focused on 196 employed high school seniors. Students were asked to classify the amount of their earnings that they spent on their car during a given month: 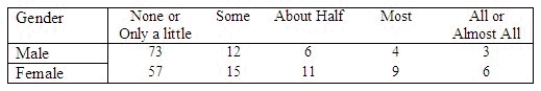 A portion of the Minitab printout is given here.
 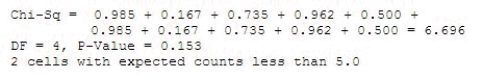 Use the printout to analyze the relationship between spending patterns and gender.
What is
Use the printout to analyze the relationship between spending patterns and gender.
What is  ?
______________
What is the p-value?
______________
Conclude that there ______________ sufficient evidence to indicate a difference in spending patterns between males and females.
?
______________
What is the p-value?
______________
Conclude that there ______________ sufficient evidence to indicate a difference in spending patterns between males and females.
(Short Answer)
4.8/5 (29)
The area to the right of a chi-square value is 0.01. For 8 degrees of freedom, the table value is 1.64648.
(True/False)
4.9/5 (41)
A firm has been accused of engaging in prejudicial hiring practices. According to the most recent census, the percentages of whites, blacks, and Hispanics in a certain community are 72%, 10%, and 18%, respectively. A random sample of 200 employees of the firm revealed that 165 were white, 14 were black, and 21 were Hispanic. Do the data provide sufficient evidence to conclude at the 5% level of significance that the firm has been engaged in prejudicial hiring practices?
Compute  :
______________
Reject
:
______________
Reject  when
when  > ______________.
Conclude that the firm ______________ engaged in prejudicial hiring practices
> ______________.
Conclude that the firm ______________ engaged in prejudicial hiring practices
(Short Answer)
4.9/5 (30)
To be valid, the chi-square test requires that all expected frequencies equal:
(Multiple Choice)
5.0/5 (40)
The owner of Fit Forever Health Club is considering adding an indoor swimming pool to his facility. The manager decided to take a survey to determine whether member opinion about the addition of a pool was independent of the age of the member. Two hundred members were selected at random and asked to state their opinion. The following data was recorded: 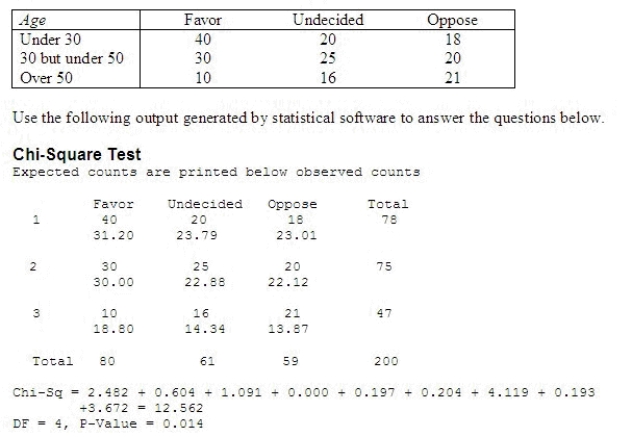 What is
  ?
______________
What is the p-value associated with the test?
______________
Conclude that member's opinion concerning the addition of an indoor pool is ______________ the member's age.
?
______________
What is the p-value associated with the test?
______________
Conclude that member's opinion concerning the addition of an indoor pool is ______________ the member's age.
(Short Answer)
4.8/5 (40)
A left-tailed area in the chi-square distribution equals 0.90. For 7 degrees of freedom, the table value equals:
(Multiple Choice)
4.9/5 (45)
Chi-square tests of independence are always lower-tailed because a perfect fit between  and
and  makes
makes  equal to zero.
(True/False)
4.8/5 (27)
A chi-square test for independence is applied to a contingency table with 3 rows and 5 columns for two qualitative variables. The degrees of freedom for this test is 8.
(True/False)
4.7/5 (35)
Consider a cell in a contingency table. Given the cell's row total of 200, the cell's column total of 75, and a sample size of 1,000, the cell's expected frequency:
(Multiple Choice)
4.7/5 (33)
A national survey states that 67% of college students are under the age of 25, 21% are between the ages of 25 and 30, 8% are between 30 and 40, and 4% are over 40. A random sample of 250 students at Grand Rapids Community College yielded the following data: 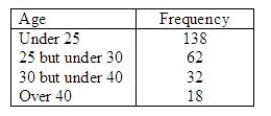 Test whether the distribution of students' ages at Grand Rapids Community College agrees with the national survey.
Compute the value of the test statistic.
Compute
Test whether the distribution of students' ages at Grand Rapids Community College agrees with the national survey.
Compute the value of the test statistic.
Compute  .
______________
Set up the appropriate rejection region for
.
______________
Set up the appropriate rejection region for  = 0.05.
Reject
= 0.05.
Reject  when
when  > ______________.
What is the appropriate conclusion?
______________
> ______________.
What is the appropriate conclusion?
______________  .
Conclude the distribution of students' ages at Grand Rapids Community College ______________ agree with the national survey.
.
Conclude the distribution of students' ages at Grand Rapids Community College ______________ agree with the national survey.
(Short Answer)
4.9/5 (32)
To be valid, a chi-square test of independence requires that the expected frequency for each cell in the contingency table equal 10 or more.
(True/False)
5.0/5 (28)
The chi-square test of independence is based upon three or more quantitative variables.
(True/False)
4.8/5 (43)
A survey in Southern California claims that, among consumers, the grocery store chains of Ralph's, Lucky's, and Von's are equally preferable. To check this claim, a random sample of 150 consumers was selected and the following data recorded: 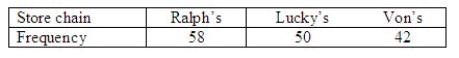 Test the appropriate hypotheses at the 5% significance level.
Compute
Test the appropriate hypotheses at the 5% significance level.
Compute  :
______________
Reject
:
______________
Reject  when
when  > ______________.
Conclude that the three grocery store chains ______________ equally preferred.
> ______________.
Conclude that the three grocery store chains ______________ equally preferred.
(Short Answer)
4.9/5 (38)
The chi-square test of a contingency table is used to determine if there is enough evidence to infer that two nominal variables are related, and to infer that differences exist among two or more populations of nominal variables.
(True/False)
4.7/5 (27)
In the chi-square goodness-of-fit test, if the expected frequencies  and the observed frequencies
  were quite different, we would conclude that the:
(Multiple Choice)
4.7/5 (35)
Filters
- Essay(0)
- Multiple Choice(0)
- Short Answer(0)
- True False(0)
- Matching(0)