Deck 8: Large-Sample Estimation
Full screen (f)
Question
A 95% lower confidence bound (LCB) for the population mean  can be constructed using the following equation:
LCB =
can be constructed using the following equation:LCB =
Question
Question
Question
A 90% upper confidence bound (UCB) for the population proportion p can be constructed using the following equation:
UCB =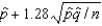
UCB =
Question
Question
Question
Question
Question
Suppose you wish to estimate a population mean  based on a sample of n observations. What sample size is required if you want your estimate to be within 2 of
  with probability equal to 0.95 if you know the population standard deviation
  is 12?
A) 239
B) 196
C) 139
D) 127
E) 98
based on a sample of n observations. What sample size is required if you want your estimate to be within 2 of with probability equal to 0.95 if you know the population standard deviation is 12?A) 239
B) 196
C) 139
D) 127
E) 98
Question
One-sided confidence bounds can be constructed for the population mean  and population proportion p, but not for
  the difference between population means, or
  the difference between population proportions.
and population proportion p, but not for the difference between population means, or the difference between population proportions. Question
Question
In a study of radio listening habits, a station owner would like to estimate the average number of hours that teenagers spend listening each day. If it is reasonable to assume that  = 1.3 hours, how large a sample size is needed to be 90% confident that the sample mean is off by at most 30 minutes?
______________
= 1.3 hours, how large a sample size is needed to be 90% confident that the sample mean is off by at most 30 minutes?______________
Question
If you wish to construct 80% lower confidence bound (LCB) for the population mean  , then the z-value you should use is approximately:
A) .84
B) 1.28
C) 1.96
D) 2.33
E) 2.58
, then the z-value you should use is approximately:A) .84
B) 1.28
C) 1.96
D) 2.33
E) 2.58
Question
Question
Question
A 99% upper confidence bound (UCB) for the difference between population means in case of large samples (both  and
and  greater than 30) can be constructed using the following equation:
UCB =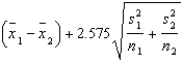
and greater than 30) can be constructed using the following equation:UCB =
Question
A 95% lower confidence bound (LCB) for the difference between population proportions can be constructed using the following equation:
LCB =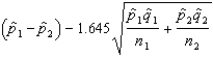
LCB =
Question
Question
Trish attends an aerobics class four times each week. She would like to estimate the mean number of minutes of continuous exercise until her heart reaches 90 beats per minute. If it can be assumed that  = 1.7 minutes, how large a sample is needed so that it will be possible to assert with 99% confidence that the sample mean has a margin of error of at most 0.62 minutes?
______________
= 1.7 minutes, how large a sample is needed so that it will be possible to assert with 99% confidence that the sample mean has a margin of error of at most 0.62 minutes?______________
Question
Question
Assume that two independent random samples of sizes  and
and  have been selected from binomial populations with parameters
  and
and  , respectively. The standard error of the sampling distribution of
  , the difference between sample proportions, is estimated by
 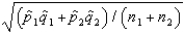 .
.
and have been selected from binomial populations with parameters and , respectively. The standard error of the sampling distribution of , the difference between sample proportions, is estimated by . Question
Assume that two independent random samples of sizes  and
and  have been selected from binomial populations with parameters
  and
and  , respectively. The sampling distribution of
  , the difference between sample proportions, can be approximated by a normal distribution provided that
  , and
, and  are all greater than 5.
and have been selected from binomial populations with parameters and , respectively. The sampling distribution of , the difference between sample proportions, can be approximated by a normal distribution provided that , and are all greater than 5. Question
A questionnaire is designed to investigate attitudes about political corruption in government. The experimenter would like to survey two different groups--Republicans and Democrats--and compare the responses to various "yes-no" questions for the two groups. The experimenter requires that the sampling error for the difference in the proportion of yes responses for the two groups is no more than  4 percentage points with probability equal to 0.95. If the two samples are both the same size, how large should the samples be?
______________
4 percentage points with probability equal to 0.95. If the two samples are both the same size, how large should the samples be?______________
Question
Question
Question
Question
Two independent random samples of sizes  and
and  have been selected from binomial populations with parameters
  and
and  , respectively, and resulted in 38 and 65 success, respectively. Then the standard error of
  is estimated as .077.
and have been selected from binomial populations with parameters and , respectively, and resulted in 38 and 65 success, respectively. Then the standard error of is estimated as .077. Question
Question
Question
The mean of the sampling distribution of  , the difference between sample proportions, is
  the difference between population proportions.
, the difference between sample proportions, is the difference between population proportions. Question
Question
A simple extension of the estimation of a binomial proportion p is the estimation of the difference between two binomial proportions  and
and  .
.
and . Question
Suppose you wish to estimate a population mean based on a random sample of n observations, and prior experience suggests that  . If you wish to estimate
  correct to within 1.8, with probability equal to 0.95, how many observations should be included in your sample?
______________
. If you wish to estimate correct to within 1.8, with probability equal to 0.95, how many observations should be included in your sample?______________
Question
Question
Question
Question
Two independent random samples of sizes  and
and  have been selected from binomial populations with parameters
  and
and  , respectively, and resulted in 38 and 65 success, respectively. Then, the point estimation of the difference
  is -27.
and have been selected from binomial populations with parameters and , respectively, and resulted in 38 and 65 success, respectively. Then, the point estimation of the difference is -27. Question
Question
Question
Question
A manufacturing plant has two assembly lines for producing glass bottles. The plant manager was concerned about whether the proportion of defective bottles differs between the two lines. Two independent random samples were selected and the following summary data computed: 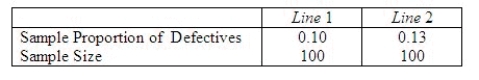 Find a 95% confidence interval for the true difference in proportion of defective bottles produced by the two assembly lines.
______________
Based on the interval above, can one conclude there is a difference in proportion of defective bottles produced by the two lines?
______________
Explain.
________________________________________________________
Find a 95% confidence interval for the true difference in proportion of defective bottles produced by the two assembly lines.______________
Based on the interval above, can one conclude there is a difference in proportion of defective bottles produced by the two lines?
______________
Explain.
________________________________________________________
Question
Question
Question
Question
Question
The difference between two sample means  is an unbiased estimator of the difference between two population means
  .
.
is an unbiased estimator of the difference between two population means . Question
When two independent random samples of sizes  and
and  have been selected from populations with means
  and
and  , and variances
  and
and  , which of the following is true?
A) The mean ofis.
B) The standard error ofis.
C) The standard error ofis estimated as.
D) All of these.
E) None of these.
and have been selected from populations with means and , and variances and , which of the following is true?A) The mean ofis.
B) The standard error ofis.
C) The standard error ofis estimated as.
D) All of these.
E) None of these.
Question
Question
The best estimator of the difference between two population means  is the difference between two sample means
  .
.
is the difference between two sample means . Question
Question
Question
Question
Question
Question
A stylist at The Hair Care Palace gathered data on the number of hair colorings given on Saturdays and on weekdays. Her results are listed below. Assume the two samples were independently taken from normal populations. 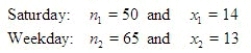 Find the point estimate of p1 - p2.
______________
Find the margin of error.
______________
Estimate the difference in the true proportions with a 99% confidence interval.
______________
Interpret this interval.
________________________________________________________
Find the point estimate of p1 - p2.______________
Find the margin of error.
______________
Estimate the difference in the true proportions with a 99% confidence interval.
______________
Interpret this interval.
________________________________________________________
Question
Question
The standard error of the sampling distribution of  is given by the formula:
SE =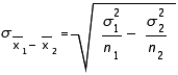 .
.
is given by the formula:SE =
. Question
When two independent random samples of sizes  and
and  have been selected from populations with means
  and
and  , and variances
  and
and  , which of the following is true?
A) If the sampled populations are normally distributed, then the sampling distribution ofis exactly normal only whenandare both 30 or more.
B) If the sampled populations are normally distributed, then the sampling distribution ofis exactly normal regardless of the sizes ofand.
C) If the sampled populations are not normally distributed, then the sampling distribution ofis approximately normally distributed regardless of the sizes ofand.
D) If the sampled populations are not normally distributed, then the sampling distribution ofis approximately normally distributed only ifis 30 or more.
E) None of these.
and have been selected from populations with means and , and variances and , which of the following is true?A) If the sampled populations are normally distributed, then the sampling distribution ofis exactly normal only whenandare both 30 or more.
B) If the sampled populations are normally distributed, then the sampling distribution ofis exactly normal regardless of the sizes ofand.
C) If the sampled populations are not normally distributed, then the sampling distribution ofis approximately normally distributed regardless of the sizes ofand.
D) If the sampled populations are not normally distributed, then the sampling distribution ofis approximately normally distributed only ifis 30 or more.
E) None of these.
Question
In constructing a 95% confidence interval estimate for the difference between the means of two normally distributed populations, where the unknown population variances are assumed not to be equal, summary statistics computed from two independent samples are:  ,
,  ,
,  ,
,  ,
,  , and
, and  . The upper confidence limit is:
A) 18.78
B) 6.78
C) 5.76
D) 77.3
E) 89.3
, , , , , and . The upper confidence limit is:A) 18.78
B) 6.78
C) 5.76
D) 77.3
E) 89.3
Question
When two independent random samples of sizes  and
and  have been selected from populations with means
  and
and  and variances
  and
and  , the standard error of the sampling distribution of
  the difference between the two sample means, is found by taking the square root of the sum of the two population variances; namely,
  .
.
and have been selected from populations with means and and variances and , the standard error of the sampling distribution of the difference between the two sample means, is found by taking the square root of the sum of the two population variances; namely, . Question
An Internet server conducted a survey of 400 of its customers and found that the average amount of time spent online was 12.5 hours per week with a standard deviation of 5.4 hours.
What shape do you think the random variable x, the number of hours spent online, has?
______________
If the distribution of the original measurements is not normal, you can still use the standard normal distribution to construct a confidence interval for , the average online time for all users of this Internet server. Why?
________________________________________________________
Construct a 95% confidence interval for the average online time for all users of the particular Internet server.
______________
If the Internet server claimed that its users averaged 15 hours of use per week, would you agree or disagree?
______________
Explain.
________________________________________________________
What shape do you think the random variable x, the number of hours spent online, has?
______________
If the distribution of the original measurements is not normal, you can still use the standard normal distribution to construct a confidence interval for
, the average online time for all users of this Internet server. Why?________________________________________________________
Construct a 95% confidence interval for the average online time for all users of the particular Internet server.
______________
If the Internet server claimed that its users averaged 15 hours of use per week, would you agree or disagree?
______________
Explain.
________________________________________________________
Question
The sample proportion  is an unbiased estimator of the population proportion p.
is an unbiased estimator of the population proportion p. Question
When constructing a confidence interval for a population parameter, we generally set the confidence coefficient (  ) close to 0 (usually between 0 and 0.05) because it is the probability that the interval does not include the actual value of the population parameter.
) close to 0 (usually between 0 and 0.05) because it is the probability that the interval does not include the actual value of the population parameter. Question
In the formula:  , the
, the  refers to the area in the lower tail or upper tail of the sampling distribution of the sample mean.
, the refers to the area in the lower tail or upper tail of the sampling distribution of the sample mean. Question
Question
A computer laboratory manager was in charge of purchasing new battery packs for her lab of laptop computers. She narrowed her choices to two models that were available for her machines. Since the two models cost about the same, she was interested in determining whether there was a difference in the average time the battery packs would function before needing to be recharged. She took two independent random samples and computed the following summary information: 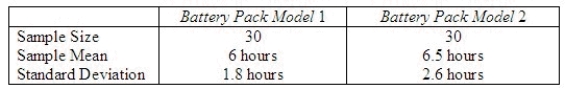 Find a 95% confidence interval for the difference in average functioning time before recharging in the two models.
______________
Based on the interval above, can one conclude there is a difference in the true average functioning time before recharging between the two models of battery packs?
______________
Explain.
________________________________________________________
Find a 95% confidence interval for the difference in average functioning time before recharging in the two models.______________
Based on the interval above, can one conclude there is a difference in the true average functioning time before recharging between the two models of battery packs?
______________
Explain.
________________________________________________________
Question
A dieter believes that the average number of calories in a homemade peanut butter cookie is more than in a store-bought peanut butter cookie. The summary data are listed below.  Estimate the difference in the mean calories between the two types of cookies using a 90% confidence interval.
______________
Estimate the difference in the mean calories between the two types of cookies using a 90% confidence interval.______________
Question
A parent believes the average height for 14-year-old girls differs from that of 14-year-old boys. The summary data are listed below where height is in feet.  Estimate the difference in the height between girls and boys using a 95% confidence interval.
______________
Based on your interval, do you think there is a significant difference between the true mean height of 14-year-old girls and boys?
______________
Explain.
________________________________________________________
Estimate the difference in the height between girls and boys using a 95% confidence interval.______________
Based on your interval, do you think there is a significant difference between the true mean height of 14-year-old girls and boys?
______________
Explain.
________________________________________________________
Question
Question
A study was conducted to compare the mean numbers of police emergency calls per 8-hour shift in two districts of Los Angeles. Samples of 100 8-shifts were randomly selected from the police records for each of the two regions, and the number of emergency calls was recorded for each shift. The sample statistics are listed below: 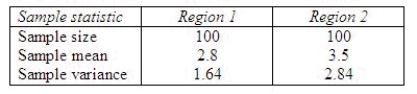 Find a 90% confidence interval for the difference in the mean numbers of police emergency calls per shift between the two districts of the city.
______________
Interpret the interval.
________________________________________________________
Find a 90% confidence interval for the difference in the mean numbers of police emergency calls per shift between the two districts of the city.______________
Interpret the interval.
________________________________________________________
Question
An experiment was conducted to compare two diets A and B designed for weight reduction. Two groups of 50 overweight dieters each were randomly selected. One group was placed on diet A and the other on diet B, and their weight losses were recorded over a 30-day period. The means and standard deviations of the weight-loss measurements for the two groups are shown in the table. 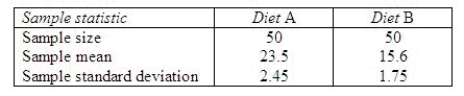 Find a 95% confidence interval for the difference in mean weight loss for the two diets.
______________
Interpret the interval.
________________________________________________________
Find a 95% confidence interval for the difference in mean weight loss for the two diets.______________
Interpret the interval.
________________________________________________________
Question
It is of interest to know if the average time it takes police to reach the scene of an accident differs from that of an ambulance to reach the same accident. Use the summary data listed below where time is in minutes. 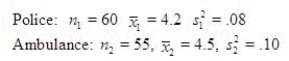 Estimate the difference in the times between the police and the ambulance using a 99% confidence interval.
______________
Does it appear that the times differ?
______________
Estimate the difference in the times between the police and the ambulance using a 99% confidence interval.______________
Does it appear that the times differ?
______________
Question
The lower and upper limits of the 68.26% confidence interval for the population mean  , given that n = 49;
  = 75; and
  = 7, are 74 and 76, respectively.
, given that n = 49; = 75; and = 7, are 74 and 76, respectively. Question
Question
A comparison between the average jail time of bank robbers and car thieves yielded the following results (in years):  Estimate (
  ), the difference in mean years of jail time.
______________
Find the margin of error for your estimate.
______________
Estimate ( ), the difference in mean years of jail time.______________
Find the margin of error for your estimate.
______________
Question
Question
Question
Question
A 90% confidence interval estimate for a population mean  is determined to be 62.8 to 73.4. If the confidence level is reduced to 80%, the confidence interval for
  becomes narrower.
is determined to be 62.8 to 73.4. If the confidence level is reduced to 80%, the confidence interval for becomes narrower. Question
In developing an interval estimate for the population mean  , the population standard deviation
  was assumed to be 6. The interval estimate was 45.0
  1.5. Had
  equaled 12, the interval estimate would be 90
  3.
3.
, the population standard deviation was assumed to be 6. The interval estimate was 45.0 1.5. Had equaled 12, the interval estimate would be 90 3.
Unlock Deck
Sign up to unlock the cards in this deck!
Unlock Deck
Unlock Deck
1/173
Play
Full screen (f)
Deck 8: Large-Sample Estimation
1
A 95% lower confidence bound (LCB) for the population mean can be constructed using the following equation:
LCB =
can be constructed using the following equation:LCB =
False
2
A quality control engineer wants to determine what proportion of defective parts are coming off the assembly line. Past experiments based on large sample sizes show this proportion to be 0.19. What sample size does the engineer need in order to estimate this proportion with a margin of error of 0.12 with 90% confidence?
______________
______________
29
3
If you wish to construct 92% lower confidence bound (LCB) for the difference between population means in case of large samples, then the z-value you should use is approximately:
A) 2.58
B) 1.96
C) 1.65
D) 1.41
E) 1.06
A) 2.58
B) 1.96
C) 1.65
D) 1.41
E) 1.06
1.41
4
A 90% upper confidence bound (UCB) for the population proportion p can be constructed using the following equation:
UCB =
UCB =
Unlock Deck
Unlock for access to all 173 flashcards in this deck.
Unlock Deck
k this deck
5
If you wish to construct 85% upper confidence bound (UCB) for the population proportion p, then the z-value you should use is approximately:
A) 2.58
B) 2.33
C) 1.96
D) 1.65
E) 1.04
A) 2.58
B) 2.33
C) 1.96
D) 1.65
E) 1.04
Unlock Deck
Unlock for access to all 173 flashcards in this deck.
Unlock Deck
k this deck
6
A state job service employee wishes to estimate the mean number of people who register with the service each week. How many weeks should be sampled in order to estimate the mean number of weekly registrants? The employee would like the margin of error to be less than 0.5 with probability of 0.95. Past records show the weekly standard deviation to be 2.5.
______________ weeks
______________ weeks
Unlock Deck
Unlock for access to all 173 flashcards in this deck.
Unlock Deck
k this deck
7
The Postmaster at the Harrington Post Office would like to compare the delivery times to two different locations which are the same number of miles from Harrington. A random sample of letters are to be divided into two equal groups, the first delivered to Location A and the second delivered to Location B. Each letter will be delivered on a randomly selected day and the number of days for each letter to arrive at its destination is recorded. The measurements for both groups are expected to have a range (variability) of approximately 4 days. If the estimate of the difference in mean delivery times is desired to be correct to within 1 day with probability equal to 0.99, how many letters must be included in each group? Assume n1 = n2 = n.
______________
______________
Unlock Deck
Unlock for access to all 173 flashcards in this deck.
Unlock Deck
k this deck
8
It is desired to compare the average ages at which men and women get their first license to drive. A random sample of 75 men yielded a mean and standard deviation of 17.3 and 4.7 years, respectively. A random sample of 96 women yielded a mean and standard deviation of 19.6 and 5.1 years, respectively. If it is desired to estimate the mean difference to within 1.5 years with 95% confidence, how large a sample should be taken from each population? Assume n1 = n2 = n.
______________
______________
Unlock Deck
Unlock for access to all 173 flashcards in this deck.
Unlock Deck
k this deck
9
Suppose you wish to estimate a population mean based on a sample of n observations. What sample size is required if you want your estimate to be within 2 of with probability equal to 0.95 if you know the population standard deviation is 12?
A) 239
B) 196
C) 139
D) 127
E) 98
based on a sample of n observations. What sample size is required if you want your estimate to be within 2 of with probability equal to 0.95 if you know the population standard deviation is 12?A) 239
B) 196
C) 139
D) 127
E) 98
Unlock Deck
Unlock for access to all 173 flashcards in this deck.
Unlock Deck
k this deck
10
One-sided confidence bounds can be constructed for the population mean and population proportion p, but not for the difference between population means, or the difference between population proportions.
and population proportion p, but not for the difference between population means, or the difference between population proportions. Unlock Deck
Unlock for access to all 173 flashcards in this deck.
Unlock Deck
k this deck
11
A researcher wants to determine the proportion of elm trees in Superior, Wisconsin, dying of Dutch elm disease. Past experiments based on large sample sizes have shown this proportion to be 0.3. What sample size does the researcher need in order to estimate this proportion to within 0.04 with 95% confidence?
______________
______________
Unlock Deck
Unlock for access to all 173 flashcards in this deck.
Unlock Deck
k this deck
12
In a study of radio listening habits, a station owner would like to estimate the average number of hours that teenagers spend listening each day. If it is reasonable to assume that = 1.3 hours, how large a sample size is needed to be 90% confident that the sample mean is off by at most 30 minutes?
______________
= 1.3 hours, how large a sample size is needed to be 90% confident that the sample mean is off by at most 30 minutes?______________
Unlock Deck
Unlock for access to all 173 flashcards in this deck.
Unlock Deck
k this deck
13
If you wish to construct 80% lower confidence bound (LCB) for the population mean , then the z-value you should use is approximately:
A) .84
B) 1.28
C) 1.96
D) 2.33
E) 2.58
, then the z-value you should use is approximately:A) .84
B) 1.28
C) 1.96
D) 2.33
E) 2.58
Unlock Deck
Unlock for access to all 173 flashcards in this deck.
Unlock Deck
k this deck
14
Suppose you wish to estimate a population proportion p based on sample of n observations. What sample size is required if you want your estimate to be within .03 of p with probability equal to 0.90?
A) 752
B) 423
C) 1,068
D) 1.529
E) none of these
A) 752
B) 423
C) 1,068
D) 1.529
E) none of these
Unlock Deck
Unlock for access to all 173 flashcards in this deck.
Unlock Deck
k this deck
15
A laboratory technician is interested in the proportion of 1-liter containers used in the lab that are glass. How many containers should be sampled in order to estimate this proportion with a margin of error of less than 0.2 with 99% confidence?
______________
______________
Unlock Deck
Unlock for access to all 173 flashcards in this deck.
Unlock Deck
k this deck
16
A 99% upper confidence bound (UCB) for the difference between population means in case of large samples (both and greater than 30) can be constructed using the following equation:
UCB =
and greater than 30) can be constructed using the following equation:UCB =
Unlock Deck
Unlock for access to all 173 flashcards in this deck.
Unlock Deck
k this deck
17
A 95% lower confidence bound (LCB) for the difference between population proportions can be constructed using the following equation:
LCB =
LCB =
Unlock Deck
Unlock for access to all 173 flashcards in this deck.
Unlock Deck
k this deck
18
If you wish to construct 98% upper confidence bound (UCB) for the difference between population proportions, then the approximate z-value you should use is:
A) 2.33
B) 2.05
C) 1.96
D) 1.65
E) 1.41
A) 2.33
B) 2.05
C) 1.96
D) 1.65
E) 1.41
Unlock Deck
Unlock for access to all 173 flashcards in this deck.
Unlock Deck
k this deck
19
Trish attends an aerobics class four times each week. She would like to estimate the mean number of minutes of continuous exercise until her heart reaches 90 beats per minute. If it can be assumed that = 1.7 minutes, how large a sample is needed so that it will be possible to assert with 99% confidence that the sample mean has a margin of error of at most 0.62 minutes?
______________
= 1.7 minutes, how large a sample is needed so that it will be possible to assert with 99% confidence that the sample mean has a margin of error of at most 0.62 minutes?______________
Unlock Deck
Unlock for access to all 173 flashcards in this deck.
Unlock Deck
k this deck
20
The sample size needed to estimate a population mean within 1.5 units with a 95% confidence when the population standard deviation equals 10 is:
A) 121
B) 13
C) 171
D) 54
E) 88
A) 121
B) 13
C) 171
D) 54
E) 88
Unlock Deck
Unlock for access to all 173 flashcards in this deck.
Unlock Deck
k this deck
21
Assume that two independent random samples of sizes and have been selected from binomial populations with parameters and , respectively. The standard error of the sampling distribution of , the difference between sample proportions, is estimated by .
and have been selected from binomial populations with parameters and , respectively. The standard error of the sampling distribution of , the difference between sample proportions, is estimated by . Unlock Deck
Unlock for access to all 173 flashcards in this deck.
Unlock Deck
k this deck
22
Assume that two independent random samples of sizes and have been selected from binomial populations with parameters and , respectively. The sampling distribution of , the difference between sample proportions, can be approximated by a normal distribution provided that , and are all greater than 5.
and have been selected from binomial populations with parameters and , respectively. The sampling distribution of , the difference between sample proportions, can be approximated by a normal distribution provided that , and are all greater than 5. Unlock Deck
Unlock for access to all 173 flashcards in this deck.
Unlock Deck
k this deck
23
A questionnaire is designed to investigate attitudes about political corruption in government. The experimenter would like to survey two different groups--Republicans and Democrats--and compare the responses to various "yes-no" questions for the two groups. The experimenter requires that the sampling error for the difference in the proportion of yes responses for the two groups is no more than 4 percentage points with probability equal to 0.95. If the two samples are both the same size, how large should the samples be?
______________
4 percentage points with probability equal to 0.95. If the two samples are both the same size, how large should the samples be?______________
Unlock Deck
Unlock for access to all 173 flashcards in this deck.
Unlock Deck
k this deck
24
If we wish to construct a 95% confidence interval estimate for the difference between two population proportions, then the confidence level would be:
A) 1.96
B) 0.475
C) 0.95
D) 0.05
E) 2.33
A) 1.96
B) 0.475
C) 0.95
D) 0.05
E) 2.33
Unlock Deck
Unlock for access to all 173 flashcards in this deck.
Unlock Deck
k this deck
25
If a 90% confidence interval estimate for the difference between two population proportions is to be constructed, then the confidence coefficient would be:
A) .10
B) .90
C) .05
D) .45
E) .35
A) .10
B) .90
C) .05
D) .45
E) .35
Unlock Deck
Unlock for access to all 173 flashcards in this deck.
Unlock Deck
k this deck
26
A process control engineer wishes to estimate the true proportion of defective computer chips with a margin of error of no more than 0.09 and with probability 0.90. How many observations does the engineer need to include in the sample to achieve his goal?
______________
______________
Unlock Deck
Unlock for access to all 173 flashcards in this deck.
Unlock Deck
k this deck
27
Two independent random samples of sizes and have been selected from binomial populations with parameters and , respectively, and resulted in 38 and 65 success, respectively. Then the standard error of is estimated as .077.
and have been selected from binomial populations with parameters and , respectively, and resulted in 38 and 65 success, respectively. Then the standard error of is estimated as .077. Unlock Deck
Unlock for access to all 173 flashcards in this deck.
Unlock Deck
k this deck
28
A manufacturer wishes to estimate the mean time a battery pack will function before needing to be recharged with a margin of error of no more than 0.5 hours and with probability 0.95. If the standard deviation is known to be 1.5 hours, how many observations should be included in the sample?
______________
______________
Unlock Deck
Unlock for access to all 173 flashcards in this deck.
Unlock Deck
k this deck
29
You want to estimate the difference in grade point averages between two groups of college students accurate to within 0.20 grade point, with probability equal to 0.95. If the standard deviation of the grade point measurements is approximately equal to 0.5, how many students must be included in each group? (Assume that the groups will be of equal size.)
______________
______________
Unlock Deck
Unlock for access to all 173 flashcards in this deck.
Unlock Deck
k this deck
30
The mean of the sampling distribution of , the difference between sample proportions, is the difference between population proportions.
, the difference between sample proportions, is the difference between population proportions. Unlock Deck
Unlock for access to all 173 flashcards in this deck.
Unlock Deck
k this deck
31
The z-value needed to construct a 97.8% confidence interval estimate for the difference between two population proportions is:
A) 2.33
B) 2.29
C) 2.02
D) 1.96
E) 1.65
A) 2.33
B) 2.29
C) 2.02
D) 1.96
E) 1.65
Unlock Deck
Unlock for access to all 173 flashcards in this deck.
Unlock Deck
k this deck
32
A simple extension of the estimation of a binomial proportion p is the estimation of the difference between two binomial proportions and .
and . Unlock Deck
Unlock for access to all 173 flashcards in this deck.
Unlock Deck
k this deck
33
Suppose you wish to estimate a population mean based on a random sample of n observations, and prior experience suggests that . If you wish to estimate correct to within 1.8, with probability equal to 0.95, how many observations should be included in your sample?
______________
. If you wish to estimate correct to within 1.8, with probability equal to 0.95, how many observations should be included in your sample?______________
Unlock Deck
Unlock for access to all 173 flashcards in this deck.
Unlock Deck
k this deck
34
The z-value needed to construct a 92.5% confidence interval estimate for the difference between two population proportions is:
A) 2.58
B) 2.33
C) 1.96
D) 1.78
E) 1.33
A) 2.58
B) 2.33
C) 1.96
D) 1.78
E) 1.33
Unlock Deck
Unlock for access to all 173 flashcards in this deck.
Unlock Deck
k this deck
35
An airline executive estimates that 25% of all flights arrive late. How many flights must we include in a simple random sample if we want to be 90% confident that the true population proportion of flights that arrive late lies within 0.01 of our sample proportion?
______________
______________
Unlock Deck
Unlock for access to all 173 flashcards in this deck.
Unlock Deck
k this deck
36
A childcare agency was interested in examining the amount that families pay per child per month for childcare outside the home. A random sample of 64 families was selected and the mean and standard deviation were computed to be $675 and $80, respectively.
Find a 95% upper confidence bound for the true average amount spent per child per month on childcare outside the home.
______________
Find a 95% upper confidence bound for the true average amount spent per child per month on childcare outside the home.
______________
Unlock Deck
Unlock for access to all 173 flashcards in this deck.
Unlock Deck
k this deck
37
Two independent random samples of sizes and have been selected from binomial populations with parameters and , respectively, and resulted in 38 and 65 success, respectively. Then, the point estimation of the difference is -27.
and have been selected from binomial populations with parameters and , respectively, and resulted in 38 and 65 success, respectively. Then, the point estimation of the difference is -27. Unlock Deck
Unlock for access to all 173 flashcards in this deck.
Unlock Deck
k this deck
38
A machine produces aluminum tins used in packaging cheese. A random sample of 1000 tins was selected and 43 were found to be defective. Find a 95% upper confidence bound for the true proportion of defective tins produced by the machine.
______________
______________
Unlock Deck
Unlock for access to all 173 flashcards in this deck.
Unlock Deck
k this deck
39
The manufacturer of a particular battery pack for a laptop computer claims the battery pack can function for 8 hours, on the average, before having to be recharged. A random sample of 36 such battery packs was selected and tested. The mean and standard deviation were found to be 6 hours and 1.8 hours, respectively.
Find a 95% lower confidence bound for the true average time the battery pack can function before having to be recharged.
______________
Find a 95% lower confidence bound for the true average time the battery pack can function before having to be recharged.
______________
Unlock Deck
Unlock for access to all 173 flashcards in this deck.
Unlock Deck
k this deck
40
Assume that the population standard deviation of annual incomes of all Michigan residents is $2,500. How many individuals must we include in a simple random sample if we want to be 95% confident that the population mean incomes lies within $150 of our sample mean income?
______________
______________
Unlock Deck
Unlock for access to all 173 flashcards in this deck.
Unlock Deck
k this deck
41
A manufacturing plant has two assembly lines for producing glass bottles. The plant manager was concerned about whether the proportion of defective bottles differs between the two lines. Two independent random samples were selected and the following summary data computed: Find a 95% confidence interval for the true difference in proportion of defective bottles produced by the two assembly lines.
______________
Based on the interval above, can one conclude there is a difference in proportion of defective bottles produced by the two lines?
______________
Explain.
________________________________________________________
Find a 95% confidence interval for the true difference in proportion of defective bottles produced by the two assembly lines.______________
Based on the interval above, can one conclude there is a difference in proportion of defective bottles produced by the two lines?
______________
Explain.
________________________________________________________
Unlock Deck
Unlock for access to all 173 flashcards in this deck.
Unlock Deck
k this deck
42
If you wish to estimate the difference between two population means when the population variances are known, the 90% confidence interval estimate can be developed using which of the following critical values of z?
A) 2.33
B) 1.28
C) 1.96
D) 2.58
E) 1.645
A) 2.33
B) 1.28
C) 1.96
D) 2.58
E) 1.645
Unlock Deck
Unlock for access to all 173 flashcards in this deck.
Unlock Deck
k this deck
43
In developing a confidence interval estimate for the difference between two population means, an increase in the size of the samples will result in:
A) a wider confidence interval
B) a narrower confidence interval
C) a smaller critical value z
D) the same confidence interval
E) none of these
A) a wider confidence interval
B) a narrower confidence interval
C) a smaller critical value z
D) the same confidence interval
E) none of these
Unlock Deck
Unlock for access to all 173 flashcards in this deck.
Unlock Deck
k this deck
44
Increasing the confidence level for a confidence interval estimate for the difference between two population means, with all other things held constant, will result in a wider confidence interval estimate.
Unlock Deck
Unlock for access to all 173 flashcards in this deck.
Unlock Deck
k this deck
45
In estimating the difference between two population means, if a 90% confidence interval estimate includes zero, then we can conclude that there is a 90% chance that the difference between the two population means is zero.
Unlock Deck
Unlock for access to all 173 flashcards in this deck.
Unlock Deck
k this deck
46
The difference between two sample means is an unbiased estimator of the difference between two population means .
is an unbiased estimator of the difference between two population means . Unlock Deck
Unlock for access to all 173 flashcards in this deck.
Unlock Deck
k this deck
47
When two independent random samples of sizes and have been selected from populations with means and , and variances and , which of the following is true?
A) The mean ofis.
B) The standard error ofis.
C) The standard error ofis estimated as.
D) All of these.
E) None of these.
and have been selected from populations with means and , and variances and , which of the following is true?A) The mean ofis.
B) The standard error ofis.
C) The standard error ofis estimated as.
D) All of these.
E) None of these.
Unlock Deck
Unlock for access to all 173 flashcards in this deck.
Unlock Deck
k this deck
48
Suppose a 90% confidence interval for the mean time it takes to serve a customer at a drive-in bank is 120 seconds to 220 seconds. At the 90% confidence level, there is not enough evidence to conclude that the mean service time is not 200 seconds.
Unlock Deck
Unlock for access to all 173 flashcards in this deck.
Unlock Deck
k this deck
49
The best estimator of the difference between two population means is the difference between two sample means .
is the difference between two sample means . Unlock Deck
Unlock for access to all 173 flashcards in this deck.
Unlock Deck
k this deck
50
Instead of paying to support welfare recipients, many Californians want them to find jobs; if necessary, they want the state to create public service jobs for those who cannot find jobs in private industry. In a survey of 800 registered voters, 400 Republicans and 400 Democrats, 75% of the Republicans and 90% of the Democrats favored the creation of public service jobs. Use a large-sample estimation procedure to compare the proportions of Republicans and Democrats who favor creating public service jobs in the population of registered voters in California.
The approximate 95% confidence interval is:
______________
Based on the interval above, is there a difference in the proportion of Republicans and Democrats who favor creating public service jobs in California?
______________
Explain.
________________________________________________________
The approximate 95% confidence interval is:
______________
Based on the interval above, is there a difference in the proportion of Republicans and Democrats who favor creating public service jobs in California?
______________
Explain.
________________________________________________________
Unlock Deck
Unlock for access to all 173 flashcards in this deck.
Unlock Deck
k this deck
51
If you wish to estimate the difference between two population means when the population variances are known, the 99% confidence interval estimate can be developed using which of the following critical values of z?
A) 2.575
B) 1.645
C) 2.325
D) 1.275
E) 2.582
A) 2.575
B) 1.645
C) 2.325
D) 1.275
E) 2.582
Unlock Deck
Unlock for access to all 173 flashcards in this deck.
Unlock Deck
k this deck
52
Suppose a 95% confidence interval for the mean height of a 12-year-old male in the United States is 54 to 65 inches. In repeated sampling, 95% of the intervals constructed will contain the interval from 54 to 65 inches.
Unlock Deck
Unlock for access to all 173 flashcards in this deck.
Unlock Deck
k this deck
53
Two samples are said to be independent if they are selected at different points in time.
Unlock Deck
Unlock for access to all 173 flashcards in this deck.
Unlock Deck
k this deck
54
Suppose a 90% confidence interval for the mean time it takes to serve a customer at a drive-in bank is 120 seconds to 220 seconds. In repeated sampling 90% of the intervals constructed using the appropriate formula will contain the actual mean time.
Unlock Deck
Unlock for access to all 173 flashcards in this deck.
Unlock Deck
k this deck
55
A stylist at The Hair Care Palace gathered data on the number of hair colorings given on Saturdays and on weekdays. Her results are listed below. Assume the two samples were independently taken from normal populations. Find the point estimate of p1 - p2.
______________
Find the margin of error.
______________
Estimate the difference in the true proportions with a 99% confidence interval.
______________
Interpret this interval.
________________________________________________________
Find the point estimate of p1 - p2.______________
Find the margin of error.
______________
Estimate the difference in the true proportions with a 99% confidence interval.
______________
Interpret this interval.
________________________________________________________
Unlock Deck
Unlock for access to all 173 flashcards in this deck.
Unlock Deck
k this deck
56
In a study of the relationship between birth order and college success, an investigator found that 140 in a sample of 200 college graduates were firstborn or only children. In a sample of 120 non-graduates of comparable age and socioeconomic background, the number of firstborn or only children was 66. Estimate the difference between the proportions of firstborn or only children in the two populations from which these samples were drawn. Use a 90% confidence interval and interpret your results.
The approximate 90% confidence interval is:
______________
Based on the interval above, is there a difference between the proportions of firstborn or only children in the two populations?
______________
Explain.
________________________________________________________
The approximate 90% confidence interval is:
______________
Based on the interval above, is there a difference between the proportions of firstborn or only children in the two populations?
______________
Explain.
________________________________________________________
Unlock Deck
Unlock for access to all 173 flashcards in this deck.
Unlock Deck
k this deck
57
The standard error of the sampling distribution of is given by the formula:
SE = .
is given by the formula:SE =
. Unlock Deck
Unlock for access to all 173 flashcards in this deck.
Unlock Deck
k this deck
58
When two independent random samples of sizes and have been selected from populations with means and , and variances and , which of the following is true?
A) If the sampled populations are normally distributed, then the sampling distribution ofis exactly normal only whenandare both 30 or more.
B) If the sampled populations are normally distributed, then the sampling distribution ofis exactly normal regardless of the sizes ofand.
C) If the sampled populations are not normally distributed, then the sampling distribution ofis approximately normally distributed regardless of the sizes ofand.
D) If the sampled populations are not normally distributed, then the sampling distribution ofis approximately normally distributed only ifis 30 or more.
E) None of these.
and have been selected from populations with means and , and variances and , which of the following is true?A) If the sampled populations are normally distributed, then the sampling distribution ofis exactly normal only whenandare both 30 or more.
B) If the sampled populations are normally distributed, then the sampling distribution ofis exactly normal regardless of the sizes ofand.
C) If the sampled populations are not normally distributed, then the sampling distribution ofis approximately normally distributed regardless of the sizes ofand.
D) If the sampled populations are not normally distributed, then the sampling distribution ofis approximately normally distributed only ifis 30 or more.
E) None of these.
Unlock Deck
Unlock for access to all 173 flashcards in this deck.
Unlock Deck
k this deck
59
In constructing a 95% confidence interval estimate for the difference between the means of two normally distributed populations, where the unknown population variances are assumed not to be equal, summary statistics computed from two independent samples are: , , , , , and . The upper confidence limit is:
A) 18.78
B) 6.78
C) 5.76
D) 77.3
E) 89.3
, , , , , and . The upper confidence limit is:A) 18.78
B) 6.78
C) 5.76
D) 77.3
E) 89.3
Unlock Deck
Unlock for access to all 173 flashcards in this deck.
Unlock Deck
k this deck
60
When two independent random samples of sizes and have been selected from populations with means and and variances and , the standard error of the sampling distribution of the difference between the two sample means, is found by taking the square root of the sum of the two population variances; namely, .
and have been selected from populations with means and and variances and , the standard error of the sampling distribution of the difference between the two sample means, is found by taking the square root of the sum of the two population variances; namely, . Unlock Deck
Unlock for access to all 173 flashcards in this deck.
Unlock Deck
k this deck
61
An Internet server conducted a survey of 400 of its customers and found that the average amount of time spent online was 12.5 hours per week with a standard deviation of 5.4 hours.
What shape do you think the random variable x, the number of hours spent online, has?
______________
If the distribution of the original measurements is not normal, you can still use the standard normal distribution to construct a confidence interval for , the average online time for all users of this Internet server. Why?
________________________________________________________
Construct a 95% confidence interval for the average online time for all users of the particular Internet server.
______________
If the Internet server claimed that its users averaged 15 hours of use per week, would you agree or disagree?
______________
Explain.
________________________________________________________
What shape do you think the random variable x, the number of hours spent online, has?
______________
If the distribution of the original measurements is not normal, you can still use the standard normal distribution to construct a confidence interval for
, the average online time for all users of this Internet server. Why?________________________________________________________
Construct a 95% confidence interval for the average online time for all users of the particular Internet server.
______________
If the Internet server claimed that its users averaged 15 hours of use per week, would you agree or disagree?
______________
Explain.
________________________________________________________
Unlock Deck
Unlock for access to all 173 flashcards in this deck.
Unlock Deck
k this deck
62
The sample proportion is an unbiased estimator of the population proportion p.
is an unbiased estimator of the population proportion p. Unlock Deck
Unlock for access to all 173 flashcards in this deck.
Unlock Deck
k this deck
63
When constructing a confidence interval for a population parameter, we generally set the confidence coefficient ( ) close to 0 (usually between 0 and 0.05) because it is the probability that the interval does not include the actual value of the population parameter.
) close to 0 (usually between 0 and 0.05) because it is the probability that the interval does not include the actual value of the population parameter. Unlock Deck
Unlock for access to all 173 flashcards in this deck.
Unlock Deck
k this deck
64
In the formula: , the refers to the area in the lower tail or upper tail of the sampling distribution of the sample mean.
, the refers to the area in the lower tail or upper tail of the sampling distribution of the sample mean. Unlock Deck
Unlock for access to all 173 flashcards in this deck.
Unlock Deck
k this deck
65
The meat department of a local supermarket packages ground beef using meat trays of two sizes: one designed to hold approximately 1.5 pounds of meat, and one that holds approximately 3 pounds. A random sample of 36 packages in the smaller meat trays produced weight measurements with an average of 1.51 pounds and a standard deviation of 0.20 pound.
Construct a 99% confidence interval for the average weight of all packages sold in the small meat trays by this supermarket chain.
______________
What does the phrase "99% confident" mean?
________________________________________________________
Suppose that the quality control department of this supermarket chain intends that the amount of ground beef in the smaller trays should be 1.5 pound on average. Should the confidence interval in part (a) concern the quality control department?
______________
Explain.
________________________________________________________
Unlock Deck
Unlock for access to all 173 flashcards in this deck.
Unlock Deck
k this deck
66
A computer laboratory manager was in charge of purchasing new battery packs for her lab of laptop computers. She narrowed her choices to two models that were available for her machines. Since the two models cost about the same, she was interested in determining whether there was a difference in the average time the battery packs would function before needing to be recharged. She took two independent random samples and computed the following summary information: Find a 95% confidence interval for the difference in average functioning time before recharging in the two models.
______________
Based on the interval above, can one conclude there is a difference in the true average functioning time before recharging between the two models of battery packs?
______________
Explain.
________________________________________________________
Find a 95% confidence interval for the difference in average functioning time before recharging in the two models.______________
Based on the interval above, can one conclude there is a difference in the true average functioning time before recharging between the two models of battery packs?
______________
Explain.
________________________________________________________
Unlock Deck
Unlock for access to all 173 flashcards in this deck.
Unlock Deck
k this deck
67
A dieter believes that the average number of calories in a homemade peanut butter cookie is more than in a store-bought peanut butter cookie. The summary data are listed below. Estimate the difference in the mean calories between the two types of cookies using a 90% confidence interval.
______________
Estimate the difference in the mean calories between the two types of cookies using a 90% confidence interval.______________
Unlock Deck
Unlock for access to all 173 flashcards in this deck.
Unlock Deck
k this deck
68
A parent believes the average height for 14-year-old girls differs from that of 14-year-old boys. The summary data are listed below where height is in feet. Estimate the difference in the height between girls and boys using a 95% confidence interval.
______________
Based on your interval, do you think there is a significant difference between the true mean height of 14-year-old girls and boys?
______________
Explain.
________________________________________________________
Estimate the difference in the height between girls and boys using a 95% confidence interval.______________
Based on your interval, do you think there is a significant difference between the true mean height of 14-year-old girls and boys?
______________
Explain.
________________________________________________________
Unlock Deck
Unlock for access to all 173 flashcards in this deck.
Unlock Deck
k this deck
69
Suppose a 95% confidence interval for the mean height of a 12-year-old male in the United States is 54 to 65 inches. It can be said that 95% of 12-year-old males in the U.S. have height greater than or equal to 54 inches and less than or equal to 65 inches.
Unlock Deck
Unlock for access to all 173 flashcards in this deck.
Unlock Deck
k this deck
70
A study was conducted to compare the mean numbers of police emergency calls per 8-hour shift in two districts of Los Angeles. Samples of 100 8-shifts were randomly selected from the police records for each of the two regions, and the number of emergency calls was recorded for each shift. The sample statistics are listed below: Find a 90% confidence interval for the difference in the mean numbers of police emergency calls per shift between the two districts of the city.
______________
Interpret the interval.
________________________________________________________
Find a 90% confidence interval for the difference in the mean numbers of police emergency calls per shift between the two districts of the city.______________
Interpret the interval.
________________________________________________________
Unlock Deck
Unlock for access to all 173 flashcards in this deck.
Unlock Deck
k this deck
71
An experiment was conducted to compare two diets A and B designed for weight reduction. Two groups of 50 overweight dieters each were randomly selected. One group was placed on diet A and the other on diet B, and their weight losses were recorded over a 30-day period. The means and standard deviations of the weight-loss measurements for the two groups are shown in the table. Find a 95% confidence interval for the difference in mean weight loss for the two diets.
______________
Interpret the interval.
________________________________________________________
Find a 95% confidence interval for the difference in mean weight loss for the two diets.______________
Interpret the interval.
________________________________________________________
Unlock Deck
Unlock for access to all 173 flashcards in this deck.
Unlock Deck
k this deck
72
It is of interest to know if the average time it takes police to reach the scene of an accident differs from that of an ambulance to reach the same accident. Use the summary data listed below where time is in minutes. Estimate the difference in the times between the police and the ambulance using a 99% confidence interval.
______________
Does it appear that the times differ?
______________
Estimate the difference in the times between the police and the ambulance using a 99% confidence interval.______________
Does it appear that the times differ?
______________
Unlock Deck
Unlock for access to all 173 flashcards in this deck.
Unlock Deck
k this deck
73
The lower and upper limits of the 68.26% confidence interval for the population mean , given that n = 49; = 75; and = 7, are 74 and 76, respectively.
, given that n = 49; = 75; and = 7, are 74 and 76, respectively. Unlock Deck
Unlock for access to all 173 flashcards in this deck.
Unlock Deck
k this deck
74
As the sample size increases and other factors are the same, the width of a confidence interval for a population mean tends to decrease.
Unlock Deck
Unlock for access to all 173 flashcards in this deck.
Unlock Deck
k this deck
75
A comparison between the average jail time of bank robbers and car thieves yielded the following results (in years): Estimate ( ), the difference in mean years of jail time.
______________
Find the margin of error for your estimate.
______________
Estimate ( ), the difference in mean years of jail time.______________
Find the margin of error for your estimate.
______________
Unlock Deck
Unlock for access to all 173 flashcards in this deck.
Unlock Deck
k this deck
76
The confidence coefficient is the probability that a confidence interval will enclose the estimated parameter.
Unlock Deck
Unlock for access to all 173 flashcards in this deck.
Unlock Deck
k this deck
77
In order to construct a confidence interval estimate of the population proportion p, the value of p is needed.
Unlock Deck
Unlock for access to all 173 flashcards in this deck.
Unlock Deck
k this deck
78
If the population variance is increased and other factors are the same, the width of a confidence interval for the population mean tends to increase.
Unlock Deck
Unlock for access to all 173 flashcards in this deck.
Unlock Deck
k this deck
79
A 90% confidence interval estimate for a population mean is determined to be 62.8 to 73.4. If the confidence level is reduced to 80%, the confidence interval for becomes narrower.
is determined to be 62.8 to 73.4. If the confidence level is reduced to 80%, the confidence interval for becomes narrower. Unlock Deck
Unlock for access to all 173 flashcards in this deck.
Unlock Deck
k this deck
80
In developing an interval estimate for the population mean , the population standard deviation was assumed to be 6. The interval estimate was 45.0 1.5. Had equaled 12, the interval estimate would be 90 3.
, the population standard deviation was assumed to be 6. The interval estimate was 45.0 1.5. Had equaled 12, the interval estimate would be 90 3. Unlock Deck
Unlock for access to all 173 flashcards in this deck.
Unlock Deck
k this deck
Unlock Deck
Unlock for access to all 173 flashcards in this deck.


