Deck 16: Chi-Square Tests
Full screen (f)
Question
Question
Question
One hundred people were sampled from each of three populations and asked a question.The responses are shown in the table:
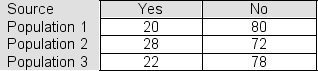 If the three populations represented here contain the same proportion of yes responses, we would have expected to see 23.33 yes responses in each sample.
If the three populations represented here contain the same proportion of yes responses, we would have expected to see 23.33 yes responses in each sample. Question
Question
Question
Two hundred items were sampled from each of two recent shipments.The results are shown in the table:
 If the two shipments contain the same proportion of defective items, we would have expected to see 14 defective items in each sample.
If the two shipments contain the same proportion of defective items, we would have expected to see 14 defective items in each sample. Question
Question
Question
Question
Question
Question
Question
Question
Question
Question
Question
Question
Below is a contingency table showing the results of a survey in which 200 voters were asked to comment on current economic conditions.
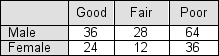 If "view of the economy" is independent of "gender," we would have expected 30% of the male responses to be "good."
If "view of the economy" is independent of "gender," we would have expected 30% of the male responses to be "good." Question
Four hundred people were sampled from each of two populations and asked a question.The responses are shown in the table:
 If the two populations contain the same proportion of yes responses, we would have expected to see 55 yes responses in each sample.
If the two populations contain the same proportion of yes responses, we would have expected to see 55 yes responses in each sample. Question
Question
Below is a contingency table showing the responses in a sample survey in which 200 economists were asked to report their level of confidence that the economy would improve significantly over the next 12 months.The professional affiliation (university or industry) of the economists is also shown.  You are conducting a chi-square test to determine whether "confidence in the economy" is independent of "professional affiliation," at a significance level of 0.05.The chi-square statistic for the test turns out to be 1.042.What is your conclusion?
A)The two factors are not independent.
B)Do not reject the independence null hypothesis.
C)Reject the independence null hypothesis
D)The test results are inconclusive; a larger sample is needed.
E)The economists are evenly split in their responses.
You are conducting a chi-square test to determine whether "confidence in the economy" is independent of "professional affiliation," at a significance level of 0.05.The chi-square statistic for the test turns out to be 1.042.What is your conclusion?A)The two factors are not independent.
B)Do not reject the independence null hypothesis.
C)Reject the independence null hypothesis
D)The test results are inconclusive; a larger sample is needed.
E)The economists are evenly split in their responses.
Question
Question
Question
Question
One thousand people were sampled from each of two populations and asked a question.The responses are shown in the table:  If the two populations contain the same proportion of yes responses, we would have "expected" to see _____ yes responses in each sample.
A)no more than 300
B)350
C)700
D)500
E)240
If the two populations contain the same proportion of yes responses, we would have "expected" to see _____ yes responses in each sample.A)no more than 300
B)350
C)700
D)500
E)240
Question
Two hundred items were sampled from each of two recent shipments.The results are shown in the table:  If the two shipments contain the same proportion of defective items, we would have "expected" to see ______ defective items in each sample.
A)at least 18
B)14
C)no more than 10
D)14.5
E)16
If the two shipments contain the same proportion of defective items, we would have "expected" to see ______ defective items in each sample.A)at least 18
B)14
C)no more than 10
D)14.5
E)16
Question
Question
Question
Question
Question
Question
Question
Question
Below is a contingency table showing the results from a sample survey in which 200 economists were asked to report their level of confidence that the economy would improve significantly over the next 12 months.The professional affiliation (university or industry) of the economists is also shown.  If "confidence in the economy" is independent of "professional affiliation," we would have expected to see ______ of the responses from university affiliated economists be "moderate."
A)20%
B)exactly10
C)no more than 5
D)less than 2
E)100 or more
If "confidence in the economy" is independent of "professional affiliation," we would have expected to see ______ of the responses from university affiliated economists be "moderate."A)20%
B)exactly10
C)no more than 5
D)less than 2
E)100 or more
Question
Question
Question
Question
One hundred CEOs were sampled from each of three industries and asked whether job security was a major concern for their employees.The responses are shown in the table:  If the three CEO populations represented here contain the same proportion of yes responses, how many yes responses should we "expect" to see in each of the three samples of size 100?
A)25.3
B)25
C)23.3
D)24.7
E)24
If the three CEO populations represented here contain the same proportion of yes responses, how many yes responses should we "expect" to see in each of the three samples of size 100?A)25.3
B)25
C)23.3
D)24.7
E)24
Question
Question
Question
Question
Question
Question
Question
Question
Question
Question
Question
Question
Question
Question
Question
Question
Question
Question
Question
Question
Question
Question
Question
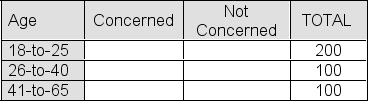
Alpine Research has conducted a survey of online shoppers.Simple random samples of 200 shoppers aged 18-to-25, 100 shoppers aged 26-to-40, and 100 shoppers aged 41-to-65 were selected for the survey.In the 18-to-25 sample, 80 shoppers (40%) expressed concerned about online security.Fifty of the 26-to-40 sample (50%) gave the same response.In the 41-to-65 sample, 66 shoppers (66%) expressed concern about online security. Below is a (partial) table of expected frequencies that you will use to conduct a chi-square test of the null hypothesis that the proportion of shoppers who are concerned about online security is the same in all three populations represented.The significance level for the test will be 5%.Report the critical chi-square value that would be appropriate for your test.
Expected Frequencies
A)5.991
B)7.815
C)12.838
D)3.841
Expected Frequencies
A)5.991
B)7.815
C)12.838
D)3.841
Question
Alpine Research has conducted a survey of online shoppers.Simple random samples of 200 shoppers aged 18-to-25, 100 shoppers aged 26-to-40, and 100 shoppers aged 41-to-65 were selected for the survey.In the 18-to-25 sample, 80 shoppers (40%) expressed concerned about online security.Fifty of the 26-to-40 sample (50%) gave the same response.In the 41-to-65 sample, 66 shoppers (66%) expressed concern about online security. Below is a (partial) table of expected frequencies that you will use to conduct a chi-square test of the null hypothesis that the proportion of shoppers who are concerned about online security is the same in all three populations represented.The significance level for the test will be 5%.What is the p-value for this hypothesis test?
Expected Frequencies

A).0001
B).0425
C).0034
D).0620
Expected Frequencies
A).0001
B).0425
C).0034
D).0620
Question
A sample of 100 colored balls is selected from a large container of red balls and white balls-call it Container A.A second sample, this one of size 200, is selected from another container of red balls and white balls-call it Container B.The table below shows observed results from the two samples. 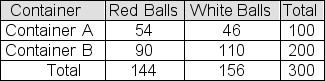 You plan to use a chi-square test to test the null hypothesis that the two containers contain the same proportion of red balls.Report the chi-square test statistic
A)5.227
B)10.034
C)2.163
D)0.028
You plan to use a chi-square test to test the null hypothesis that the two containers contain the same proportion of red balls.Report the chi-square test statisticA)5.227
B)10.034
C)2.163
D)0.028
Question
Question
Question
A random sample of 100 members is selected from the population of UTU union members.A second sample, this one of size 200, is selected from the population of AFB union members.A third sample, also of size 200, is selected from the population of CCO union members.You use your results to fill in the table below showing the number of members in each sample who are satisfied with the representation that their union provides.  You then use a chi-square test to test the null hypothesis that the three union populations represented here contain the same proportion of satisfied members.The significance level for the test is 5%.If the p-value for the sample result turns out to be .1642, what should you conclude?
A)Don't reject the hypothesis that the proportion of satisfied members is not the same in all three union populations.
B)Reject the hypothesis that the proportion of satisfied members is different in the three union populations.
C)The sample provides strong evidence that the proportion of satisfied members is the same in all three union populations.
D)The sample provides strong evidence that the proportion of satisfied members is not the same in all three union populations.
You then use a chi-square test to test the null hypothesis that the three union populations represented here contain the same proportion of satisfied members.The significance level for the test is 5%.If the p-value for the sample result turns out to be .1642, what should you conclude?A)Don't reject the hypothesis that the proportion of satisfied members is not the same in all three union populations.
B)Reject the hypothesis that the proportion of satisfied members is different in the three union populations.
C)The sample provides strong evidence that the proportion of satisfied members is the same in all three union populations.
D)The sample provides strong evidence that the proportion of satisfied members is not the same in all three union populations.
Question
A random sample of 100 members is selected from the population of UTU union members.A second sample, this one of size 200, is selected from the population of AFB union members.A third sample, also of size 200, is selected from the population of CCO union members.The table below shows the number of members in each sample who are satisfied with the representation that their union provides. 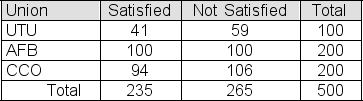 You use a chi-square test to test the null hypothesis that the three union populations represented here contain the same proportion of satisfied members.In a table of "expected frequencies if the null hypothesis is true," what is the expected frequency that should be entered in the "UTU, Satisfied" cell?
A)53
B)94
C)47
D)106
You use a chi-square test to test the null hypothesis that the three union populations represented here contain the same proportion of satisfied members.In a table of "expected frequencies if the null hypothesis is true," what is the expected frequency that should be entered in the "UTU, Satisfied" cell?A)53
B)94
C)47
D)106
Question
Alpine Research has conducted a survey of online shoppers.Simple random samples of 200 shoppers aged 18-to-25, 100 shoppers aged 26-to-40, and 100 shoppers aged 41-to-65 were selected for the survey.In the 18-to-25 sample, 80 shoppers (40%) expressed concerned about online security.Fifty of the 26-to-40 sample (50%) gave the same response.In the 41-to-65 sample, 66 shoppers (66%) expressed concern about online security. Below is a (partial) table of expected frequencies that you will use to conduct a chi-square test of the null hypothesis that the proportion of shoppers who are concerned about online security is the same in all three populations represented.The significance level for the test is 5%.Suppose the p-value for the sample result turns out to be .0001.What should you conclude?
Expected Frequencies

A)The test provides strong evidence that each of the three age categories has a different proportion of concerned shoppers.
B)The test provides strong evidence that the proportion of concerned shoppers is the same for two of the three age categories.
C)The test provides strong evidence that the proportion of concerned shoppers is the same for all three age categories.
D)The test provides strong evidence that the proportion of concerned shoppers is not the same for all three age categories.
Expected Frequencies
A)The test provides strong evidence that each of the three age categories has a different proportion of concerned shoppers.
B)The test provides strong evidence that the proportion of concerned shoppers is the same for two of the three age categories.
C)The test provides strong evidence that the proportion of concerned shoppers is the same for all three age categories.
D)The test provides strong evidence that the proportion of concerned shoppers is not the same for all three age categories.
Question
Question
A random sample of 100 members is selected from the population of UTU union members.A second sample, this one of size 200, is selected from the population of AFB union members.A third sample, also of size 200, is selected from the population of CCO union members.You use your results to fill in the table below showing the number of members in each sample who are satisfied with the representation that their union provides.  You then use a chi-square test to test the null hypothesis that the three union populations represented here contain the same proportion of satisfied members.The significance level for the test is 5%.If he p-value for the sample result turns out to be .0441, what should you conclude?
A)Don't reject the hypothesis that the proportion of satisfied members is not the same in all three union populations.
B)Reject the hypothesis that the proportion of satisfied members is different in the three union populations.
C)The sample provides strong evidence that the proportion of satisfied members is the same in all three union populations.
D)The sample provides strong evidence that the proportion of satisfied members is not the same in all three union populations.
You then use a chi-square test to test the null hypothesis that the three union populations represented here contain the same proportion of satisfied members.The significance level for the test is 5%.If he p-value for the sample result turns out to be .0441, what should you conclude?A)Don't reject the hypothesis that the proportion of satisfied members is not the same in all three union populations.
B)Reject the hypothesis that the proportion of satisfied members is different in the three union populations.
C)The sample provides strong evidence that the proportion of satisfied members is the same in all three union populations.
D)The sample provides strong evidence that the proportion of satisfied members is not the same in all three union populations.
Question
A random sample of 100 members is selected from the population of UTU union members.A second sample, this one of size 200, is selected from the population of AFB union members.A third sample, also of size 200, is selected from the population of CCO union members.The table below shows the number of members in each sample who are satisfied with the representation that their union provides.  You use a chi-square test to test the null hypothesis that the three union populations represented here contain the same proportion of satisfied members.If the significance level is 5%, report the critical chi-square value for your test.
A)5.991
B)9.210
C)2.841
D)7.815
You use a chi-square test to test the null hypothesis that the three union populations represented here contain the same proportion of satisfied members.If the significance level is 5%, report the critical chi-square value for your test.A)5.991
B)9.210
C)2.841
D)7.815
Question
Alpine Research has conducted a survey of online shoppers.Simple random samples of 200 shoppers aged 18-to-25, 100 shoppers aged 26-to-40, and 100 shoppers aged 41-to-65 were selected for the survey.In the 18-to-25 sample, 80 shoppers (40%) expressed concerned about online security.Fifty of the 26-to-40 sample (50%) gave the same response.In the 41-to-65 sample, 66 shoppers (66%) expressed concern about online security. Below is a (partial) table of expected frequencies that you will use to conduct a chi-square test of the null hypothesis that the proportion of shoppers who are concerned about online security is the same for all three populations represented.Find the value of the chi-square test statistic.
Expected Frequencies

A)14.625
B)9.068
C)18.087
D)5.223
Expected Frequencies
A)14.625
B)9.068
C)18.087
D)5.223
Question
A sample of 100 colored balls is selected from a large container of red balls and white balls-call it Container A.A second sample, this one of size 200, is selected from another container of red balls and white balls-call it Container B.The table below shows observed results from the two samples. 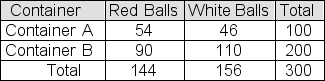 You plan to use a chi-square test to test the null hypothesis that the two containers contain the same proportion of red balls.If the significance level is 1%, report the critical chi-square value that would be appropriate for your test.
A)5.024
B)3.814
C)6.635
D)13.227
You plan to use a chi-square test to test the null hypothesis that the two containers contain the same proportion of red balls.If the significance level is 1%, report the critical chi-square value that would be appropriate for your test.A)5.024
B)3.814
C)6.635
D)13.227
Question
A sample of 100 colored balls is selected from a large container of red balls and white balls-call it Container A.A second sample, this one of size 200, is selected from another container of red balls and white balls-call it Container B.The table below shows observed results from the two samples. 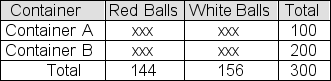 You plan to use a chi-square test to test the null hypothesis that the two containers contain the same proportion of red balls.The significance level for the test will be 1%.Suppose the p-value for the sample result turns out to be .0272.What should you conclude?
A)At a 1% significance level, don't reject the hypothesis that the proportion of red balls is the same in both containers.
B)At a 1% significance level, reject the hypothesis that the proportion of red balls is the same in both containers.
C)The test provides strong evidence that the proportion of red balls is not the same in both containers.
D)The test provides strong evidence that the proportion of red balls is the same in both containers.
You plan to use a chi-square test to test the null hypothesis that the two containers contain the same proportion of red balls.The significance level for the test will be 1%.Suppose the p-value for the sample result turns out to be .0272.What should you conclude?A)At a 1% significance level, don't reject the hypothesis that the proportion of red balls is the same in both containers.
B)At a 1% significance level, reject the hypothesis that the proportion of red balls is the same in both containers.
C)The test provides strong evidence that the proportion of red balls is not the same in both containers.
D)The test provides strong evidence that the proportion of red balls is the same in both containers.
Question
A random sample of 100 members is selected from the population of UTU union members.A second sample, this one of size 200, is selected from the population of AFB union members.A third sample, also of size 200, is selected from the population of CCO union members.The table below shows the number of members in each sample who are satisfied with the representation that their union provides. 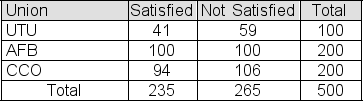 You use a chi-square test to test the null hypothesis that the three union populations represented here contain the same proportion of satisfied members.Report the chi-square test statistic.
A)5.143
B)7.004
C)2.168
D)1.130
You use a chi-square test to test the null hypothesis that the three union populations represented here contain the same proportion of satisfied members.Report the chi-square test statistic.A)5.143
B)7.004
C)2.168
D)1.130
Question
A sample of 100 colored balls is selected from a large container of red balls and white balls-call it Container A.A second sample, this one of size 200, is selected from another container of red balls and white balls-call it Container B.The table below shows observed results from the two samples. 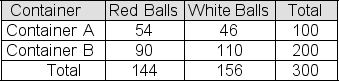 You use a chi-square test to test the null hypothesis that the two containers contain the same proportion of red balls.In a table of "expected frequencies if the null hypothesis is true," what is the expected frequency that should be entered in the "Container A, Red Balls" cell?
A)48
B)96
C)52
D)104
You use a chi-square test to test the null hypothesis that the two containers contain the same proportion of red balls.In a table of "expected frequencies if the null hypothesis is true," what is the expected frequency that should be entered in the "Container A, Red Balls" cell?A)48
B)96
C)52
D)104
Question
A sample of 100 colored balls is selected from a large container of red balls and white balls-call it Container A.A second sample, this one of size 200, is selected from another container of red balls and white balls-call it Container B.The table below shows observed results from the two samples. 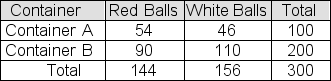 You plan to use a chi-square test to test the null hypothesis that the two containers contain the same proportion of red balls.Report the p-value that would be appropriate for your test.(You will need a statistical calculator.)
A)0.2631
B)0.1413
C)0.0667
D)0.1015
You plan to use a chi-square test to test the null hypothesis that the two containers contain the same proportion of red balls.Report the p-value that would be appropriate for your test.(You will need a statistical calculator.)A)0.2631
B)0.1413
C)0.0667
D)0.1015
Question
Alpine Research has conducted a survey of online shoppers.Simple random samples of 200 shoppers aged 18-to-25, 100 shoppers aged 26-to-40, and 100 shoppers aged 41-to-65 were selected for the survey.In the 18-to-25 sample, 80 shoppers (40%) expressed concerned about online security.Fifty of the 26-to-40 sample (50%) gave the same response.In the 41-to-65 sample, 66 shoppers (66%) expressed concern about online security. Below is a (partial) table of expected frequencies that you will use to conduct a chi-square test of the null hypothesis that the proportion of shoppers who are concerned about online security is the same in all three populations represented.What is the expected frequency that you should show in the "18-to-25, Concerned" cell of the table?
Expected Frequencies

A)40
B)98
C)80
D)120
Expected Frequencies
A)40
B)98
C)80
D)120
Question
Alpine Research has conducted a survey of online shoppers.Simple random samples of 200 shoppers aged 18-to-25, 100 shoppers aged 26-to-40, and 100 shoppers aged 41-to-65 were selected for the survey.Shoppers in each of the three samples were asked whether they were concerned about online security when shopping. You use the survey results to conduct a chi-square test of the null hypothesis that the proportion of shoppers who are concerned about online security is the same in all three populations represented.The significance level for the test is 5%.Suppose the p-value for the sample result turns out to be .1072.What should you conclude?
Expected Frequencies

A)Don't reject the hypothesis that the proportion of concerned shoppers is the same in all three age categories.
B)Reject the hypothesis that the proportion of concerned shoppers is the same in all three age categories.
C)The test provides strong evidence that the proportion of concerned shoppers is not the same in all three age categories.
D)The test provides strong evidence that the proportion of concerned shoppers is the same in all three age categories.
Expected Frequencies
A)Don't reject the hypothesis that the proportion of concerned shoppers is the same in all three age categories.
B)Reject the hypothesis that the proportion of concerned shoppers is the same in all three age categories.
C)The test provides strong evidence that the proportion of concerned shoppers is not the same in all three age categories.
D)The test provides strong evidence that the proportion of concerned shoppers is the same in all three age categories.
Question
A random sample of 100 members is selected from the population of UTU union members.A second sample, this one of size 200, is selected from the population of AFB union members.A third sample, also of size 200, is selected from the population of CCO union members.The table below shows the number of members in each sample who are satisfied with the representation that their union provides.  You use a chi-square test to test the null hypothesis that the three union populations represented here contain the same proportion of satisfied members.Report the p-value that for your test.(You will need a statistical calculator.)
A).217
B).141
C).338
D).102
You use a chi-square test to test the null hypothesis that the three union populations represented here contain the same proportion of satisfied members.Report the p-value that for your test.(You will need a statistical calculator.)A).217
B).141
C).338
D).102

Unlock Deck
Sign up to unlock the cards in this deck!
Unlock Deck
Unlock Deck
1/145
Play
Full screen (f)
Deck 16: Chi-Square Tests
1
To compute a pooled sample proportion, each of the sample proportions is weighted by the size of the population from which the sample was selected.
False
2
The degrees of freedom for in a test of independence involving a contingency table with 10 rows and 11 columns are 90.
True
3
One hundred people were sampled from each of three populations and asked a question.The responses are shown in the table:
If the three populations represented here contain the same proportion of yes responses, we would have expected to see 23.33 yes responses in each sample.
If the three populations represented here contain the same proportion of yes responses, we would have expected to see 23.33 yes responses in each sample.True
4
The degrees of freedom for a test of independence involving a contingency table with 10 rows and 8 columns are 63.
Unlock Deck
Unlock for access to all 145 flashcards in this deck.
Unlock Deck
k this deck
5
In a chi-square calculation involving 6 independent terms (that is, with df = 6), there is a 5% probability that the result will be less than 1.635.
Unlock Deck
Unlock for access to all 145 flashcards in this deck.
Unlock Deck
k this deck
6
Two hundred items were sampled from each of two recent shipments.The results are shown in the table:
If the two shipments contain the same proportion of defective items, we would have expected to see 14 defective items in each sample.
If the two shipments contain the same proportion of defective items, we would have expected to see 14 defective items in each sample. Unlock Deck
Unlock for access to all 145 flashcards in this deck.
Unlock Deck
k this deck
7
The table-based approach to testing for differences in population proportions yields more accurate results than the squared standardized normal random variable approach.
Unlock Deck
Unlock for access to all 145 flashcards in this deck.
Unlock Deck
k this deck
8
Samples of equal size have been selected from each of three populations, producing sample proportions of 0.4, 0.3, and 0.5.To compute a pooled sample proportion, we can compute the simple average of the three sample proportions.
Unlock Deck
Unlock for access to all 145 flashcards in this deck.
Unlock Deck
k this deck
9
Samples of equal size have been selected from each of three populations, producing sample proportions of 0.4, 0.3, and 0.5.To compute a pooled sample proportion, each of the sample proportions is weighted by size of the population from which the sample was selected.
Unlock Deck
Unlock for access to all 145 flashcards in this deck.
Unlock Deck
k this deck
10
The degrees of freedom for test of independence involving a contingency table with 12 rows and 12 columns are 144.
Unlock Deck
Unlock for access to all 145 flashcards in this deck.
Unlock Deck
k this deck
11
In a chi-square distribution, 2 is the sum of squared standardized normal random variables with degrees of freedom equal to the number of independent terms included in the sum.
Unlock Deck
Unlock for access to all 145 flashcards in this deck.
Unlock Deck
k this deck
12
In a chi-square test of proportion differences, we will reject the "all proportions are equal" null hypothesis if the p-value for the chi-square statistic is less than the significance level for the test.
Unlock Deck
Unlock for access to all 145 flashcards in this deck.
Unlock Deck
k this deck
13
Samples of equal size have been selected from each of three populations, producing sample proportions of 0.5, 0.7, and 0.6.The pooled sample proportion would be 0.65.
Unlock Deck
Unlock for access to all 145 flashcards in this deck.
Unlock Deck
k this deck
14
The degrees of freedom in a goodness of fit test for a multinomial distribution with 5 categories are 4.
Unlock Deck
Unlock for access to all 145 flashcards in this deck.
Unlock Deck
k this deck
15
In a chi-square calculation involving 5 independent terms (that is, with df = 5),
there is a 5% probability that the result will be greater than 16.750.
there is a 5% probability that the result will be greater than 16.750.
Unlock Deck
Unlock for access to all 145 flashcards in this deck.
Unlock Deck
k this deck
16
The degrees of freedom in a goodness of fit test for a multinomial distribution with 5 categories are (5 − 2) = 3.
Unlock Deck
Unlock for access to all 145 flashcards in this deck.
Unlock Deck
k this deck
17
In a chi-square calculation involving 3 independent terms (that is, with df = 3),
there is a 5% probability that the result will be greater than 7.815.
there is a 5% probability that the result will be greater than 7.815.
Unlock Deck
Unlock for access to all 145 flashcards in this deck.
Unlock Deck
k this deck
18
Below is a contingency table showing the results of a survey in which 200 voters were asked to comment on current economic conditions.
If "view of the economy" is independent of "gender," we would have expected 30% of the male responses to be "good."
If "view of the economy" is independent of "gender," we would have expected 30% of the male responses to be "good." Unlock Deck
Unlock for access to all 145 flashcards in this deck.
Unlock Deck
k this deck
19
Four hundred people were sampled from each of two populations and asked a question.The responses are shown in the table:
If the two populations contain the same proportion of yes responses, we would have expected to see 55 yes responses in each sample.
If the two populations contain the same proportion of yes responses, we would have expected to see 55 yes responses in each sample. Unlock Deck
Unlock for access to all 145 flashcards in this deck.
Unlock Deck
k this deck
20
In a chi-square test regarding the equality of 3 population proportions, we should form the null and alternative hypotheses as follows:
H0: 1 = 2 = 3 (All three proportions are equal.)
Ha: 1 ≠ 2 ≠ 3 (All three proportions are different.)
H0: 1 = 2 = 3 (All three proportions are equal.)
Ha: 1 ≠ 2 ≠ 3 (All three proportions are different.)
Unlock Deck
Unlock for access to all 145 flashcards in this deck.
Unlock Deck
k this deck
21
Below is a contingency table showing the responses in a sample survey in which 200 economists were asked to report their level of confidence that the economy would improve significantly over the next 12 months.The professional affiliation (university or industry) of the economists is also shown. You are conducting a chi-square test to determine whether "confidence in the economy" is independent of "professional affiliation," at a significance level of 0.05.The chi-square statistic for the test turns out to be 1.042.What is your conclusion?
A)The two factors are not independent.
B)Do not reject the independence null hypothesis.
C)Reject the independence null hypothesis
D)The test results are inconclusive; a larger sample is needed.
E)The economists are evenly split in their responses.
You are conducting a chi-square test to determine whether "confidence in the economy" is independent of "professional affiliation," at a significance level of 0.05.The chi-square statistic for the test turns out to be 1.042.What is your conclusion?A)The two factors are not independent.
B)Do not reject the independence null hypothesis.
C)Reject the independence null hypothesis
D)The test results are inconclusive; a larger sample is needed.
E)The economists are evenly split in their responses.
Unlock Deck
Unlock for access to all 145 flashcards in this deck.
Unlock Deck
k this deck
22
In a goodness of fit test for a multinomial population, the null hypothesis is that:
A)the sample proportions for each possible response take particular values.
B)the population proportions for each possible response take particular values
C)the sample proportions for each possible response are equal to one another.
D)the population proportions for each possible response are equal to one another.
Unlock Deck
Unlock for access to all 145 flashcards in this deck.
Unlock Deck
k this deck
23
Samples of equal size have been selected from each of three populations, producing sample proportions of 0.42, 0.38, and 0.52.The pooled sample proportion here would be
A)0.435
B)0.44
C)0.465
D)0.45
E)It cannot determined from the information given.
A)0.435
B)0.44
C)0.465
D)0.45
E)It cannot determined from the information given.
Unlock Deck
Unlock for access to all 145 flashcards in this deck.
Unlock Deck
k this deck
24
The expected frequency in a goodness of fit test for a multinomial population is calculated by:
A)multiplying the hypothesized category probability by the sample size.
B)multiplying the observed frequency by the category probability.
C)dividing the observed frequency by the sample size.
D)adding five to the observed frequency.
E)none of the above.
A)multiplying the hypothesized category probability by the sample size.
B)multiplying the observed frequency by the category probability.
C)dividing the observed frequency by the sample size.
D)adding five to the observed frequency.
E)none of the above.
Unlock Deck
Unlock for access to all 145 flashcards in this deck.
Unlock Deck
k this deck
25
One thousand people were sampled from each of two populations and asked a question.The responses are shown in the table: If the two populations contain the same proportion of yes responses, we would have "expected" to see _____ yes responses in each sample.
A)no more than 300
B)350
C)700
D)500
E)240
If the two populations contain the same proportion of yes responses, we would have "expected" to see _____ yes responses in each sample.A)no more than 300
B)350
C)700
D)500
E)240
Unlock Deck
Unlock for access to all 145 flashcards in this deck.
Unlock Deck
k this deck
26
Two hundred items were sampled from each of two recent shipments.The results are shown in the table: If the two shipments contain the same proportion of defective items, we would have "expected" to see ______ defective items in each sample.
A)at least 18
B)14
C)no more than 10
D)14.5
E)16
If the two shipments contain the same proportion of defective items, we would have "expected" to see ______ defective items in each sample.A)at least 18
B)14
C)no more than 10
D)14.5
E)16
Unlock Deck
Unlock for access to all 145 flashcards in this deck.
Unlock Deck
k this deck
27
Which of the following is NOT one of the steps for conducting a chi-square goodness-of-fit test for a multinomial population?
A)state the null and alternative hypotheses.
B)select a random sample and record the observed frequencies.
C)determine the expected frequency for each category by multiplying the hypothesized category probability by the sample size.
D)compute the value of the test statistic.
E)none of the above; all are steps.
Unlock Deck
Unlock for access to all 145 flashcards in this deck.
Unlock Deck
k this deck
28
Which of the following is NOT one of the steps for conducting a chi-square test of the equality of population proportions?
A)pool the sample proportions.
B)compute each of the sample z scores.
C)divide each of the sample z-scores by its sample size.
D)calculate the sample chi-square value.
E)compare the sample chi-square value to the critical chi-square value.
A)pool the sample proportions.
B)compute each of the sample z scores.
C)divide each of the sample z-scores by its sample size.
D)calculate the sample chi-square value.
E)compare the sample chi-square value to the critical chi-square value.
Unlock Deck
Unlock for access to all 145 flashcards in this deck.
Unlock Deck
k this deck
29
The number of degrees of freedom for the appropriate chi-square distribution in a test of independence is
A)k (n − 1)
B)k-1
C)(number of rows - 1) * (number of columns - 1)
D)a chi-square distribution is not used in a test of independence
E)none of the above
A)k (n − 1)
B)k-1
C)(number of rows - 1) * (number of columns - 1)
D)a chi-square distribution is not used in a test of independence
E)none of the above
Unlock Deck
Unlock for access to all 145 flashcards in this deck.
Unlock Deck
k this deck
30
In a chi-square test for the equality of three population proportions, the appropriate null and alternative hypotheses are
A)H0: 1 = 2 = 3 Ha: 1 ≠ 2 ≠ 3
B)H0: 1 < 2 < 3 Ha: 1 > 2 > 3
C)H0: 1 = 2 = 3 Ha: 1 ≠ 2 and 2 ≠ 3
D)H0: 1 = 2 = 3 Ha: 1 ≠ 2 or 2 ≠ 3
E)None of the above
A)H0: 1 = 2 = 3 Ha: 1 ≠ 2 ≠ 3
B)H0: 1 < 2 < 3 Ha: 1 > 2 > 3
C)H0: 1 = 2 = 3 Ha: 1 ≠ 2 and 2 ≠ 3
D)H0: 1 = 2 = 3 Ha: 1 ≠ 2 or 2 ≠ 3
E)None of the above
Unlock Deck
Unlock for access to all 145 flashcards in this deck.
Unlock Deck
k this deck
31
When conducting a goodness of fit test for a normal distribution, which of the following is NOT done:
A)the null hypothesis is that the population has the specified normal distribution.
B)compute the mean and standard deviation of the sample.
C)define an interval of values such that the expected frequency is at least 5 in each interval.
D)record the expected frequencies for each interval using a histogram
E)reject the null hypothesis if the p-value <
Unlock Deck
Unlock for access to all 145 flashcards in this deck.
Unlock Deck
k this deck
32
In order not to violate the requirements necessary to use the chi-square distribution, each expected frequency in a goodness of fit test must be
A)at least 5
B)at least 10
C)no more than 5
D)less than 2
E)100 or more
A)at least 5
B)at least 10
C)no more than 5
D)less than 2
E)100 or more
Unlock Deck
Unlock for access to all 145 flashcards in this deck.
Unlock Deck
k this deck
33
To compute a pooled sample proportion, each of the sample proportions is weighted by
A)the size of the population from which the sample was selected
B)the total size of the three samples
C)the size of the sample associated with that sample proportion
D)the average size of the samples
E)the same value
A)the size of the population from which the sample was selected
B)the total size of the three samples
C)the size of the sample associated with that sample proportion
D)the average size of the samples
E)the same value
Unlock Deck
Unlock for access to all 145 flashcards in this deck.
Unlock Deck
k this deck
34
Below is a contingency table showing the results from a sample survey in which 200 economists were asked to report their level of confidence that the economy would improve significantly over the next 12 months.The professional affiliation (university or industry) of the economists is also shown. If "confidence in the economy" is independent of "professional affiliation," we would have expected to see ______ of the responses from university affiliated economists be "moderate."
A)20%
B)exactly10
C)no more than 5
D)less than 2
E)100 or more
If "confidence in the economy" is independent of "professional affiliation," we would have expected to see ______ of the responses from university affiliated economists be "moderate."A)20%
B)exactly10
C)no more than 5
D)less than 2
E)100 or more
Unlock Deck
Unlock for access to all 145 flashcards in this deck.
Unlock Deck
k this deck
35
Samples of size 300, 400, and 200 have been selected from each of three large populations, producing sample proportions of 0.4, 0.3, and 0.5 respectively.The pooled sample proportion here would be
A)0.413
B)0.378
C)0.453
D)0.383
E)0.397
A)0.413
B)0.378
C)0.453
D)0.383
E)0.397
Unlock Deck
Unlock for access to all 145 flashcards in this deck.
Unlock Deck
k this deck
36
In a chi-square test of proportion differences, we will reject the "all proportions are equal" null hypothesis if
A)the p-value for the chi-square statistic is greater than the significance level for the test.
B)the chi-square statistic is greater than 1.96
C)the chi-square statistic is less than the critical chi-square value.
D)the p-value indicates that a Type I error is not possible
E)the p-value for the chi-square statistic is less than the significance level for the test.
Unlock Deck
Unlock for access to all 145 flashcards in this deck.
Unlock Deck
k this deck
37
The expected frequency in a test of independence is calculated as
A)(row total − 1) (column total - 1)/(grand total - 1)
B)(row total)(column total/grand total)
C)cell value/row total
D)cell value/grand total
E)none of the above
A)(row total − 1) (column total - 1)/(grand total - 1)
B)(row total)(column total/grand total)
C)cell value/row total
D)cell value/grand total
E)none of the above
Unlock Deck
Unlock for access to all 145 flashcards in this deck.
Unlock Deck
k this deck
38
One hundred CEOs were sampled from each of three industries and asked whether job security was a major concern for their employees.The responses are shown in the table: If the three CEO populations represented here contain the same proportion of yes responses, how many yes responses should we "expect" to see in each of the three samples of size 100?
A)25.3
B)25
C)23.3
D)24.7
E)24
If the three CEO populations represented here contain the same proportion of yes responses, how many yes responses should we "expect" to see in each of the three samples of size 100?A)25.3
B)25
C)23.3
D)24.7
E)24
Unlock Deck
Unlock for access to all 145 flashcards in this deck.
Unlock Deck
k this deck
39
In a chi-square calculation involving 9 independent terms (that is, with df = 9), there is a 5% probability that the result will be less than _______.
A)15.507
B)16.919
C)3.325
D)2.180
E)23.589
A)15.507
B)16.919
C)3.325
D)2.180
E)23.589
Unlock Deck
Unlock for access to all 145 flashcards in this deck.
Unlock Deck
k this deck
40
Samples of equal size have been selected from each of three populations, producing sample proportions of 0.5, 0.7, and 0.6.The pooled sample proportion would be
A)0.625
B)0.575
C)0.600
D)0.550
E)0.650
A)0.625
B)0.575
C)0.600
D)0.550
E)0.650
Unlock Deck
Unlock for access to all 145 flashcards in this deck.
Unlock Deck
k this deck
41
In a survey of 500 randomly selected corporate CEOs and 1000 randomly selected small business owners, 160 of the CEOs and 260 of the small business owners cited government over-regulation as a significant problem. You use a chi-square test to test the hypothesis that the proportion of individuals who hold this opinion is the same in both populations represented here.What is the p-value for the sample result? (You'll need a statistical calculator.)
A).0325
B).1002
C).0147
D).0273
A).0325
B).1002
C).0147
D).0273
Unlock Deck
Unlock for access to all 145 flashcards in this deck.
Unlock Deck
k this deck
42
In a survey of 500 randomly selected corporate CEOs and 1000 randomly selected small business owners, 160 of the CEOs and 260 of the small business owners cited government over-regulation as a significant problem. You use a chi-square test to test the hypothesis that the proportion of individuals who hold this opinion is the same in the two populations represented here.Report the chi-square test statistic.
A)3.12
B)5.95
C)6.82
D)4.21
A)3.12
B)5.95
C)6.82
D)4.21
Unlock Deck
Unlock for access to all 145 flashcards in this deck.
Unlock Deck
k this deck
43
A recent study measured the proportion of business school faculty who engage in outside consulting.Four samples, each composed of 100 randomly selected faculty members, were used to represent four types of institutions: large four-year state schools, small four-year state schools, large four-year private schools, and small four-year private schools.In the sample of 100 faculty from large state schools, 30 reported such consulting jobs (30%), as compared to 24 (24%) in the sample of faculty from small state schools.In the large private school sample, the number was 42 (42%), as compared to 32 (32%) in the sample of faculty from small private schools. You use the chi-square distribution to test the hypothesis that the proportion of faculty who engage in outside consulting is the same across all four institutional categories.What is the value of the chi-square test statistic?
A)7.72
B)5.41
C)6.39
D)9.26
A)7.72
B)5.41
C)6.39
D)9.26
Unlock Deck
Unlock for access to all 145 flashcards in this deck.
Unlock Deck
k this deck
44
A recent study measured the proportion of business school faculty who engage in outside consulting.Four samples, each composed of 100 randomly selected faculty members, were used to represent four types of institutions: large four-year state schools, small four-year state schools, large four-year private schools, and small four-year private schools.In the sample of 100 faculty from large state schools, 30 reported such outside consulting (30%), as compared to 24 (24%) in the sample of faculty from small state schools.In the large private school sample, the number was 42 (42%), as compared to 32 (32%) in the sample of faculty from small private schools. You will use the chi-square distribution to test the hypothesis that the proportion of faculty who engage in outside consulting is the same across all four institutional categories.The p-value for the sample result turns out to be .0522.If the significance level for the test is 1%, what should you conclude?
A)The sample provides strong evidence that the proportion of all state voters who oppose construction of the refinery is the same in all three states.
B)The sample provides strong evidence that the proportion of all state voters who oppose construction of the refinery is not the same in all three states.
C)At a 1% significance level, you can't reject the hypothesis that the proportion of all state voters who oppose construction of the refinery is the same in all three states.
D)At a 1% significance level, you can't accept the hypothesis that the proportion of all state voters who support construction of the refinery is the same in all three states.
Unlock Deck
Unlock for access to all 145 flashcards in this deck.
Unlock Deck
k this deck
45
In a chi-square distribution with df = 8, 1% of the values will be greater than ________.
A)13.362
B)3.490
C)21.955
D)20.090
A)13.362
B)3.490
C)21.955
D)20.090
Unlock Deck
Unlock for access to all 145 flashcards in this deck.
Unlock Deck
k this deck
46
In a survey of 500 randomly selected corporate CEOs and 1000 randomly selected small business owners, a minority of both the CEOs and the small business owners sampled cited government over-regulation as a significant problem. You use a chi-square test to test the hypothesis that the proportion of individuals who hold this opinion is the same in both populations represented here.The p-value for the sample result turns out to be 0.0831.If the significance level for the test is 5%, what should you conclude?
A)The proportion of individuals who hold this opinion is the same in both populations.
B)The proportion of individuals who hold this opinion is not the same in both populations.
C)You can't reject the hypothesis that the proportion of individuals who hold this opinion is the same in both populations.
D)You can't accept the hypothesis that the proportion of individuals who hold this opinion is not the same for both populations.
Unlock Deck
Unlock for access to all 145 flashcards in this deck.
Unlock Deck
k this deck
47
Ballantine Venture Capital recently conducted a survey regarding the success rates of start-up businesses across four industries.A sample of 200 start-ups was selected from each of the industries and the success rate in each sample was determined.The success rates in the samples from the four industries were 0.64, 0.72,, 0.68; and 0.56, respectively. At a 5% significance level, you use the chi-square distribution to test the hypothesis that success rate of start-ups is the same across the four industries.What is the p-value for this test? (You will need a statistical calculator.)
A).0312
B).0064
C).0137
D).0622
A).0312
B).0064
C).0137
D).0622
Unlock Deck
Unlock for access to all 145 flashcards in this deck.
Unlock Deck
k this deck
48
Ballantine Venture Capital recently conducted a survey regarding the success rates of start-up businesses across four industries.A sample of 200 start-ups was selected from each of the industries and the success rate in each sample was determined.The success rates in the samples from the four industries were 0.64, 0.72,, 0.68; and 0.56, respectively. At a 5% significance level, you use the chi-square distribution to test the hypothesis that success rate is the same for all four start-up categories.The p-value for the sample result turns out to be .0064.What should you conclude?
A)The test provides strong evidence that each of the four industries has a different success rate.
B)The test provides strong evidence that the proportion of successful start-ups is the same in two of the four industries.
C)The test provides strong evidence that the proportion of successful start-ups is the same in all four industries.
D)The test provides strong evidence that the proportion of successful start-ups is not the same in all four industries.
Unlock Deck
Unlock for access to all 145 flashcards in this deck.
Unlock Deck
k this deck
49
Ballantine Venture Capital recently conducted a survey regarding the success rates of start-up businesses across four industries.A sample of 200 start-ups was selected from each of the industries and the success rate in each sample was determined.The success rates in the samples from the four industries were 0.64, 0.72,, 0.68; and 0.56, respectively. At a 5% significance level, you use the chi-square distribution to test the hypothesis that success rate of start-ups is the same across the four industries.What is the critical chi-square value for the test?
A)5.991
B)9.210
C)6.257
D)7.815
A)5.991
B)9.210
C)6.257
D)7.815
Unlock Deck
Unlock for access to all 145 flashcards in this deck.
Unlock Deck
k this deck
50
Costa-Gravis Energy is testing the political climate for building a new oil refining facility in three north central states: North Dakota, South Dakota and Minnesota.The company has randomly selected a sample of 100 registered voters in each state to determine the proportion of state voters who would strongly oppose the construction.In the North Dakota sample, the proportion strongly opposing construction turns out to be 0.26; in the South Dakota sample, the proportion is 0.17; and in the Minnesota sample, it is 0.28. You use the chi-square distribution to test the hypothesis that the proportion of all voters who would strongly oppose construction is the same across the three states.What is the value of the chi-square test statistic?
A)3.80
B)5.22
C)6.87
D)4.21
A)3.80
B)5.22
C)6.87
D)4.21
Unlock Deck
Unlock for access to all 145 flashcards in this deck.
Unlock Deck
k this deck
51
Costa-Gravis Energy is testing the political climate for building a new oil refining facility in three north central states: North Dakota, South Dakota and Minnesota.The company has randomly selected a sample of 100 registered voters in each state to determine the proportion of state voters who would strongly oppose the construction.A minority of voters in each of the three samples expressed opposition to construction of the facility. You use the chi-square distribution to test the hypothesis that the proportion of all voters who would strongly opposed construction is the same across the three states.Suppose the p-value for the sample result turns out to be .0015.If the significance level for the test is 1%, what should you conclude?
A)The sample provides strong evidence that the proportion of all state voters who would strongly oppose construction of the refinery is the same in all three states.
B)The sample provides strong evidence that the proportion of all state voters who would strongly oppose construction of the refinery is not the same in all three states.
C)You can't reject the hypothesis that the proportion of all state voters who would strongly oppose construction of the refinery is the same in all three states.
D)You can't accept the hypothesis that the proportion of all state voters who would support construction of the refinery is the same in all three states.
Unlock Deck
Unlock for access to all 145 flashcards in this deck.
Unlock Deck
k this deck
52
In a survey of 500 randomly selected corporate CEOs and 1000 randomly selected small business owners, 160 of the CEOs and 260 of the small business owners cited government over-regulation as a significant problem. At a 5% significance level, use a chi-square test to test the hypothesis that the proportion of individuals who hold this opinion is the same in both populations represented here.What is the critical chi-square value for the test?
A)2.671
B)4.413
C)8.960
D)3.841
A)2.671
B)4.413
C)8.960
D)3.841
Unlock Deck
Unlock for access to all 145 flashcards in this deck.
Unlock Deck
k this deck
53
A recent study measured the proportion of business school faculty who engage in outside consulting.Four samples, each composed of 100 randomly selected faculty members, were used to represent four types of institutions: large four-year state schools, small four-year state schools, large four-year private schools, and small four-year private schools.In the sample of 100 faculty from large state schools, 30 reported such outside consulting (30%), as compared to 24 (24%) in the sample of faculty from small state schools.In the large private school sample, the number was 42 (42%), as compared to 32 (32%) in the sample of faculty from small private schools. You will use the chi-square distribution to test the hypothesis that the proportion of faculty who engage in outside consulting is the same across all four institutional categories.What is the p-value for the test.(You will need a statistical calculator.)
A).0016
B).0702
C).0522
D).0314
A).0016
B).0702
C).0522
D).0314
Unlock Deck
Unlock for access to all 145 flashcards in this deck.
Unlock Deck
k this deck
54
Use a statistical calculator to find the percentage of values in a chi-square distribution with df = 5 that are greater than 13.45.
A).1008
B).0634
C).0027
D).0195
A).1008
B).0634
C).0027
D).0195
Unlock Deck
Unlock for access to all 145 flashcards in this deck.
Unlock Deck
k this deck
55
Use a statistical calculator to find the percentage of values in a chi-square distribution with df = 6 that are greater than 7.83.
A).2508
B).1366
C).2251
D).1872
A).2508
B).1366
C).2251
D).1872
Unlock Deck
Unlock for access to all 145 flashcards in this deck.
Unlock Deck
k this deck
56
In a chi-square distribution with df = 4, 5% of the values will be greater than ________.
A)11.143
B)9.488
C)14.860
D)11.070
A)11.143
B)9.488
C)14.860
D)11.070
Unlock Deck
Unlock for access to all 145 flashcards in this deck.
Unlock Deck
k this deck
57
Costa-Gravis Energy is testing the political climate for building a new oil refining facility in three north central states: North Dakota, South Dakota and Minnesota.The company has randomly selected a sample of 100 registered voters in each state to determine the proportion of state voters who would strongly oppose the construction.In the North Dakota sample, the proportion strongly opposing construction turns out to be 0.26; in the South Dakota sample, the proportion is 0.17; and in the Minnesota sample, it is 0.28. You use the chi-square distribution to test the hypothesis that the proportion of all voters who would strongly oppose construction is the same across the three states.Report the p-value for the sample result.(You'll need a statistical calculator.)
A).0339
B).0942
C).1026
D).1490
A).0339
B).0942
C).1026
D).1490
Unlock Deck
Unlock for access to all 145 flashcards in this deck.
Unlock Deck
k this deck
58
Ballantine Venture Capital recently conducted a survey regarding the success rates of start-up businesses across four industries.A sample of 200 start-ups was selected from each of the industries and the success rate in each sample was determined.The success rates in the samples from the four industries were 0.64, 0.72,, 0.68; and 0.56, respectively. At a 5% significance level, you use the chi-square distribution to test the hypothesis that success rate of start-ups is the same across the four industries.Report the value of the chi-square test statistic.
A)9.425
B)12.308
C)8.662
D)15.493
A)9.425
B)12.308
C)8.662
D)15.493
Unlock Deck
Unlock for access to all 145 flashcards in this deck.
Unlock Deck
k this deck
59
Costa-Gravis Energy is testing the political climate for building a new oil refining facility in three north central states: North Dakota, South Dakota and Minnesota.The company has randomly selected a sample of 100 registered voters in each state to determine the proportion of state voters who would strongly oppose the construction.In the North Dakota sample, the proportion strongly opposing construction turns out to be 0.26; in the South Dakota sample, the proportion is 0.17; and in the Minnesota sample, it is 0.28. You use the chi-square distribution to test the hypothesis that the proportion of all voters who would strongly oppose construction is the same across the three states.The significance level for the test will be 5%.Report the critical chi-square value for the test.
A)3.841
B)10.597
C)5.991
A)3.841
B)10.597
C)5.991
Unlock Deck
Unlock for access to all 145 flashcards in this deck.
Unlock Deck
k this deck
60
A recent study measured the proportion of business school faculty who engage in outside consulting.Four samples, each composed of 100 randomly selected faculty members, were used to represent four types of institutions: large four-year state schools, small four-year state schools, large four-year private schools, and small four-year private schools.In the sample of 100 faculty from large state schools, 30 reported such outside consulting (30%), as compared to 24 (24%) in the sample of faculty from small state schools.In the large private school sample, the number was 42 (42%), as compared to 32 (32%) in the sample of faculty from small private schools. You use the chi-square distribution to test the hypothesis that the proportion of faculty who engage in outside consulting is the same across all four institutional categories.The significance level for the test is 1%.Report the critical chi-square value for the test.
A)5.991
B)9.210
C)6.257
D)11.345
A)5.991
B)9.210
C)6.257
D)11.345
Unlock Deck
Unlock for access to all 145 flashcards in this deck.
Unlock Deck
k this deck
61
Alpine Research has conducted a survey of online shoppers.Simple random samples of 200 shoppers aged 18-to-25, 100 shoppers aged 26-to-40, and 100 shoppers aged 41-to-65 were selected for the survey.In the 18-to-25 sample, 80 shoppers (40%) expressed concerned about online security.Fifty of the 26-to-40 sample (50%) gave the same response.In the 41-to-65 sample, 66 shoppers (66%) expressed concern about online security. Below is a (partial) table of expected frequencies that you will use to conduct a chi-square test of the null hypothesis that the proportion of shoppers who are concerned about online security is the same in all three populations represented.The significance level for the test will be 5%.Report the critical chi-square value that would be appropriate for your test.
Expected Frequencies
A)5.991
B)7.815
C)12.838
D)3.841
Expected Frequencies
A)5.991
B)7.815
C)12.838
D)3.841
Unlock Deck
Unlock for access to all 145 flashcards in this deck.
Unlock Deck
k this deck
62
Alpine Research has conducted a survey of online shoppers.Simple random samples of 200 shoppers aged 18-to-25, 100 shoppers aged 26-to-40, and 100 shoppers aged 41-to-65 were selected for the survey.In the 18-to-25 sample, 80 shoppers (40%) expressed concerned about online security.Fifty of the 26-to-40 sample (50%) gave the same response.In the 41-to-65 sample, 66 shoppers (66%) expressed concern about online security. Below is a (partial) table of expected frequencies that you will use to conduct a chi-square test of the null hypothesis that the proportion of shoppers who are concerned about online security is the same in all three populations represented.The significance level for the test will be 5%.What is the p-value for this hypothesis test?
Expected Frequencies
A).0001
B).0425
C).0034
D).0620
Expected Frequencies
A).0001
B).0425
C).0034
D).0620
Unlock Deck
Unlock for access to all 145 flashcards in this deck.
Unlock Deck
k this deck
63
A sample of 100 colored balls is selected from a large container of red balls and white balls-call it Container A.A second sample, this one of size 200, is selected from another container of red balls and white balls-call it Container B.The table below shows observed results from the two samples. You plan to use a chi-square test to test the null hypothesis that the two containers contain the same proportion of red balls.Report the chi-square test statistic
A)5.227
B)10.034
C)2.163
D)0.028
You plan to use a chi-square test to test the null hypothesis that the two containers contain the same proportion of red balls.Report the chi-square test statisticA)5.227
B)10.034
C)2.163
D)0.028
Unlock Deck
Unlock for access to all 145 flashcards in this deck.
Unlock Deck
k this deck
64
In its most recent annual report, the US Chamber of Commerce compared the economic climate for small businesses in three regions of the country by asking a randomly selected sample of 100 small business owners from each region to rate the business climate in their region.In the Southeast sample, there were 64 owners who rated the climate as "strongly positive"; in the Northeast sample, the number was 56; and in the Southwest sample, 78 owners rated the business climate as "strongly positive." You use an appropriate chi-square table format to test the null hypothesis that the proportion of all small businesses owners who rate the business climate "strongly positive" is the same in all three regions. In the table of "expected frequencies," what is the expected frequency that should be entered in the "Southeast, strongly positive" cell?
A)53
B)66
C)47
D)44
A)53
B)66
C)47
D)44
Unlock Deck
Unlock for access to all 145 flashcards in this deck.
Unlock Deck
k this deck
65
In its most recent annual report, the US Chamber of Commerce compared the economic climate for small businesses in three regions of the country by asking a randomly selected sample of 100 small business owners from each region to rate the business climate in their region.In the Southeast sample, there were 64 owners who rated the climate as "strongly positive"; in the Northeast sample, the number was 56; and in the Southwest sample, 78 owners rated the business climate as "strongly positive." You use an appropriate chi-square table format to test the null hypothesis that the proportion of all small businesses owners who rate the business climate "strongly positive" is the same in all three regions. If the significance level is set at 5%, report the critical chi-square for your test.
A)7.815
B)10.597
C)5.991
D)7.378
A)7.815
B)10.597
C)5.991
D)7.378
Unlock Deck
Unlock for access to all 145 flashcards in this deck.
Unlock Deck
k this deck
66
A random sample of 100 members is selected from the population of UTU union members.A second sample, this one of size 200, is selected from the population of AFB union members.A third sample, also of size 200, is selected from the population of CCO union members.You use your results to fill in the table below showing the number of members in each sample who are satisfied with the representation that their union provides. You then use a chi-square test to test the null hypothesis that the three union populations represented here contain the same proportion of satisfied members.The significance level for the test is 5%.If the p-value for the sample result turns out to be .1642, what should you conclude?
A)Don't reject the hypothesis that the proportion of satisfied members is not the same in all three union populations.
B)Reject the hypothesis that the proportion of satisfied members is different in the three union populations.
C)The sample provides strong evidence that the proportion of satisfied members is the same in all three union populations.
D)The sample provides strong evidence that the proportion of satisfied members is not the same in all three union populations.
You then use a chi-square test to test the null hypothesis that the three union populations represented here contain the same proportion of satisfied members.The significance level for the test is 5%.If the p-value for the sample result turns out to be .1642, what should you conclude?A)Don't reject the hypothesis that the proportion of satisfied members is not the same in all three union populations.
B)Reject the hypothesis that the proportion of satisfied members is different in the three union populations.
C)The sample provides strong evidence that the proportion of satisfied members is the same in all three union populations.
D)The sample provides strong evidence that the proportion of satisfied members is not the same in all three union populations.
Unlock Deck
Unlock for access to all 145 flashcards in this deck.
Unlock Deck
k this deck
67
A random sample of 100 members is selected from the population of UTU union members.A second sample, this one of size 200, is selected from the population of AFB union members.A third sample, also of size 200, is selected from the population of CCO union members.The table below shows the number of members in each sample who are satisfied with the representation that their union provides. You use a chi-square test to test the null hypothesis that the three union populations represented here contain the same proportion of satisfied members.In a table of "expected frequencies if the null hypothesis is true," what is the expected frequency that should be entered in the "UTU, Satisfied" cell?
A)53
B)94
C)47
D)106
You use a chi-square test to test the null hypothesis that the three union populations represented here contain the same proportion of satisfied members.In a table of "expected frequencies if the null hypothesis is true," what is the expected frequency that should be entered in the "UTU, Satisfied" cell?A)53
B)94
C)47
D)106
Unlock Deck
Unlock for access to all 145 flashcards in this deck.
Unlock Deck
k this deck
68
Alpine Research has conducted a survey of online shoppers.Simple random samples of 200 shoppers aged 18-to-25, 100 shoppers aged 26-to-40, and 100 shoppers aged 41-to-65 were selected for the survey.In the 18-to-25 sample, 80 shoppers (40%) expressed concerned about online security.Fifty of the 26-to-40 sample (50%) gave the same response.In the 41-to-65 sample, 66 shoppers (66%) expressed concern about online security. Below is a (partial) table of expected frequencies that you will use to conduct a chi-square test of the null hypothesis that the proportion of shoppers who are concerned about online security is the same in all three populations represented.The significance level for the test is 5%.Suppose the p-value for the sample result turns out to be .0001.What should you conclude?
Expected Frequencies
A)The test provides strong evidence that each of the three age categories has a different proportion of concerned shoppers.
B)The test provides strong evidence that the proportion of concerned shoppers is the same for two of the three age categories.
C)The test provides strong evidence that the proportion of concerned shoppers is the same for all three age categories.
D)The test provides strong evidence that the proportion of concerned shoppers is not the same for all three age categories.
Unlock Deck
Unlock for access to all 145 flashcards in this deck.
Unlock Deck
k this deck
69
In its most recent annual report, the US Chamber of Commerce compared the economic climate for small businesses in three regions of the country by asking a randomly selected sample of 100 small business owners from each region to rate the business climate in their region.In each sample, a majority of business owners rated the business climate "strongly positive." You use an appropriate chi-square table format to test the null hypothesis that the proportion of all small businesses owners who rate the business climate "strongly positive" is the same in all three regions.The significance level of the test is 5%. If the p-value for the sample result turns out to be .067, what should you conclude?
A)Don't reject the hypothesis that the proportion of all small businesses owners who would rate the business climate "strongly positive" is the same in all three regions
B)Reject the hypothesis that the proportion of all small businesses owners who would rate the business climate "strongly positive" is the same in for all three regions
C)The proportion of all small businesses owners who would rate the business climate "strongly positive" is the same in all three regions.
D)The proportion of all small businesses owners who would rate the business climate "strongly positive" is not the same in all three regions.
Unlock Deck
Unlock for access to all 145 flashcards in this deck.
Unlock Deck
k this deck
70
A random sample of 100 members is selected from the population of UTU union members.A second sample, this one of size 200, is selected from the population of AFB union members.A third sample, also of size 200, is selected from the population of CCO union members.You use your results to fill in the table below showing the number of members in each sample who are satisfied with the representation that their union provides. You then use a chi-square test to test the null hypothesis that the three union populations represented here contain the same proportion of satisfied members.The significance level for the test is 5%.If he p-value for the sample result turns out to be .0441, what should you conclude?
A)Don't reject the hypothesis that the proportion of satisfied members is not the same in all three union populations.
B)Reject the hypothesis that the proportion of satisfied members is different in the three union populations.
C)The sample provides strong evidence that the proportion of satisfied members is the same in all three union populations.
D)The sample provides strong evidence that the proportion of satisfied members is not the same in all three union populations.
You then use a chi-square test to test the null hypothesis that the three union populations represented here contain the same proportion of satisfied members.The significance level for the test is 5%.If he p-value for the sample result turns out to be .0441, what should you conclude?A)Don't reject the hypothesis that the proportion of satisfied members is not the same in all three union populations.
B)Reject the hypothesis that the proportion of satisfied members is different in the three union populations.
C)The sample provides strong evidence that the proportion of satisfied members is the same in all three union populations.
D)The sample provides strong evidence that the proportion of satisfied members is not the same in all three union populations.
Unlock Deck
Unlock for access to all 145 flashcards in this deck.
Unlock Deck
k this deck
71
A random sample of 100 members is selected from the population of UTU union members.A second sample, this one of size 200, is selected from the population of AFB union members.A third sample, also of size 200, is selected from the population of CCO union members.The table below shows the number of members in each sample who are satisfied with the representation that their union provides. You use a chi-square test to test the null hypothesis that the three union populations represented here contain the same proportion of satisfied members.If the significance level is 5%, report the critical chi-square value for your test.
A)5.991
B)9.210
C)2.841
D)7.815
You use a chi-square test to test the null hypothesis that the three union populations represented here contain the same proportion of satisfied members.If the significance level is 5%, report the critical chi-square value for your test.A)5.991
B)9.210
C)2.841
D)7.815
Unlock Deck
Unlock for access to all 145 flashcards in this deck.
Unlock Deck
k this deck
72
Alpine Research has conducted a survey of online shoppers.Simple random samples of 200 shoppers aged 18-to-25, 100 shoppers aged 26-to-40, and 100 shoppers aged 41-to-65 were selected for the survey.In the 18-to-25 sample, 80 shoppers (40%) expressed concerned about online security.Fifty of the 26-to-40 sample (50%) gave the same response.In the 41-to-65 sample, 66 shoppers (66%) expressed concern about online security. Below is a (partial) table of expected frequencies that you will use to conduct a chi-square test of the null hypothesis that the proportion of shoppers who are concerned about online security is the same for all three populations represented.Find the value of the chi-square test statistic.
Expected Frequencies
A)14.625
B)9.068
C)18.087
D)5.223
Expected Frequencies
A)14.625
B)9.068
C)18.087
D)5.223
Unlock Deck
Unlock for access to all 145 flashcards in this deck.
Unlock Deck
k this deck
73
A sample of 100 colored balls is selected from a large container of red balls and white balls-call it Container A.A second sample, this one of size 200, is selected from another container of red balls and white balls-call it Container B.The table below shows observed results from the two samples. You plan to use a chi-square test to test the null hypothesis that the two containers contain the same proportion of red balls.If the significance level is 1%, report the critical chi-square value that would be appropriate for your test.
A)5.024
B)3.814
C)6.635
D)13.227
You plan to use a chi-square test to test the null hypothesis that the two containers contain the same proportion of red balls.If the significance level is 1%, report the critical chi-square value that would be appropriate for your test.A)5.024
B)3.814
C)6.635
D)13.227
Unlock Deck
Unlock for access to all 145 flashcards in this deck.
Unlock Deck
k this deck
74
A sample of 100 colored balls is selected from a large container of red balls and white balls-call it Container A.A second sample, this one of size 200, is selected from another container of red balls and white balls-call it Container B.The table below shows observed results from the two samples. You plan to use a chi-square test to test the null hypothesis that the two containers contain the same proportion of red balls.The significance level for the test will be 1%.Suppose the p-value for the sample result turns out to be .0272.What should you conclude?
A)At a 1% significance level, don't reject the hypothesis that the proportion of red balls is the same in both containers.
B)At a 1% significance level, reject the hypothesis that the proportion of red balls is the same in both containers.
C)The test provides strong evidence that the proportion of red balls is not the same in both containers.
D)The test provides strong evidence that the proportion of red balls is the same in both containers.
You plan to use a chi-square test to test the null hypothesis that the two containers contain the same proportion of red balls.The significance level for the test will be 1%.Suppose the p-value for the sample result turns out to be .0272.What should you conclude?A)At a 1% significance level, don't reject the hypothesis that the proportion of red balls is the same in both containers.
B)At a 1% significance level, reject the hypothesis that the proportion of red balls is the same in both containers.
C)The test provides strong evidence that the proportion of red balls is not the same in both containers.
D)The test provides strong evidence that the proportion of red balls is the same in both containers.
Unlock Deck
Unlock for access to all 145 flashcards in this deck.
Unlock Deck
k this deck
75
A random sample of 100 members is selected from the population of UTU union members.A second sample, this one of size 200, is selected from the population of AFB union members.A third sample, also of size 200, is selected from the population of CCO union members.The table below shows the number of members in each sample who are satisfied with the representation that their union provides. You use a chi-square test to test the null hypothesis that the three union populations represented here contain the same proportion of satisfied members.Report the chi-square test statistic.
A)5.143
B)7.004
C)2.168
D)1.130
You use a chi-square test to test the null hypothesis that the three union populations represented here contain the same proportion of satisfied members.Report the chi-square test statistic.A)5.143
B)7.004
C)2.168
D)1.130
Unlock Deck
Unlock for access to all 145 flashcards in this deck.
Unlock Deck
k this deck
76
A sample of 100 colored balls is selected from a large container of red balls and white balls-call it Container A.A second sample, this one of size 200, is selected from another container of red balls and white balls-call it Container B.The table below shows observed results from the two samples. You use a chi-square test to test the null hypothesis that the two containers contain the same proportion of red balls.In a table of "expected frequencies if the null hypothesis is true," what is the expected frequency that should be entered in the "Container A, Red Balls" cell?
A)48
B)96
C)52
D)104
You use a chi-square test to test the null hypothesis that the two containers contain the same proportion of red balls.In a table of "expected frequencies if the null hypothesis is true," what is the expected frequency that should be entered in the "Container A, Red Balls" cell?A)48
B)96
C)52
D)104
Unlock Deck
Unlock for access to all 145 flashcards in this deck.
Unlock Deck
k this deck
77
A sample of 100 colored balls is selected from a large container of red balls and white balls-call it Container A.A second sample, this one of size 200, is selected from another container of red balls and white balls-call it Container B.The table below shows observed results from the two samples. You plan to use a chi-square test to test the null hypothesis that the two containers contain the same proportion of red balls.Report the p-value that would be appropriate for your test.(You will need a statistical calculator.)
A)0.2631
B)0.1413
C)0.0667
D)0.1015
You plan to use a chi-square test to test the null hypothesis that the two containers contain the same proportion of red balls.Report the p-value that would be appropriate for your test.(You will need a statistical calculator.)A)0.2631
B)0.1413
C)0.0667
D)0.1015
Unlock Deck
Unlock for access to all 145 flashcards in this deck.
Unlock Deck
k this deck
78
Alpine Research has conducted a survey of online shoppers.Simple random samples of 200 shoppers aged 18-to-25, 100 shoppers aged 26-to-40, and 100 shoppers aged 41-to-65 were selected for the survey.In the 18-to-25 sample, 80 shoppers (40%) expressed concerned about online security.Fifty of the 26-to-40 sample (50%) gave the same response.In the 41-to-65 sample, 66 shoppers (66%) expressed concern about online security. Below is a (partial) table of expected frequencies that you will use to conduct a chi-square test of the null hypothesis that the proportion of shoppers who are concerned about online security is the same in all three populations represented.What is the expected frequency that you should show in the "18-to-25, Concerned" cell of the table?
Expected Frequencies
A)40
B)98
C)80
D)120
Expected Frequencies
A)40
B)98
C)80
D)120
Unlock Deck
Unlock for access to all 145 flashcards in this deck.
Unlock Deck
k this deck
79
Alpine Research has conducted a survey of online shoppers.Simple random samples of 200 shoppers aged 18-to-25, 100 shoppers aged 26-to-40, and 100 shoppers aged 41-to-65 were selected for the survey.Shoppers in each of the three samples were asked whether they were concerned about online security when shopping. You use the survey results to conduct a chi-square test of the null hypothesis that the proportion of shoppers who are concerned about online security is the same in all three populations represented.The significance level for the test is 5%.Suppose the p-value for the sample result turns out to be .1072.What should you conclude?
Expected Frequencies
A)Don't reject the hypothesis that the proportion of concerned shoppers is the same in all three age categories.
B)Reject the hypothesis that the proportion of concerned shoppers is the same in all three age categories.
C)The test provides strong evidence that the proportion of concerned shoppers is not the same in all three age categories.
D)The test provides strong evidence that the proportion of concerned shoppers is the same in all three age categories.
Unlock Deck
Unlock for access to all 145 flashcards in this deck.
Unlock Deck
k this deck
80
A random sample of 100 members is selected from the population of UTU union members.A second sample, this one of size 200, is selected from the population of AFB union members.A third sample, also of size 200, is selected from the population of CCO union members.The table below shows the number of members in each sample who are satisfied with the representation that their union provides. You use a chi-square test to test the null hypothesis that the three union populations represented here contain the same proportion of satisfied members.Report the p-value that for your test.(You will need a statistical calculator.)
A).217
B).141
C).338
D).102
You use a chi-square test to test the null hypothesis that the three union populations represented here contain the same proportion of satisfied members.Report the p-value that for your test.(You will need a statistical calculator.)A).217
B).141
C).338
D).102
Unlock Deck
Unlock for access to all 145 flashcards in this deck.
Unlock Deck
k this deck
Unlock Deck
Unlock for access to all 145 flashcards in this deck.


