Exam 16: Chi-Square Tests
Exam 1: An Introduction to Statistics44 Questions
Exam 2: Descriptive Statistics I: Elementary Data Presentation and Description147 Questions
Exam 3: Descriptive Statistics II: Additional Descriptive Measures and Data Displays128 Questions
Exam 4: Probability147 Questions
Exam 5: Discrete Probability Distributions144 Questions
Exam 6: Continuous Probability Distributions141 Questions
Exam 7: Statistical Inference: Estimating a Population Mean134 Questions
Exam 8: Interval Estimates for Proportions, Mean Differences and Proportion Differences19 Questions
Exam 9: Statistical Hypothesis Testing: Hypothesis Tests for a Population Mean62 Questions
Exam 10: Hypothesis Tests for Proportions, Mean Differences and Proportion Differences39 Questions
Exam 11: Basic Regression Analysis111 Questions
Exam 12: Multiple Regression53 Questions
Exam 13: F Tests and Analysis of Variance95 Questions
Exam 14: Experimental Designonline Only64 Questions
Exam 16: Chi-Square Tests145 Questions
Select questions type
In a chi-square distribution with nine degrees of freedom, 90% of the values are greater than
Free
(Multiple Choice)
4.8/5  (28)
(28)
Correct Answer: Verified
B
An NBC/Wall Street Journal poll asked adults monthly, "In general, do you approve or disapprove of the job Barack Obama is doing as president?"  Suppose that the sample size in 2009, 2010, and 2011 was 2,000 adults.Use these results to test whether Presidential job approval ratings in these three years were independent of the survey date.Construct the hypotheses as follows:
H0: The approval rating (response) is independent of the survey date
Ha: The approval rating (response) is not independent of the survey date
At a 5% significance level, what is the critical value, 2c, for the hypothesis test?
Suppose that the sample size in 2009, 2010, and 2011 was 2,000 adults.Use these results to test whether Presidential job approval ratings in these three years were independent of the survey date.Construct the hypotheses as follows:
H0: The approval rating (response) is independent of the survey date
Ha: The approval rating (response) is not independent of the survey date
At a 5% significance level, what is the critical value, 2c, for the hypothesis test?
Free
(Multiple Choice)
4.7/5 (30)
Correct Answer:Verified
B
The expected frequency in a goodness of fit test for a multinomial population is calculated by:
Free
(Multiple Choice)
4.9/5 (37)
Correct Answer:Verified
A
A sample of 100 colored balls is selected from a large container of red balls and white balls-call it Container A.A second sample, this one of size 200, is selected from another container of red balls and white balls-call it Container B.The table below shows observed results from the two samples. 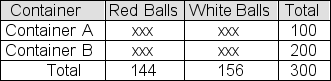 You plan to use a chi-square test to test the null hypothesis that the two containers contain the same proportion of red balls.The significance level for the test will be 1%.Suppose the p-value for the sample result turns out to be .0272.What should you conclude?
(Multiple Choice)
4.8/5 (43)
Economic Review reported that for 50% of American workers, the biggest job-related concern is that their skills will become obsolete; for 30%, the biggest concern is that their job would be lost to foreign competition; for 15%, the biggest concern is that younger workers will take their place, and for 5%, the biggest concern is stress in the workplace.You take a sample of workers to test the accuracy of the report.In your sample of 120 workers, 46 said their biggest concern was that their skills would become obsolete, 32 said their biggest concern was that their job would be lost to foreign competition, 27 said their biggest concern was that they would be replaced by younger workers, and 15 said their biggest concern was workplace stress.You conduct a chi-square goodness-of-fit test to test whether these sample results are consistent with the Economic Review report. Report the p-value for the test.(You will need a statistical calculator.)
(Multiple Choice)
4.9/5 (33)
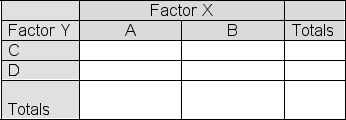
The partially completed contingency table below shows "observed" frequencies in a sample of size 1000: 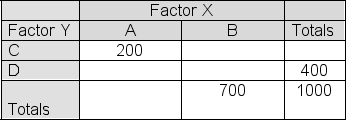 Fill in the table below with the "expected" cell frequencies if Factor X and Factor Y are independent.
 Report the value of the chi-square statistic that would be produced if we were to use the information in the tables to test the null hypothesis that the two factors shown are independent.
(Multiple Choice)
4.8/5 (31)
A sample of 100 colored balls is selected from a large container of red balls and white balls-call it Container A.A second sample, this one of size 200, is selected from another container of red balls and white balls-call it Container B.The table below shows observed results from the two samples. 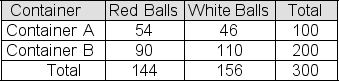 You use a chi-square test to test the null hypothesis that the two containers contain the same proportion of red balls.In a table of "expected frequencies if the null hypothesis is true," what is the expected frequency that should be entered in the "Container A, Red Balls" cell?
(Multiple Choice)
4.8/5 (33)
Below is a contingency table showing the results of a survey in which 200 voters were asked to comment on current economic conditions.
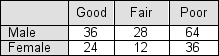 If "view of the economy" is independent of "gender," we would have expected 30% of the male responses to be "good."
(True/False)
4.8/5 (45)
In a chi-square test of proportion differences, we will reject the "all proportions are equal" null hypothesis if the p-value for the chi-square statistic is less than the significance level for the test.
(True/False)
4.9/5 (40)
Economic Review reported that for 50% of American workers, the biggest job-related concern is that their skills will become obsolete; for 30%, the biggest concern is that their job would be lost to foreign competition; for 15%, the biggest concern is that younger workers will take their place, and for 5%, the biggest concern is stress in the workplace.In a sample of 120 workers, some said their biggest concern was that their skills would become obsolete, some said their biggest concern was that their job would be lost to foreign competition, some said their biggest concern was that they would be replaced by younger workers, and the rest said their biggest concern was workplace stress.You plan to conduct a chi-square goodness-of-fit test to test whether these sample results are consistent with the Economic Review report.The significance level will be set at 1%. If the chi-square statistic for the test turns out to be 13.819, what should you conclude?
(Multiple Choice)
4.8/5 (35)
Samples of equal size have been selected from each of three populations, producing sample proportions of 0.4, 0.3, and 0.5.To compute a pooled sample proportion, each of the sample proportions is weighted by size of the population from which the sample was selected.
(True/False)
4.8/5 (33)
In a survey of 500 randomly selected corporate CEOs and 1000 randomly selected small business owners, 160 of the CEOs and 260 of the small business owners cited government over-regulation as a significant problem. At a 5% significance level, use a chi-square test to test the hypothesis that the proportion of individuals who hold this opinion is the same in both populations represented here.What is the critical chi-square value for the test?
(Multiple Choice)
4.9/5 (38)
Use a statistical calculator to find the percentage of values in a chi-square distribution with df = 5 that are greater than 13.45.
(Multiple Choice)
4.8/5 (30)
The HR manager at Hernandez Inc.reports that 40% of the company's job applicants have a bachelor's degree, 34% have an associate's degree and the remaining 26% have a high school diploma.You take a simple random sample of 200 applicants and find that 96 have a bachelor's degree, 70 have an associate's degree, and 34 have a high school diploma.You conduct a chi-square hypothesis test to establish whether this sample result is sufficient to reject a null hypothesis that the composition of Hernandez' job applicant population matches the HR manager's claim. Report the chi-square test statistic.
(Multiple Choice)
4.7/5 (39)
In a consumer survey designed to assess the priorities of online shoppers, 2000 online shoppers were randomly selected and asked to identify what is most important to them when buying a product online.Respondents to the survey were classified by online shopping frequency as either "frequent online shoppers" or "occasional online shoppers." Results of the study are used to fill in a table like the one below.Based on the results, you use chi-square analysis to test the null hypothesis that shopper priority is independent of online shopping frequency. 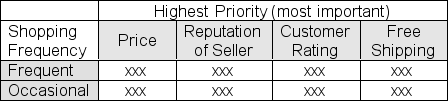 Suppose the chi-square statistic for the test turns out to be 10.525.If the significance level is set at 5%, what should you conclude?
(Multiple Choice)
4.9/5 (35)
The HR manager at Hernandez Inc.reports that 40% of the company's job applicants have a bachelor's degree, 34% have an associate's degree and the remaining 26% have a high school diploma.You take a simple random sample of 200 applicants and find that 96 have a bachelor's degree, 70 have an associate's degree, and 34 have a high school diploma.You will conduct a chi-square hypothesis test to establish whether this sample result is sufficient to reject a null hypothesis that the composition of Hernandez' job applicant population matches the HR manager's claim. Report the p-value for your test.(You will need a statistical calculator.)
(Multiple Choice)
4.8/5 (35)
A random sample of 100 members is selected from the population of UTU union members.A second sample, this one of size 200, is selected from the population of AFB union members.A third sample, also of size 200, is selected from the population of CCO union members.The table below shows the number of members in each sample who are satisfied with the representation that their union provides. 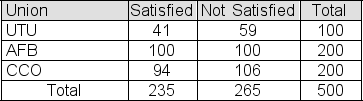 You use a chi-square test to test the null hypothesis that the three union populations represented here contain the same proportion of satisfied members.If the significance level is 5%, report the critical chi-square value for your test.
(Multiple Choice)
4.8/5 (38)
In a chi-square calculation involving 9 independent terms (that is, with df = 9), there is a 5% probability that the result will be less than _______.
(Multiple Choice)
4.8/5 (35)
A recent study measured the proportion of business school faculty who engage in outside consulting.Four samples, each composed of 100 randomly selected faculty members, were used to represent four types of institutions: large four-year state schools, small four-year state schools, large four-year private schools, and small four-year private schools.In the sample of 100 faculty from large state schools, 30 reported such outside consulting (30%), as compared to 24 (24%) in the sample of faculty from small state schools.In the large private school sample, the number was 42 (42%), as compared to 32 (32%) in the sample of faculty from small private schools. You use the chi-square distribution to test the hypothesis that the proportion of faculty who engage in outside consulting is the same across all four institutional categories.The significance level for the test is 1%.Report the critical chi-square value for the test.
(Multiple Choice)
4.9/5 (34)
A professor collected data to determine whether the share of her students who passed her course differed across her morning, afternoon, and evening classes.Samples of her recent students provided the following information:  She set up the following hypotheses test to determine whether the pass rate differs across meeting times.
H0: 1 = 2 = 3 (the population proportions are equal)
HA: At least two population proportions differ from one another.
At a 1% significance level, what is the test statistic, 2stat, for the hypothesis test?
She set up the following hypotheses test to determine whether the pass rate differs across meeting times.
H0: 1 = 2 = 3 (the population proportions are equal)
HA: At least two population proportions differ from one another.
At a 1% significance level, what is the test statistic, 2stat, for the hypothesis test?
(Multiple Choice)
5.0/5 (29)
Filters
- Essay(0)
- Multiple Choice(0)
- Short Answer(0)
- True False(0)
- Matching(0)