Deck 13: F Tests and Analysis of Variance
Full screen (f)
Question
Question
Question
Question
Question
Question
Question
Question
Question
Question
You are testing the equality of population means using ANOVA.The partial ANOVA table appears below.If the samples used in the ANOVA are all the same size, that sample size must be 15.

Question
You are testing the equality of population means using ANOVA.The partial ANOVA table appears below.The between-groups mean square value is 1540.

Question
Question
Question
Question
Question
You are testing the equality of population means using ANOVA.The partial ANOVA table appears below.According to the table, four population means are involved in the test.

Question
Question
Question
Question
Question
Question
You are testing the equality of population means using ANOVA.The partial ANOVA table appears below.What is the value of the between-groups mean square? 
A)464.062
B)587.5
C)2350
D)783.33
A)464.062
B)587.5
C)2350
D)783.33
Question
Question
Question
You are testing the equality of population means using one-way ANOVA.The partial ANOVA table appears below.If the samples used in the ANOVA are all the same size, what is the sample size? 
A)12
B)15
C)10
D)5
A)12
B)15
C)10
D)5
Question
Question
Question
Question
Question
Question
You are testing the equality of population means using one-way ANOVA.The partial ANOVA table appears below.According to the table, how many group means (population means) are involved in the test? 
A)4
B)3
C)2
D)5
A)4
B)3
C)2
D)5
Question
Question
Question
Question
Question
Question
Question
Question
Question
Question
Question
Question
Question
The ANOVA table below shows partial results for a test of a "no difference in population means" null hypothesis.At a 5% significance level, what is the.critical value (Fc) for the test.? 
A)4.902
B)3.718
C)5.568
D)2.758
A)4.902
B)3.718
C)5.568
D)2.758
Question
Question
Question
Question
The ANOVA table below shows partial results for a test of a "no difference in population means" null hypothesis.The significance level for the test is 5%.Report the F statistic (Fstat) for the test. 
A)12.68
B)11.62
C)8.66
D)14.35
A)12.68
B)11.62
C)8.66
D)14.35
Question
Question
Question
Question
Question
Question
Question
Question
The ANOVA table below shows partial results for a test of a "no difference in population means" null hypothesis.How many populations are involved in the test? 
A)2
B)3
C)4
D)5
A)2
B)3
C)4
D)5
Question
The ANOVA table below shows partial results for a test of a "no difference in population means" null hypothesis.The significance level for the test is 5%.Compute the F statistic (Fstat) for the test. 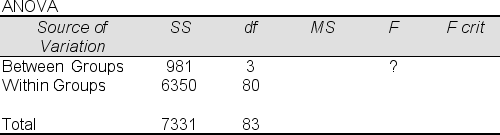
A)3.90
B)4.12
C)2.56
D)5.60
A)3.90
B)4.12
C)2.56
D)5.60
Question
Question
Question
Question
Greengrow, Inc.is evaluating three new fertilizer mixes.During a trial period, five similar young plants of equal size were randomly assigned to each fertilizer mix.Plant heights (in centimeters) were measured at the end of the trial period.The tables below summarize (partially) the test results.Use the sample results to test the null hypothesis that average heights for the three populations represented here are the same, using a significance level of 5%.Compute the F value (Fstat) for the test. 
A)Since the computed F (Fstat) is greater than the critical F value, we cannot reject the "no difference in population means" null hypothesis.
B)Since the p-value is greater than .025, we can reject the "no difference in population means" null hypothesis.
C)Since the p-value is greater than .05, we cannot reject the "no difference in population means" null hypothesis.
D)Since the computed F (Fstat) is greater than the critical F value, we can reject the "no difference in population means" null hypothesis.
Question
Greengrow, Inc.is evaluating three new fertilizer mixes.During a trial period, four young plants of equal size were randomly assigned to each fertilizer mix.Plant heights (in centimeters) at the end of the trial period are shown below: 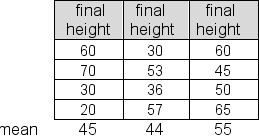 You are to use the sample data to test the null hypothesis that the average heights for the three populations represented here are the same, using a significance level of 5%.Compute the F value (Fstat) for the test and report your conclusion.
A)Fstat = 3.248.Since Fstat is less than the critical F value, we cannot reject the "no difference in population means" null hypothesis.
B)Fstat = 5.655.Since Fstat is greater than the critical F value, we can reject the "no difference in population means" null hypothesis.
C)Fstat = 7.323.Since Fstat is greater than the critical F value, we can reject the "no difference in population means" null hypothesis.
D)Fstat = 0.542.Since Fstat is less than the critical F value, we cannot reject the "no difference in population means" null hypothesis.
You are to use the sample data to test the null hypothesis that the average heights for the three populations represented here are the same, using a significance level of 5%.Compute the F value (Fstat) for the test and report your conclusion.A)Fstat = 3.248.Since Fstat is less than the critical F value, we cannot reject the "no difference in population means" null hypothesis.
B)Fstat = 5.655.Since Fstat is greater than the critical F value, we can reject the "no difference in population means" null hypothesis.
C)Fstat = 7.323.Since Fstat is greater than the critical F value, we can reject the "no difference in population means" null hypothesis.
D)Fstat = 0.542.Since Fstat is less than the critical F value, we cannot reject the "no difference in population means" null hypothesis.
Question
The golf scores for a sample of 8 rounds of golf for three players are given in the table below, along with sample standard deviations. 18-hole scores
 At a 5% significance level, test the hypothesis that the average scores for the three populations are the same., The ANOVA table for the test is shown below.What is your conclusion?

A)Since Fstat is less than 5.800, we can reject the "no difference in population means" null hypothesis.
B)Since the p-value is less than .05, we can reject the "no difference in population means" null hypothesis.
C)Since Fstat is greater than Fc, we cannot reject the "no difference in population means" null hypothesis.
D)Since the p-value is less than .05, we cannot reject the "no difference in population means" null hypothesis.
At a 5% significance level, test the hypothesis that the average scores for the three populations are the same., The ANOVA table for the test is shown below.What is your conclusion?A)Since Fstat is less than 5.800, we can reject the "no difference in population means" null hypothesis.
B)Since the p-value is less than .05, we can reject the "no difference in population means" null hypothesis.
C)Since Fstat is greater than Fc, we cannot reject the "no difference in population means" null hypothesis.
D)Since the p-value is less than .05, we cannot reject the "no difference in population means" null hypothesis.
Question
You are conducting a study to compare the characteristics of women and men in senior executive positions at major US corporations.Samples of four senior executive men and four senior executive women are selected.The table below shows the number of years of management experience before promotion to a senior executive position for each of the two samples. 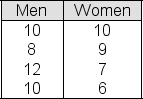 At a 5% significance level, you use one-way analysis of variance to test the hypothesis that the average time before promotion is the same in the populations of men and women represented here.Compute the test statistic (Fstat).
A)2.667
B)2.149
C)3.115
D)1.633
At a 5% significance level, you use one-way analysis of variance to test the hypothesis that the average time before promotion is the same in the populations of men and women represented here.Compute the test statistic (Fstat).A)2.667
B)2.149
C)3.115
D)1.633
Question
A test involving three brands of cell phone was conducted to compare the brands with respect to the average number of battery recharges before the battery no longer functioned properly.Ten phones of each brand were tested, with the following results: Number of recharges before battery no longer functions
 At a 5% significance level, test the hypothesis that the average maximum number of recharges is equal for the three brands.What is the F statistic (Fstat) for the test?
A)3.391
B)4.962
C)3.520
D)7.250
At a 5% significance level, test the hypothesis that the average maximum number of recharges is equal for the three brands.What is the F statistic (Fstat) for the test?A)3.391
B)4.962
C)3.520
D)7.250
Question
Loomis, Inc.is evaluating three possible bonus incentive programs for its sales staff.During a trial period, a sample of four sales staff was randomly assigned to each bonus program.Individual sales figures (in $1000s) are shown below: 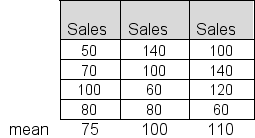 Use the sample data to test the null hypothesis that average sales for the three populations represented here are the same, at a significance level of 5%.Report the within group mean square (MSW).
A)8300
B)834.11
C)922.22
D)688.44
Use the sample data to test the null hypothesis that average sales for the three populations represented here are the same, at a significance level of 5%.Report the within group mean square (MSW).A)8300
B)834.11
C)922.22
D)688.44
Question
Question
Greengrow, Inc.is evaluating three new fertilizer mixes.During a trial period, five young plants of equal size were randomly assigned to each fertilizer mix.Plant heights (in centimeters) were measured at the end of the trial period.The tables below summarize (partially) the test results.You are to use the sample results to test the null hypothesis that average heights for the three populations represented here are the same, using a significance level of 5%.Compute the F value (Fstat) for the test. 
A)2.411
B)1.957
C)3.725
D)2.571
A)2.411
B)1.957
C)3.725
D)2.571
Question
Morton Products is testing three procedures for processing and shipping online orders.In the test, 12 orders were randomly selected.Four of the orders were randomly assigned Procedure 1, four others were assigned Procedure 2, and the remaining four were assigned Procedure 3.Processing/shipping times for each of the three samples are given below: 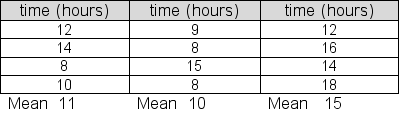 At a 5% significance level, test the null hypothesis that the average processing/shipping times for the three populations are equal..Report the between group sum of squares (SSB).
A)108
B)92
C)64
D)56
At a 5% significance level, test the null hypothesis that the average processing/shipping times for the three populations are equal..Report the between group sum of squares (SSB).A)108
B)92
C)64
D)56
Question
The golf scores for a sample of 10 rounds of golf for three players are given in the table below, along with sample standard deviations. 18-hole scores
 At a 5% significance level, test the hypothesis that the average scores for the three populations are the same.What is the F statistic (Fstat) for the test?
A)4.900
B)8.960
C)10.568
D)7.750
At a 5% significance level, test the hypothesis that the average scores for the three populations are the same.What is the F statistic (Fstat) for the test?A)4.900
B)8.960
C)10.568
D)7.750
Question
Morton Products is testing three procedures for processing and shipping online orders.In the test, 12 orders were randomly selected.Four of the orders were randomly assigned Procedure 1, four others were assigned Procedure 2, and the remaining four were assigned Procedure 3.Processing/shipping times for each of the three samples are given below: 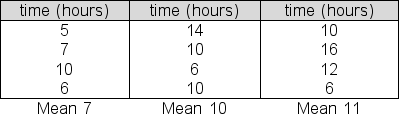 At a 5% significance level, test the null hypothesis that the average processing/shipping times for the three populations are the same.Report the between group sum of squares (SSB) for this test.
A)108.00
B)34.67
C)22.89
D)15.33
At a 5% significance level, test the null hypothesis that the average processing/shipping times for the three populations are the same.Report the between group sum of squares (SSB) for this test.A)108.00
B)34.67
C)22.89
D)15.33
Question
A study is being conducted to compare characteristics of women in senior executive positions and men in senior executive positions at major US corporations.A sample of four senior executive men and four senior executive women is selected.The table below shows the number of years of management experience before promotion to a senior executive position for each of the two samples. 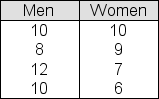 You will use a t-test assuming equal population variances (standard deviations) to test the null hypothesis that the average time before promotion in the populations represented here is the same for men and women.The significance level is .05.Report the t-score (tstat) for the test.
A)2.407
B).920
C)3.115
D)1.633
You will use a t-test assuming equal population variances (standard deviations) to test the null hypothesis that the average time before promotion in the populations represented here is the same for men and women.The significance level is .05.Report the t-score (tstat) for the test.A)2.407
B).920
C)3.115
D)1.633
Question
A test involving three brands of cell phone was conducted to compare the brands with respect to the average number of battery recharges before the battery no longer functioned properly.Six phones of each brand were tested, with the following results: Number of recharges before battery no longer functions
 At a 5% significance level, test the hypothesis that the average maximum number of possible recharges prior to failure is the same for all three brands.The ANOVA table for the test is shown below.Complete the table and report your conclusion.
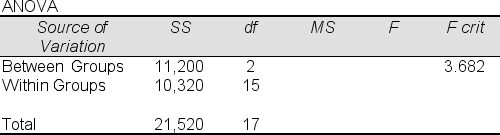
A)Since Fstat is greater than 3.682, we cannot reject the "equal population means" null hypothesis.
B)Since the p-value is greater than .05, we can reject the "equal population means" null hypothesis.
C)Since Fstat is greater than Fc, we can reject the "equal population means" null hypothesis.
D)Since the p-value is less than .05, we cannot reject the "equal population means" null hypothesis.
At a 5% significance level, test the hypothesis that the average maximum number of possible recharges prior to failure is the same for all three brands.The ANOVA table for the test is shown below.Complete the table and report your conclusion.A)Since Fstat is greater than 3.682, we cannot reject the "equal population means" null hypothesis.
B)Since the p-value is greater than .05, we can reject the "equal population means" null hypothesis.
C)Since Fstat is greater than Fc, we can reject the "equal population means" null hypothesis.
D)Since the p-value is less than .05, we cannot reject the "equal population means" null hypothesis.
Question
You are conducting a study to compare the characteristics of women and men in senior executive positions at major US corporations.Samples of four senior executive men and four senior executive women are selected.The table below shows the number of years of management experience before promotion to a senior executive position for each of the two samples.  At a 5% significance level, you conduct a t-test (assuming equal population variances) to test the null hypothesis that the average time before promotion is the same for men and women.The test statistic (tstat) turns out to be 2.121.Report your conclusion.
A)Since the test statistic is greater in absolute value than the critical t-score for the test, we reject the "no difference" null hypothesis.
B)Since the test statistic is less in absolute value than the critical t-score for the test, we cannot reject the "no difference" null hypothesis
C)Since the test statistic is greater in absolute value than the critical t-score for the test, we cannot reject the "no difference" null hypothesis.
D)Since the test statistic is less in absolute value than the critical t-score for the test, we reject the "no difference" null hypothesis.
At a 5% significance level, you conduct a t-test (assuming equal population variances) to test the null hypothesis that the average time before promotion is the same for men and women.The test statistic (tstat) turns out to be 2.121.Report your conclusion.A)Since the test statistic is greater in absolute value than the critical t-score for the test, we reject the "no difference" null hypothesis.
B)Since the test statistic is less in absolute value than the critical t-score for the test, we cannot reject the "no difference" null hypothesis
C)Since the test statistic is greater in absolute value than the critical t-score for the test, we cannot reject the "no difference" null hypothesis.
D)Since the test statistic is less in absolute value than the critical t-score for the test, we reject the "no difference" null hypothesis.
Question
Kensington, Inc.is evaluating three possible bonus incentive programs for its sales staff.During a trial period, a sample of four sales staff was randomly assigned to each bonus program.Individual sales figures (in $1000s) are shown below:  Use the sample data to test the null hypothesis that average sales for the three populations represented here are the same, at a significance level of 5%.Report the between group mean square (MSB).
A)1160
B)1300
C)1020
D)1800
Use the sample data to test the null hypothesis that average sales for the three populations represented here are the same, at a significance level of 5%.Report the between group mean square (MSB).A)1160
B)1300
C)1020
D)1800
Question
Question
You are conducting a study to compare the characteristics of women and men in senior executive positions at major US corporations.Samples of four senior executive men and four senior executive women are selected.At a 5% significance level, At a 5% significance leve, you use one-way analysis of variance to test the null hypothesis that the average time before promotion is the same for men and women.The tables below show partial results.Report the test statistic (Fstat). 
A)6.320
B)2.496
C)5.467
D)8.000
A)6.320
B)2.496
C)5.467
D)8.000
Question
Morton Products is testing three procedures for processing and shipping online orders.In the test, 12 orders were randomly selected.Four of the orders were randomly assigned Procedure 1, four others were assigned Procedure 2, and the remaining four were assigned Procedure 3.Processing/shipping times for each of the three samples are given below: 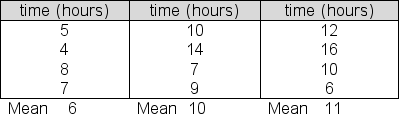 At a 5% significance level, test the null hypothesis that the average processing/shipping times for the three populations are equal.Report the between group sum of squares (SSB) for this test.
A)144
B)56
C)24
D)68
At a 5% significance level, test the null hypothesis that the average processing/shipping times for the three populations are equal.Report the between group sum of squares (SSB) for this test.A)144
B)56
C)24
D)68
Question
Loomis, Inc.is evaluating three possible bonus incentive programs for its sales staff.During a trial period, a sample of four sales staff was randomly assigned to each bonus program.Sales figures (in $1000) are shown below:  Use the sample data to test the null hypothesis that the average sales for the three populations represented here are the same, using a significance level of 5%.Report the F value (Fstat) for the test.
A)4.151
B)3.236
C)5.197
D)2.305
Use the sample data to test the null hypothesis that the average sales for the three populations represented here are the same, using a significance level of 5%.Report the F value (Fstat) for the test.A)4.151
B)3.236
C)5.197
D)2.305
Question
Morton Products is testing three procedures for processing and shipping online orders.In the test, 12 orders were randomly selected.Four of the orders were randomly assigned Procedure 1, four others were assigned Procedure 2, and the remaining four were assigned Procedure 3.Processing/shipping times for each of the three samples are given below: 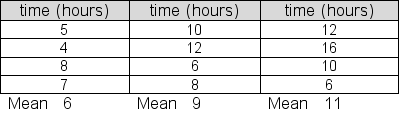 At a 5% significance level, test the null hypothesis that the average processing/shipping times for the three are equal.Report the within group sum of squares (SSW) for this test.
A)104
B)56
C)82
D)94
At a 5% significance level, test the null hypothesis that the average processing/shipping times for the three are equal.Report the within group sum of squares (SSW) for this test.A)104
B)56
C)82
D)94

Unlock Deck
Sign up to unlock the cards in this deck!
Unlock Deck
Unlock Deck
1/95
Play
Full screen (f)
Deck 13: F Tests and Analysis of Variance
1
You are testing the equality of two population means using samples of size 10.The Fstat value for your ANOVA is 4.0.If, instead of an F test, you had conducted a t test to test the "no difference in population means" null hypothesis, the tstat value would be 16.0.
False
2
The computed F value (Fstat) in a one-way analysis of variance is the ratio of the between groups sum of squares (SSB) to the within groups sum of squares (SSW).
False
3
You are testing the equality of two population means using ANOVA.The critical value Fc for your test is 3.634.If, instead of an F test, you had conducted a t test to test the "no difference in population means" null hypothesis, the tc value would be 1.906.
True
4
In an experimental study, the investigator has the ability to directly influence or manipulate one or more of the elements involved in the investigation.
Unlock Deck
Unlock for access to all 95 flashcards in this deck.
Unlock Deck
k this deck
5
The computed F value (Fstat) in a one-way analysis of variance is the ratio of the within groups mean square (MSW) to the between groups mean square (MSB).
Unlock Deck
Unlock for access to all 95 flashcards in this deck.
Unlock Deck
k this deck
6
The computed F value (Fstat) in a one-way analysis of variance is the ratio of the between groups mean square (MSB) to the within groups mean square (MSW).
Unlock Deck
Unlock for access to all 95 flashcards in this deck.
Unlock Deck
k this deck
7
One of the assumptions for the one-way analysis of variance is that the standard deviations - and so the variances - are not the same for all the populations.
Unlock Deck
Unlock for access to all 95 flashcards in this deck.
Unlock Deck
k this deck
8
The F distribution can be used to describe how the ratio of two sample variances behaves when the two samples have been independently selected from normal populations with the same variance.
Unlock Deck
Unlock for access to all 95 flashcards in this deck.
Unlock Deck
k this deck
9
In a completely randomized design, experimental units are arranged into similar groups based on extraneous factors in an effort to reduce error variation in experimental results.
Unlock Deck
Unlock for access to all 95 flashcards in this deck.
Unlock Deck
k this deck
10
You are testing the equality of population means using ANOVA.The partial ANOVA table appears below.If the samples used in the ANOVA are all the same size, that sample size must be 15.
Unlock Deck
Unlock for access to all 95 flashcards in this deck.
Unlock Deck
k this deck
11
You are testing the equality of population means using ANOVA.The partial ANOVA table appears below.The between-groups mean square value is 1540.
Unlock Deck
Unlock for access to all 95 flashcards in this deck.
Unlock Deck
k this deck
12
You are testing the equality of population means using ANOVA and a 5% significance level.If the p-value for the Fstat that you produce is .0212, you should conclude that the population means are not equal.
Unlock Deck
Unlock for access to all 95 flashcards in this deck.
Unlock Deck
k this deck
13
You are testing the equality of population means using one-way ANOVA and a 5% significance level.If the p-value for the Fstat that you produce is .0711, you should conclude that the population means are not equal.
Unlock Deck
Unlock for access to all 95 flashcards in this deck.
Unlock Deck
k this deck
14
The within groups mean square in a one-way analysis of variance is the within groups sum of squares divided by (n-1) degrees of freedom.
Unlock Deck
Unlock for access to all 95 flashcards in this deck.
Unlock Deck
k this deck
15
You are testing the equality of three population means using samples of size 5.The Fstat value for your ANOVA is 3.256.At a 5% significance level, you should reject the null hypothesis that the population means are equal.
Unlock Deck
Unlock for access to all 95 flashcards in this deck.
Unlock Deck
k this deck
16
You are testing the equality of population means using ANOVA.The partial ANOVA table appears below.According to the table, four population means are involved in the test.
Unlock Deck
Unlock for access to all 95 flashcards in this deck.
Unlock Deck
k this deck
17
In a randomized block design, experimental units are arranged into similar groups based on extraneous factors in an effort to reduce error variation in experimental results.
Unlock Deck
Unlock for access to all 95 flashcards in this deck.
Unlock Deck
k this deck
18
The within groups mean square in a one-way analysis of variance is the within groups sum of squares (SSW) divided by the between groups sum of squares (SSB).
Unlock Deck
Unlock for access to all 95 flashcards in this deck.
Unlock Deck
k this deck
19
The within groups mean square in a one-way analysis of variance is the within groups sum of squares divided by its corresponding degrees of freedom.
Unlock Deck
Unlock for access to all 95 flashcards in this deck.
Unlock Deck
k this deck
20
You are testing the equality of four population means with four samples of size six.To compute the within-groups mean square, you should divide the total sum of squares by 3.
Unlock Deck
Unlock for access to all 95 flashcards in this deck.
Unlock Deck
k this deck
21
Use a statistical calculator or statistical software to determine the proportion of values in an F distribution that are greater than 10.3, with numerator degrees of freedom of 2 and denominator degrees of freedom of 12.
A)0.002
B)0.092
C)0.908
D)0.998
A)0.002
B)0.092
C)0.908
D)0.998
Unlock Deck
Unlock for access to all 95 flashcards in this deck.
Unlock Deck
k this deck
22
You are testing the equality of population means using ANOVA.The partial ANOVA table appears below.What is the value of the between-groups mean square?
A)464.062
B)587.5
C)2350
D)783.33
A)464.062
B)587.5
C)2350
D)783.33
Unlock Deck
Unlock for access to all 95 flashcards in this deck.
Unlock Deck
k this deck
23
You are testing the equality of two population means using samples of size 10.The Fstat value for your ANOVA is 3.60.If, instead of an F test, you had conducted a t test to test the "no difference in two population means" null hypothesis, the tstat value would be
A)3.60
B)12.96
C)1.897
D)2.965
E)The tstat value cannot be determined from the information given.
A)3.60
B)12.96
C)1.897
D)2.965
E)The tstat value cannot be determined from the information given.
Unlock Deck
Unlock for access to all 95 flashcards in this deck.
Unlock Deck
k this deck
24
A statistical procedure using two independent estimates of the same population variance to test for differences between or among the means of populations is called
A)simple regression
B)observational analysis
C)discriminant analysis
D)one-way analysis of variance
A)simple regression
B)observational analysis
C)discriminant analysis
D)one-way analysis of variance
Unlock Deck
Unlock for access to all 95 flashcards in this deck.
Unlock Deck
k this deck
25
You are testing the equality of population means using one-way ANOVA.The partial ANOVA table appears below.If the samples used in the ANOVA are all the same size, what is the sample size?
A)12
B)15
C)10
D)5
A)12
B)15
C)10
D)5
Unlock Deck
Unlock for access to all 95 flashcards in this deck.
Unlock Deck
k this deck
26
The dependent variable in an experiment is called the
A)treatment variable
B)within-groups variable
C)response variable
D)correlation variable
A)treatment variable
B)within-groups variable
C)response variable
D)correlation variable
Unlock Deck
Unlock for access to all 95 flashcards in this deck.
Unlock Deck
k this deck
27
You are testing the equality of two population means using one-way ANOVA.The critical value Fc for your test is 4.665.If, instead of an F test, you had conducted a t test to test the "no difference in population means" null hypothesis, the critical tc value would be
A)21.762
B)2.16
C)4.665
D)2.84
A)21.762
B)2.16
C)4.665
D)2.84
Unlock Deck
Unlock for access to all 95 flashcards in this deck.
Unlock Deck
k this deck
28
A study in which information from the population of interest is gathered without any attempt by those conducting the study to influence the population or intervene in any way is called a(n)
A)completely randomized study
B)block study
C)observational study
D)experimental study
A)completely randomized study
B)block study
C)observational study
D)experimental study
Unlock Deck
Unlock for access to all 95 flashcards in this deck.
Unlock Deck
k this deck
29
1% of the values in an F distribution with numerator degrees of freedom = 3 and denominator degree of freedom = 18 are greater than or equal to ______.
A)3.160
B)6.013
C)5.092
D)2.965
A)3.160
B)6.013
C)5.092
D)2.965
Unlock Deck
Unlock for access to all 95 flashcards in this deck.
Unlock Deck
k this deck
30
Which of the following is NOT a required assumption for a one-way analysis of variance?
A)each population of values has a normal distribution
B)the variance is the same for each population of values
C)at least two populations are under consideration
D)the populations have equal means
E)the observations must be independent
A)each population of values has a normal distribution
B)the variance is the same for each population of values
C)at least two populations are under consideration
D)the populations have equal means
E)the observations must be independent
Unlock Deck
Unlock for access to all 95 flashcards in this deck.
Unlock Deck
k this deck
31
You are testing the equality of population means using one-way ANOVA.The partial ANOVA table appears below.According to the table, how many group means (population means) are involved in the test?
A)4
B)3
C)2
D)5
A)4
B)3
C)2
D)5
Unlock Deck
Unlock for access to all 95 flashcards in this deck.
Unlock Deck
k this deck
32
Which of the following is true regarding the F distribution?
A)it is the ratio of two sample variances
B)it is not symmetric
C)values can never be negative
D)it has numerator degrees of freedom from sample 1 and denominator degrees of freedom from sample 2
E)all of the above
A)it is the ratio of two sample variances
B)it is not symmetric
C)values can never be negative
D)it has numerator degrees of freedom from sample 1 and denominator degrees of freedom from sample 2
E)all of the above
Unlock Deck
Unlock for access to all 95 flashcards in this deck.
Unlock Deck
k this deck
33
In an F distribution with numerator degrees of freedom of 3 and denominator degrees of freedom of 8, 95% of values are less than _____ .
A)4.066
B)7.591
C)8.845
D)27.489
A)4.066
B)7.591
C)8.845
D)27.489
Unlock Deck
Unlock for access to all 95 flashcards in this deck.
Unlock Deck
k this deck
34
A completely randomized experimental design would be the appropriate method to answer which of the following research questions?
A)To determine whether average teacher salaries differ in Ohio, Pennsylvania, and Indiana.
B)To determine whether average teacher salaries differ in Ohio, Pennsylvania, and Indiana, while controlling for differences in salaries that exist across grade levels.
C)To determine the effect of an additional year of experience on a teacher's salary.
D)To determine the joint effects of a teacher's field (math, English, etc.) and whether the teacher works in a public school or a private school on a teacher's salary.
Unlock Deck
Unlock for access to all 95 flashcards in this deck.
Unlock Deck
k this deck
35
In an F distribution with numerator degrees of freedom of 5 and denominator degrees of freedom of 8, 5% of values are greater than _____ .
A)3.688
B)4.818
C)6.632
D)10.289
A)3.688
B)4.818
C)6.632
D)10.289
Unlock Deck
Unlock for access to all 95 flashcards in this deck.
Unlock Deck
k this deck
36
In experimental design, factors not of primary interest in a study that may serve to obscure experimental results due to their effect on the response variable are called
A)extraneous factors
B)rigid factors
C)experimental factors
D)guided factors
A)extraneous factors
B)rigid factors
C)experimental factors
D)guided factors
Unlock Deck
Unlock for access to all 95 flashcards in this deck.
Unlock Deck
k this deck
37
An experiment in which we can assess the simultaneous effect of multiple factors on a response variable and in which all factor combinations are represented is called a
A)partitioning experiment
B)cross reference experiment
C)block experiment
D)factorial experiment
A)partitioning experiment
B)cross reference experiment
C)block experiment
D)factorial experiment
Unlock Deck
Unlock for access to all 95 flashcards in this deck.
Unlock Deck
k this deck
38
You are testing the equality of three population means using one-way ANOVA and a 5% significance level.If the p-value that you produce for the test is .0112, you should
A)conclude that the population means are equal.
B)not reject the "all means are equal" null hypothesis.
C)reject the alternative hypothesis.
D)conclude that at least one of the population means differs from the others.
A)conclude that the population means are equal.
B)not reject the "all means are equal" null hypothesis.
C)reject the alternative hypothesis.
D)conclude that at least one of the population means differs from the others.
Unlock Deck
Unlock for access to all 95 flashcards in this deck.
Unlock Deck
k this deck
39
In an experiment, one of the various values or states that an experimental factor can take on is called a
A)treatment
B)response
C)premonition
D)crosstab
A)treatment
B)response
C)premonition
D)crosstab
Unlock Deck
Unlock for access to all 95 flashcards in this deck.
Unlock Deck
k this deck
40
Use a statistical calculator or statistical software to determine the proportion of values in an F distribution that are greater than 8.5, with numerator degrees of freedom of 3 and denominator degrees of freedom of 15.
A)0.002
B)0.052
C)0.948
D)0.998
A)0.002
B)0.052
C)0.948
D)0.998
Unlock Deck
Unlock for access to all 95 flashcards in this deck.
Unlock Deck
k this deck
41
Crawford Industries purchases step-down electrical converters from two suppliers.The converters from the two suppliers appear to have the same average life (measured in hours) but the variability in useful life appears be different for the two suppliers.In random samples of 8 converters from supplier A and 8 converters from supplier B, the variance in sample A was 1600; the variance in sample B was 3800.Assume that the life of the converters is normally distributed in each population.Test the null hypothesis that the variance of population B is no greater than the variance of population A, against the alternative hypothesis that the variance of population B is greater than the variance of population A..Use a significance level of 5% and report the F statistic (Fstat) for this one-tailed test.
A)3.160
B)6.013
C)2.375
D)2.965
A)3.160
B)6.013
C)2.375
D)2.965
Unlock Deck
Unlock for access to all 95 flashcards in this deck.
Unlock Deck
k this deck
42
A random sample of size 8 is selected from normal population A.A second, independent, random sample of size 5 is selected from normal population B.You test a null hypothesis that the variances of the two populations are equal, using a 10% significance level.If the test statistic is calculated as the ratio of sample variance A to sample variance B, the critical F value, Fc , for your test should be
A)6.094
B)6.041
C)4.818
D)4.876
A)6.094
B)6.041
C)4.818
D)4.876
Unlock Deck
Unlock for access to all 95 flashcards in this deck.
Unlock Deck
k this deck
43
Crawford Industries purchases step-down electrical converters from two suppliers.The converters from the two suppliers appear to have the same average life (measured in hours) but the variability in useful life appears be different for the two suppliers.In random samples of 8 converters from supplier A and 8 converters from supplier B, the variance in sample A was 1600; the variance in sample B was 3800.Assume that the life of the converters is normally distrusted in each population..Test the null hypothesis that the variance of population B is no greater than the variance of population A, against the alternative hypothesis that the variation of population B variance is greater than the variance of population A.Use a significance level of 5% for this one-tailed test and report your conclusion.
A)Since Fstat is greater than Fc, we cannot reject the "variance of B no greater than variance of A" null hypothesis.
B)Since Fstat is less than Fc, we cannot reject the "variance of B no greater than variance of A" null hypothesis.
C)Since Fstat is less than Fc, we can reject the "variance of B no greater than variance of A" null hypothesis.
D)Since Fstat is greater than Fc, we can reject the "variance of B no greater than variance of A" null hypothesis.
Unlock Deck
Unlock for access to all 95 flashcards in this deck.
Unlock Deck
k this deck
44
The ANOVA table below shows partial results for a test of a "no difference in population means" null hypothesis.At a 5% significance level, what is the.critical value (Fc) for the test.?
A)4.902
B)3.718
C)5.568
D)2.758
A)4.902
B)3.718
C)5.568
D)2.758
Unlock Deck
Unlock for access to all 95 flashcards in this deck.
Unlock Deck
k this deck
45
5% of the variance ratios in an F distribution with numerator degrees of freedom = 3 and denominator degrees of freedom = 9 are greater than or equal to _____.
A)3.179
B)6.013
C)3.863
D)6.992
A)3.179
B)6.013
C)3.863
D)6.992
Unlock Deck
Unlock for access to all 95 flashcards in this deck.
Unlock Deck
k this deck
46
A random sample of size 15 selected from normal population A has a standard deviation of 80.A second, independent, random sample of size 8 from normal population B has a standard deviation of 100.You will test a null hypothesis that the standard deviations of the two populations are equal, using a 2% significance level.Report the F statistic (Fstat) for the test.
A)2.35
B)1.56
C).65
D)1.25
A)2.35
B)1.56
C).65
D)1.25
Unlock Deck
Unlock for access to all 95 flashcards in this deck.
Unlock Deck
k this deck
47
Crawford Industries purchases step-down electrical converters from two suppliers.The converters from the two suppliers appear to have the same average life (measured in hours) but the variability in useful life appears be different for the units provided by the two suppliers.In random samples of 8 converters from supplier A and 8 converters from supplier B, the standard deviation in sample A was 40 hours; the standard deviation in sample B was 55 hours.Assume that converter life is normally distributed in each population.Test the null hypothesis that the population variance B is no greater than the population variancedeviation A, against the alternative hypothesis that the population variance B is greater than population variance A.Use a significance level of 5% for this one-tailed test and report the critical F (Fc) for the test.
A)3.160
B)6.013
C)3.787
D)2.965
A)3.160
B)6.013
C)3.787
D)2.965
Unlock Deck
Unlock for access to all 95 flashcards in this deck.
Unlock Deck
k this deck
48
The ANOVA table below shows partial results for a test of a "no difference in population means" null hypothesis.The significance level for the test is 5%.Report the F statistic (Fstat) for the test.
A)12.68
B)11.62
C)8.66
D)14.35
A)12.68
B)11.62
C)8.66
D)14.35
Unlock Deck
Unlock for access to all 95 flashcards in this deck.
Unlock Deck
k this deck
49
A random sample of size 18 from normal population A has a standard deviation of 25.A random sample of size 8 from normal population B has a standard deviation of 50.You will test the hypothesis that the variance of population A is equal to the variance of population B, using a 10% significance level.Report the critical value of F (Fc) for the test.
A)2.510
B)1.393
C)2.614
D)2.965
A)2.510
B)1.393
C)2.614
D)2.965
Unlock Deck
Unlock for access to all 95 flashcards in this deck.
Unlock Deck
k this deck
50
A factorial design would be the appropriate method to answer which of the following research questions?
A)To determine whether average teacher salaries differ in Ohio, Pennsylvania, and Indiana.
B)To determine whether average teacher salaries differ in Ohio, Pennsylvania, and Indiana, controlling for salary differences across grade level.
C)To determine the effect of an additional year of experience on a teacher's salary.
D)To determine the joint effects of a teacher's field (math, English, etc.) and whether the teacher works in a public school or a private school on a teacher's salary.
Unlock Deck
Unlock for access to all 95 flashcards in this deck.
Unlock Deck
k this deck
51
Crawford Industries purchases step-down electrical converters from two suppliers.The converters from the two suppliers appear to have the same average life (measured in hours) but the variability in useful life appears be different for the the two suppliers.In random samples of 9 converters from supplier A and 9 converters from supplier B, the variance in thesample A was 600; the variance in the sample B was 2800.Assume that the life of the converters is normally distributed in each population.Test the hypothesis that the variances of the two populations are equal, using a significance level of 2%.Report the F statistic (Fstat) for the test.
A)3.160
B)6.178
C)4.667
D)2.965
A)3.160
B)6.178
C)4.667
D)2.965
Unlock Deck
Unlock for access to all 95 flashcards in this deck.
Unlock Deck
k this deck
52
A randomized block design would be the appropriate method to answer which of the following research questions?
A)To determine whether average teacher salaries differ in Ohio, Pennsylvania, and Indiana.
B)To determine whether average teacher salaries differ in Ohio, Pennsylvania, and Indiana, controlling for salary differences across grade level.
C)To determine the effect of an additional year of experience on a teacher's salary.
D)To determine the joint effects of a teacher's field (math, English, etc.) and whether the teacher works in a public school or a private school on a teacher's salary.
Unlock Deck
Unlock for access to all 95 flashcards in this deck.
Unlock Deck
k this deck
53
A random sample of size 15 from normal population A has variance of 800.A second, independent, random sample of size 7 from normal population B has a variance of 1200.You will test a null hypothesis that the variances of the two populations are equal, using a 2% significance level.Report the critical value of F (Fc) for the test, assuming that the large sample variance appears in the numerator of the test statistic.
A)1.50
B)6.013
C)4.456
D)4.142
A)1.50
B)6.013
C)4.456
D)4.142
Unlock Deck
Unlock for access to all 95 flashcards in this deck.
Unlock Deck
k this deck
54
A random sample of size 25 from normal population A has a variance of 110.A random sample of size 5 from normal population B has a variance of 200.You will test the hypothesis that the variance of population A is equal to the variance of population B, using a 2% significance level.Report the F statistic (Fstat) for the test, assuming that the larger sample variance appears in the numerator of the test statistic.
A)4.218
B)3.865
C)2.092
D)1.818
A)4.218
B)3.865
C)2.092
D)1.818
Unlock Deck
Unlock for access to all 95 flashcards in this deck.
Unlock Deck
k this deck
55
A random sample of size 25 from normal population A has a variance of 110.A random sample of size 5 from normal population B has a variance of 200.You will test the hypothesis that the variance of population A is equal to the variance of population B, using a 2% significance level.Report your conclusion.
A)Since Fstat is greater than Fc, we cannot reject the "equal variances" null hypothesis.
B)Since Fstat is less than Fc, we cannot reject the "equal variances" null hypothesis.
C)Since Fstat is less than Fc, we can reject the "equal variances" null hypothesis.
D)Since Fstat is greater than Fc, we can reject the "equal variances" null hypothesis.
Unlock Deck
Unlock for access to all 95 flashcards in this deck.
Unlock Deck
k this deck
56
The ANOVA table below shows partial results for a test of a "no difference in population means" null hypothesis.How many populations are involved in the test?
A)2
B)3
C)4
D)5
A)2
B)3
C)4
D)5
Unlock Deck
Unlock for access to all 95 flashcards in this deck.
Unlock Deck
k this deck
57
The ANOVA table below shows partial results for a test of a "no difference in population means" null hypothesis.The significance level for the test is 5%.Compute the F statistic (Fstat) for the test.
A)3.90
B)4.12
C)2.56
D)5.60
A)3.90
B)4.12
C)2.56
D)5.60
Unlock Deck
Unlock for access to all 95 flashcards in this deck.
Unlock Deck
k this deck
58
Crawford Industries purchases step-down electrical converters from two suppliers.The converters from the two suppliers appear to have the same average life (measured in hours) but the variability in useful life appears be different for the units provided by the two suppliers.In random samples of 8 converters from supplier A and 8 converters from supplier B, the standard deviation in sample A was 40 hours; the standard deviation in sample Bwas 55 hours.Assume that transformer life is normally distributed in each population..Test the null hypothesis that population variance B is no greater than the population variance A, against the alternative hypothesis that the population variance B is greater than the population variance A.Use a significance level of 5% for this one-tailed test and report your conclusion.
A)Since Fstat is greater than Fc, we cannot reject the "B no greater than A" null hypothesis.
B)Since Fstat is less than Fc, we can reject the "B no greater than A" null hypothesis.
C)Since Fstat is greater than Fc, we can reject the "B no greater than A" null hypothesis.
D)Since Fstat is less than Fc, we cannot reject the "B no greater than A" null hypothesis
Unlock Deck
Unlock for access to all 95 flashcards in this deck.
Unlock Deck
k this deck
59
A random sample of size 15 selected from normal population A has standard deviation of 80.A second, independent, random sample of size 8 selected from normal population B has a standard deviation of 100.You will test a null hypothesis that the variances of the two populations are equal, using a 2% significance level.Report your conclusion.
A)Since Fstat is greater than Fc, we cannot reject the "equal variances" null hypothesis.
B)Since Fstat is less than Fc, we cannot reject the "equal variances" null hypothesis.
C)Since Fstat is less than Fc, we can reject the "equal variances" null hypothesis.
D)Since Fstat is greater than Fc, we can reject the "equal variances" null hypothesis.
Unlock Deck
Unlock for access to all 95 flashcards in this deck.
Unlock Deck
k this deck
60
A random sample of size 9 is selected from normal population A.A second, independent, random sample of size 6 is selected from normal population B.You test a null hypothesis that the variances of the two populations are equal, using a 10% significance level.The Fstat for your test, calculated as the ratio of the variance of sample A to the variance to the variance of sample B, turns out to be 1.21.Report your conclusion.
A)Since Fstat is greater than Fc, we cannot reject the "equal variances" null hypothesis.
B)Since Fstat is less than Fc, we cannot reject the "equal variances" null hypothesis.
C)Since Fstat is less than Fc, we can reject the "equal variances" null hypothesis.
D)Since Fstat is greater than Fc, we can reject the "equal variances" null hypothesis.
Unlock Deck
Unlock for access to all 95 flashcards in this deck.
Unlock Deck
k this deck
61
Greengrow, Inc.is evaluating three new fertilizer mixes.During a trial period, five similar young plants of equal size were randomly assigned to each fertilizer mix.Plant heights (in centimeters) were measured at the end of the trial period.The tables below summarize (partially) the test results.Use the sample results to test the null hypothesis that average heights for the three populations represented here are the same, using a significance level of 5%.Compute the F value (Fstat) for the test.
A)Since the computed F (Fstat) is greater than the critical F value, we cannot reject the "no difference in population means" null hypothesis.
B)Since the p-value is greater than .025, we can reject the "no difference in population means" null hypothesis.
C)Since the p-value is greater than .05, we cannot reject the "no difference in population means" null hypothesis.
D)Since the computed F (Fstat) is greater than the critical F value, we can reject the "no difference in population means" null hypothesis.
Unlock Deck
Unlock for access to all 95 flashcards in this deck.
Unlock Deck
k this deck
62
Greengrow, Inc.is evaluating three new fertilizer mixes.During a trial period, four young plants of equal size were randomly assigned to each fertilizer mix.Plant heights (in centimeters) at the end of the trial period are shown below: You are to use the sample data to test the null hypothesis that the average heights for the three populations represented here are the same, using a significance level of 5%.Compute the F value (Fstat) for the test and report your conclusion.
A)Fstat = 3.248.Since Fstat is less than the critical F value, we cannot reject the "no difference in population means" null hypothesis.
B)Fstat = 5.655.Since Fstat is greater than the critical F value, we can reject the "no difference in population means" null hypothesis.
C)Fstat = 7.323.Since Fstat is greater than the critical F value, we can reject the "no difference in population means" null hypothesis.
D)Fstat = 0.542.Since Fstat is less than the critical F value, we cannot reject the "no difference in population means" null hypothesis.
You are to use the sample data to test the null hypothesis that the average heights for the three populations represented here are the same, using a significance level of 5%.Compute the F value (Fstat) for the test and report your conclusion.A)Fstat = 3.248.Since Fstat is less than the critical F value, we cannot reject the "no difference in population means" null hypothesis.
B)Fstat = 5.655.Since Fstat is greater than the critical F value, we can reject the "no difference in population means" null hypothesis.
C)Fstat = 7.323.Since Fstat is greater than the critical F value, we can reject the "no difference in population means" null hypothesis.
D)Fstat = 0.542.Since Fstat is less than the critical F value, we cannot reject the "no difference in population means" null hypothesis.
Unlock Deck
Unlock for access to all 95 flashcards in this deck.
Unlock Deck
k this deck
63
The golf scores for a sample of 8 rounds of golf for three players are given in the table below, along with sample standard deviations. 18-hole scores
At a 5% significance level, test the hypothesis that the average scores for the three populations are the same., The ANOVA table for the test is shown below.What is your conclusion?
A)Since Fstat is less than 5.800, we can reject the "no difference in population means" null hypothesis.
B)Since the p-value is less than .05, we can reject the "no difference in population means" null hypothesis.
C)Since Fstat is greater than Fc, we cannot reject the "no difference in population means" null hypothesis.
D)Since the p-value is less than .05, we cannot reject the "no difference in population means" null hypothesis.
At a 5% significance level, test the hypothesis that the average scores for the three populations are the same., The ANOVA table for the test is shown below.What is your conclusion?A)Since Fstat is less than 5.800, we can reject the "no difference in population means" null hypothesis.
B)Since the p-value is less than .05, we can reject the "no difference in population means" null hypothesis.
C)Since Fstat is greater than Fc, we cannot reject the "no difference in population means" null hypothesis.
D)Since the p-value is less than .05, we cannot reject the "no difference in population means" null hypothesis.
Unlock Deck
Unlock for access to all 95 flashcards in this deck.
Unlock Deck
k this deck
64
You are conducting a study to compare the characteristics of women and men in senior executive positions at major US corporations.Samples of four senior executive men and four senior executive women are selected.The table below shows the number of years of management experience before promotion to a senior executive position for each of the two samples. At a 5% significance level, you use one-way analysis of variance to test the hypothesis that the average time before promotion is the same in the populations of men and women represented here.Compute the test statistic (Fstat).
A)2.667
B)2.149
C)3.115
D)1.633
At a 5% significance level, you use one-way analysis of variance to test the hypothesis that the average time before promotion is the same in the populations of men and women represented here.Compute the test statistic (Fstat).A)2.667
B)2.149
C)3.115
D)1.633
Unlock Deck
Unlock for access to all 95 flashcards in this deck.
Unlock Deck
k this deck
65
A test involving three brands of cell phone was conducted to compare the brands with respect to the average number of battery recharges before the battery no longer functioned properly.Ten phones of each brand were tested, with the following results: Number of recharges before battery no longer functions
At a 5% significance level, test the hypothesis that the average maximum number of recharges is equal for the three brands.What is the F statistic (Fstat) for the test?
A)3.391
B)4.962
C)3.520
D)7.250
At a 5% significance level, test the hypothesis that the average maximum number of recharges is equal for the three brands.What is the F statistic (Fstat) for the test?A)3.391
B)4.962
C)3.520
D)7.250
Unlock Deck
Unlock for access to all 95 flashcards in this deck.
Unlock Deck
k this deck
66
Loomis, Inc.is evaluating three possible bonus incentive programs for its sales staff.During a trial period, a sample of four sales staff was randomly assigned to each bonus program.Individual sales figures (in $1000s) are shown below: Use the sample data to test the null hypothesis that average sales for the three populations represented here are the same, at a significance level of 5%.Report the within group mean square (MSW).
A)8300
B)834.11
C)922.22
D)688.44
Use the sample data to test the null hypothesis that average sales for the three populations represented here are the same, at a significance level of 5%.Report the within group mean square (MSW).A)8300
B)834.11
C)922.22
D)688.44
Unlock Deck
Unlock for access to all 95 flashcards in this deck.
Unlock Deck
k this deck
67
You are conducting a study to compare the characteristics of women and men in senior executive positions at major US corporations.Samples of four senior executive men and four senior executive women are selected.At a 5% significance level, you use one-way analysis of variance to test the null hypothesis that the average time before promotion is the same for men and women.Report the critical value for F (Fc) that should be used in the test.
A)5.318
B)2.306
C)5.987
D)13.745
A)5.318
B)2.306
C)5.987
D)13.745
Unlock Deck
Unlock for access to all 95 flashcards in this deck.
Unlock Deck
k this deck
68
Greengrow, Inc.is evaluating three new fertilizer mixes.During a trial period, five young plants of equal size were randomly assigned to each fertilizer mix.Plant heights (in centimeters) were measured at the end of the trial period.The tables below summarize (partially) the test results.You are to use the sample results to test the null hypothesis that average heights for the three populations represented here are the same, using a significance level of 5%.Compute the F value (Fstat) for the test.
A)2.411
B)1.957
C)3.725
D)2.571
A)2.411
B)1.957
C)3.725
D)2.571
Unlock Deck
Unlock for access to all 95 flashcards in this deck.
Unlock Deck
k this deck
69
Morton Products is testing three procedures for processing and shipping online orders.In the test, 12 orders were randomly selected.Four of the orders were randomly assigned Procedure 1, four others were assigned Procedure 2, and the remaining four were assigned Procedure 3.Processing/shipping times for each of the three samples are given below: At a 5% significance level, test the null hypothesis that the average processing/shipping times for the three populations are equal..Report the between group sum of squares (SSB).
A)108
B)92
C)64
D)56
At a 5% significance level, test the null hypothesis that the average processing/shipping times for the three populations are equal..Report the between group sum of squares (SSB).A)108
B)92
C)64
D)56
Unlock Deck
Unlock for access to all 95 flashcards in this deck.
Unlock Deck
k this deck
70
The golf scores for a sample of 10 rounds of golf for three players are given in the table below, along with sample standard deviations. 18-hole scores
At a 5% significance level, test the hypothesis that the average scores for the three populations are the same.What is the F statistic (Fstat) for the test?
A)4.900
B)8.960
C)10.568
D)7.750
At a 5% significance level, test the hypothesis that the average scores for the three populations are the same.What is the F statistic (Fstat) for the test?A)4.900
B)8.960
C)10.568
D)7.750
Unlock Deck
Unlock for access to all 95 flashcards in this deck.
Unlock Deck
k this deck
71
Morton Products is testing three procedures for processing and shipping online orders.In the test, 12 orders were randomly selected.Four of the orders were randomly assigned Procedure 1, four others were assigned Procedure 2, and the remaining four were assigned Procedure 3.Processing/shipping times for each of the three samples are given below: At a 5% significance level, test the null hypothesis that the average processing/shipping times for the three populations are the same.Report the between group sum of squares (SSB) for this test.
A)108.00
B)34.67
C)22.89
D)15.33
At a 5% significance level, test the null hypothesis that the average processing/shipping times for the three populations are the same.Report the between group sum of squares (SSB) for this test.A)108.00
B)34.67
C)22.89
D)15.33
Unlock Deck
Unlock for access to all 95 flashcards in this deck.
Unlock Deck
k this deck
72
A study is being conducted to compare characteristics of women in senior executive positions and men in senior executive positions at major US corporations.A sample of four senior executive men and four senior executive women is selected.The table below shows the number of years of management experience before promotion to a senior executive position for each of the two samples. You will use a t-test assuming equal population variances (standard deviations) to test the null hypothesis that the average time before promotion in the populations represented here is the same for men and women.The significance level is .05.Report the t-score (tstat) for the test.
A)2.407
B).920
C)3.115
D)1.633
You will use a t-test assuming equal population variances (standard deviations) to test the null hypothesis that the average time before promotion in the populations represented here is the same for men and women.The significance level is .05.Report the t-score (tstat) for the test.A)2.407
B).920
C)3.115
D)1.633
Unlock Deck
Unlock for access to all 95 flashcards in this deck.
Unlock Deck
k this deck
73
A test involving three brands of cell phone was conducted to compare the brands with respect to the average number of battery recharges before the battery no longer functioned properly.Six phones of each brand were tested, with the following results: Number of recharges before battery no longer functions
At a 5% significance level, test the hypothesis that the average maximum number of possible recharges prior to failure is the same for all three brands.The ANOVA table for the test is shown below.Complete the table and report your conclusion.
A)Since Fstat is greater than 3.682, we cannot reject the "equal population means" null hypothesis.
B)Since the p-value is greater than .05, we can reject the "equal population means" null hypothesis.
C)Since Fstat is greater than Fc, we can reject the "equal population means" null hypothesis.
D)Since the p-value is less than .05, we cannot reject the "equal population means" null hypothesis.
At a 5% significance level, test the hypothesis that the average maximum number of possible recharges prior to failure is the same for all three brands.The ANOVA table for the test is shown below.Complete the table and report your conclusion.A)Since Fstat is greater than 3.682, we cannot reject the "equal population means" null hypothesis.
B)Since the p-value is greater than .05, we can reject the "equal population means" null hypothesis.
C)Since Fstat is greater than Fc, we can reject the "equal population means" null hypothesis.
D)Since the p-value is less than .05, we cannot reject the "equal population means" null hypothesis.
Unlock Deck
Unlock for access to all 95 flashcards in this deck.
Unlock Deck
k this deck
74
You are conducting a study to compare the characteristics of women and men in senior executive positions at major US corporations.Samples of four senior executive men and four senior executive women are selected.The table below shows the number of years of management experience before promotion to a senior executive position for each of the two samples. At a 5% significance level, you conduct a t-test (assuming equal population variances) to test the null hypothesis that the average time before promotion is the same for men and women.The test statistic (tstat) turns out to be 2.121.Report your conclusion.
A)Since the test statistic is greater in absolute value than the critical t-score for the test, we reject the "no difference" null hypothesis.
B)Since the test statistic is less in absolute value than the critical t-score for the test, we cannot reject the "no difference" null hypothesis
C)Since the test statistic is greater in absolute value than the critical t-score for the test, we cannot reject the "no difference" null hypothesis.
D)Since the test statistic is less in absolute value than the critical t-score for the test, we reject the "no difference" null hypothesis.
At a 5% significance level, you conduct a t-test (assuming equal population variances) to test the null hypothesis that the average time before promotion is the same for men and women.The test statistic (tstat) turns out to be 2.121.Report your conclusion.A)Since the test statistic is greater in absolute value than the critical t-score for the test, we reject the "no difference" null hypothesis.
B)Since the test statistic is less in absolute value than the critical t-score for the test, we cannot reject the "no difference" null hypothesis
C)Since the test statistic is greater in absolute value than the critical t-score for the test, we cannot reject the "no difference" null hypothesis.
D)Since the test statistic is less in absolute value than the critical t-score for the test, we reject the "no difference" null hypothesis.
Unlock Deck
Unlock for access to all 95 flashcards in this deck.
Unlock Deck
k this deck
75
Kensington, Inc.is evaluating three possible bonus incentive programs for its sales staff.During a trial period, a sample of four sales staff was randomly assigned to each bonus program.Individual sales figures (in $1000s) are shown below: Use the sample data to test the null hypothesis that average sales for the three populations represented here are the same, at a significance level of 5%.Report the between group mean square (MSB).
A)1160
B)1300
C)1020
D)1800
Use the sample data to test the null hypothesis that average sales for the three populations represented here are the same, at a significance level of 5%.Report the between group mean square (MSB).A)1160
B)1300
C)1020
D)1800
Unlock Deck
Unlock for access to all 95 flashcards in this deck.
Unlock Deck
k this deck
76
You are conducting a study to compare the characteristics of women and men in senior executive positions at major US corporations.Samples of four senior executive men and four senior executive women are selected.At a 5% significance level, you use a t-test assuming equal population variances to test the null hypothesis that the average time before promotion is the same for men and women.Report the critical value for t (tc) that should be used in the test.
A)2.447
B)2.306
C)3.707
D)3.355
A)2.447
B)2.306
C)3.707
D)3.355
Unlock Deck
Unlock for access to all 95 flashcards in this deck.
Unlock Deck
k this deck
77
You are conducting a study to compare the characteristics of women and men in senior executive positions at major US corporations.Samples of four senior executive men and four senior executive women are selected.At a 5% significance level, At a 5% significance leve, you use one-way analysis of variance to test the null hypothesis that the average time before promotion is the same for men and women.The tables below show partial results.Report the test statistic (Fstat).
A)6.320
B)2.496
C)5.467
D)8.000
A)6.320
B)2.496
C)5.467
D)8.000
Unlock Deck
Unlock for access to all 95 flashcards in this deck.
Unlock Deck
k this deck
78
Morton Products is testing three procedures for processing and shipping online orders.In the test, 12 orders were randomly selected.Four of the orders were randomly assigned Procedure 1, four others were assigned Procedure 2, and the remaining four were assigned Procedure 3.Processing/shipping times for each of the three samples are given below: At a 5% significance level, test the null hypothesis that the average processing/shipping times for the three populations are equal.Report the between group sum of squares (SSB) for this test.
A)144
B)56
C)24
D)68
At a 5% significance level, test the null hypothesis that the average processing/shipping times for the three populations are equal.Report the between group sum of squares (SSB) for this test.A)144
B)56
C)24
D)68
Unlock Deck
Unlock for access to all 95 flashcards in this deck.
Unlock Deck
k this deck
79
Loomis, Inc.is evaluating three possible bonus incentive programs for its sales staff.During a trial period, a sample of four sales staff was randomly assigned to each bonus program.Sales figures (in $1000) are shown below: Use the sample data to test the null hypothesis that the average sales for the three populations represented here are the same, using a significance level of 5%.Report the F value (Fstat) for the test.
A)4.151
B)3.236
C)5.197
D)2.305
Use the sample data to test the null hypothesis that the average sales for the three populations represented here are the same, using a significance level of 5%.Report the F value (Fstat) for the test.A)4.151
B)3.236
C)5.197
D)2.305
Unlock Deck
Unlock for access to all 95 flashcards in this deck.
Unlock Deck
k this deck
80
Morton Products is testing three procedures for processing and shipping online orders.In the test, 12 orders were randomly selected.Four of the orders were randomly assigned Procedure 1, four others were assigned Procedure 2, and the remaining four were assigned Procedure 3.Processing/shipping times for each of the three samples are given below: At a 5% significance level, test the null hypothesis that the average processing/shipping times for the three are equal.Report the within group sum of squares (SSW) for this test.
A)104
B)56
C)82
D)94
At a 5% significance level, test the null hypothesis that the average processing/shipping times for the three are equal.Report the within group sum of squares (SSW) for this test.A)104
B)56
C)82
D)94
Unlock Deck
Unlock for access to all 95 flashcards in this deck.
Unlock Deck
k this deck
Unlock Deck
Unlock for access to all 95 flashcards in this deck.


