Exam 13: F Tests and Analysis of Variance
Exam 1: An Introduction to Statistics44 Questions
Exam 2: Descriptive Statistics I: Elementary Data Presentation and Description147 Questions
Exam 3: Descriptive Statistics II: Additional Descriptive Measures and Data Displays128 Questions
Exam 4: Probability147 Questions
Exam 5: Discrete Probability Distributions144 Questions
Exam 6: Continuous Probability Distributions141 Questions
Exam 7: Statistical Inference: Estimating a Population Mean134 Questions
Exam 8: Interval Estimates for Proportions, Mean Differences and Proportion Differences19 Questions
Exam 9: Statistical Hypothesis Testing: Hypothesis Tests for a Population Mean62 Questions
Exam 10: Hypothesis Tests for Proportions, Mean Differences and Proportion Differences39 Questions
Exam 11: Basic Regression Analysis111 Questions
Exam 12: Multiple Regression53 Questions
Exam 13: F Tests and Analysis of Variance95 Questions
Exam 14: Experimental Designonline Only64 Questions
Exam 16: Chi-Square Tests145 Questions
Select questions type
One-way analysis of variance is being used to test the equality of three population means using samples of size 10 from the first population, 12 from the second population and 8 from the third population.The test statistic (Fstat) is 4.280.What is the critical value (Fc) for the test if the significance level is 5%?
Free
(Multiple Choice)
4.9/5  (34)
(34)
Correct Answer: Verified
A
In an F distribution with numerator degrees of freedom of 3 and denominator degrees of freedom of 8, 95% of values are less than _____ .
Free
(Multiple Choice)
4.8/5 (39)
Correct Answer:Verified
A
You are conducting a study to compare the characteristics of women and men in senior executive positions at major US corporations.Samples of four senior executive men and four senior executive women are selected.At a 5% significance level, At a 5% significance leve, you use one-way analysis of variance to test the null hypothesis that the average time before promotion is the same for men and women.The tables below show partial results.Report the test statistic (Fstat). 
Free
(Multiple Choice)
4.7/5 (30)
Correct Answer:Verified
D
Use a statistical calculator or statistical software to determine the proportion of values in an F distribution that are greater than 10.3, with numerator degrees of freedom of 2 and denominator degrees of freedom of 12.
(Multiple Choice)
4.8/5 (34)
In an F distribution with numerator degrees of freedom of 5 and denominator degrees of freedom of 8, 5% of values are greater than _____ .
(Multiple Choice)
4.9/5 (42)
A random sample of size 25 from normal population A has a variance of 110.A random sample of size 5 from normal population B has a variance of 200.You will test the hypothesis that the variance of population A is equal to the variance of population B, using a 2% significance level.Report your conclusion.
(Multiple Choice)
4.8/5 (36)
Morton Products is testing three procedures for processing and shipping online orders.In the test, 12 orders were randomly selected.Four of the orders were randomly assigned Procedure 1, four others were assigned Procedure 2, and the remaining four were assigned Procedure 3.Processing/shipping times for each of the three samples are given below: 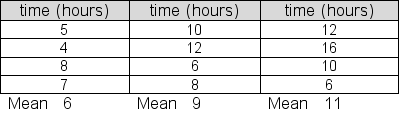 At a 5% significance level, test the null hypothesis that the average processing/shipping times for the three are equal.Report the within group sum of squares (SSW) for this test.
(Multiple Choice)
4.8/5 (41)
The ANOVA table below shows partial results for a test of a "no difference in population means" null hypothesis.The significance level for the test is 5%.Compute the F statistic (Fstat) for the test. 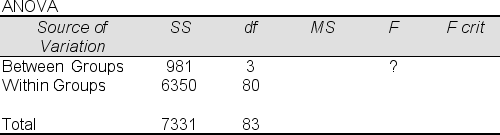
(Multiple Choice)
4.8/5 (33)
You are testing the equality of population means using ANOVA.The partial ANOVA table appears below.What is the value of the between-groups mean square? 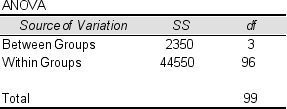
(Multiple Choice)
4.7/5 (38)
A randomized block design would be the appropriate method to answer which of the following research questions?
(Multiple Choice)
4.8/5 (33)
An experiment in which we can assess the simultaneous effect of multiple factors on a response variable and in which all factor combinations are represented is called a
(Multiple Choice)
4.8/5 (42)
A study in which information from the population of interest is gathered without any attempt by those conducting the study to influence the population or intervene in any way is called a(n)
(Multiple Choice)
4.9/5 (43)
Use a statistical calculator or statistical software to determine the proportion of values in an F distribution that are greater than 8.5, with numerator degrees of freedom of 3 and denominator degrees of freedom of 15.
(Multiple Choice)
4.8/5 (34)
Loomis, Inc.is evaluating three possible bonus incentive programs for its sales staff.During a trial period, a sample of four sales staff was randomly assigned to each bonus program.Individual sales figures (in $1000s) are shown below: 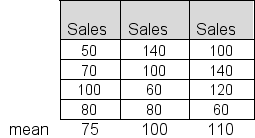 Use the sample data to test the null hypothesis that average sales for the three populations represented here are the same, at a significance level of 5%.Report the within group mean square (MSW).
(Multiple Choice)
5.0/5 (25)
Which of the following is true regarding the F distribution?
(Multiple Choice)
4.8/5 (47)
A random sample of size 15 from normal population A has variance of 800.A second, independent, random sample of size 7 from normal population B has a variance of 1200.You will test a null hypothesis that the variances of the two populations are equal, using a 2% significance level.Report the critical value of F (Fc) for the test, assuming that the large sample variance appears in the numerator of the test statistic.
(Multiple Choice)
4.9/5 (39)
You are testing the equality of population means using ANOVA.The partial ANOVA table appears below.If the samples used in the ANOVA are all the same size, that sample size must be 15.

(True/False)
4.8/5 (38)
The ANOVA table below shows partial results for a test of a "no difference in population means" null hypothesis.The significance level for the test is 5%.Report the F statistic (Fstat) for the test. 
(Multiple Choice)
4.9/5 (36)
A random sample of size 9 is selected from normal population A.A second, independent, random sample of size 6 is selected from normal population B.You test a null hypothesis that the variances of the two populations are equal, using a 10% significance level.The Fstat for your test, calculated as the ratio of the variance of sample A to the variance to the variance of sample B, turns out to be 1.21.Report your conclusion.
(Multiple Choice)
4.9/5 (34)
The computed F value (Fstat) in a one-way analysis of variance is the ratio of the between groups sum of squares (SSB) to the within groups sum of squares (SSW).
(True/False)
4.9/5 (42)
Filters
- Essay(0)
- Multiple Choice(0)
- Short Answer(0)
- True False(0)
- Matching(0)