Deck 53: Populations and Life History Traits
Full screen (f)
Question
Question
Use the graph to answer the following question. 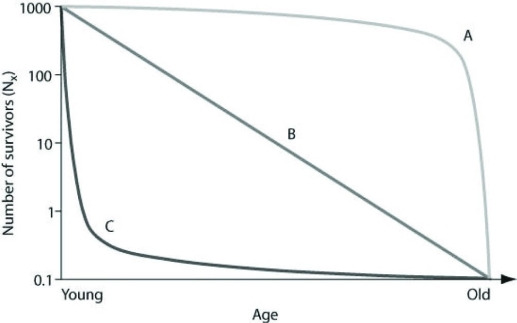 Which of the following examples are plausible explanations for a population that would produce curve A in the figure?
A) ongoing predation of pocket gophers throughout their lives
B) susceptibility of middle-aged humans to heart disease
C) higher predation success by wolves of older, slower elk
D) high seedling mortality in sunflowers
Which of the following examples are plausible explanations for a population that would produce curve A in the figure?A) ongoing predation of pocket gophers throughout their lives
B) susceptibility of middle-aged humans to heart disease
C) higher predation success by wolves of older, slower elk
D) high seedling mortality in sunflowers
Question
Use the graph to answer the following question. 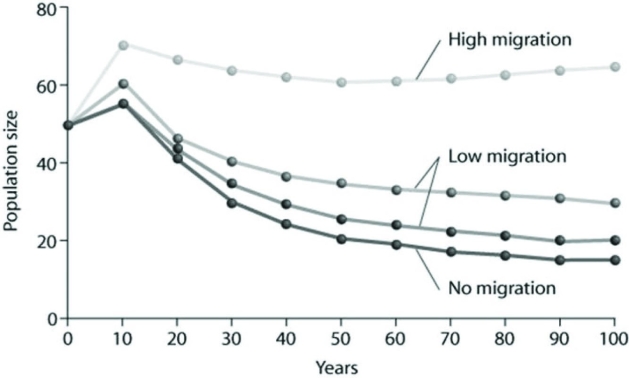 Based on the data provided, what factor of those listed below appears to be the most important in stabilizing the population from its initial size over the subsequent 100 years?
A) The absence of migration
B) A low migration rate
C) A high migration rate
Based on the data provided, what factor of those listed below appears to be the most important in stabilizing the population from its initial size over the subsequent 100 years?A) The absence of migration
B) A low migration rate
C) A high migration rate
Question
Question
Question
Question
Question
Question
Use the graph to answer the following question. 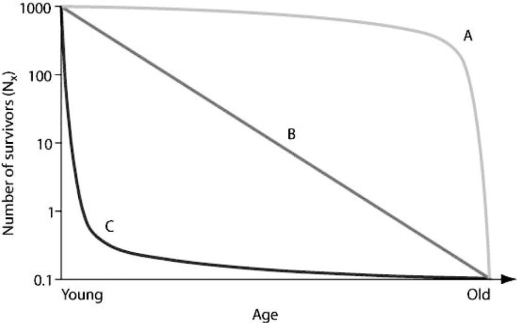 Which survivorship curve most closely models a population of mice in which females consistently give birth to a large number of offspring, and the mortality rate of the offspring is fairly regular during each year of their lives, regardless of their age?
A) curve A
B) curve B
C) curve C
D) curves A or C
Which survivorship curve most closely models a population of mice in which females consistently give birth to a large number of offspring, and the mortality rate of the offspring is fairly regular during each year of their lives, regardless of their age?A) curve A
B) curve B
C) curve C
D) curves A or C
Question
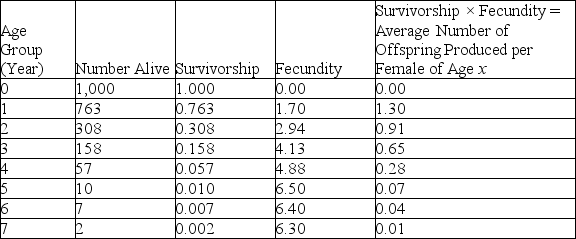
Use the table to answer the following question.
Life Table for Zootoca vivipara in the Netherlands

Data are from Strijbosch and Creemers, 1988.
The data in the table are most consistent with which of the following claims about the population of the Eurasian lizard, Zootoca vivipara?
A) the population is increasing
B) the population is decreasing
C) the population is stable
D) the population is decreasing, then increasing
Life Table for Zootoca vivipara in the Netherlands
Data are from Strijbosch and Creemers, 1988.
The data in the table are most consistent with which of the following claims about the population of the Eurasian lizard, Zootoca vivipara?
A) the population is increasing
B) the population is decreasing
C) the population is stable
D) the population is decreasing, then increasing
Question
Question
Use the hypothetical or idealized survivorship curves in the figure to answer the following question.  Which of the following curves describes survivorship that is most typical in marine fish or mollusks?
A) A
B) B
C) C
D) E
Which of the following curves describes survivorship that is most typical in marine fish or mollusks?A) A
B) B
C) C
D) E
Question
Question
Use the graph to answer the following question. 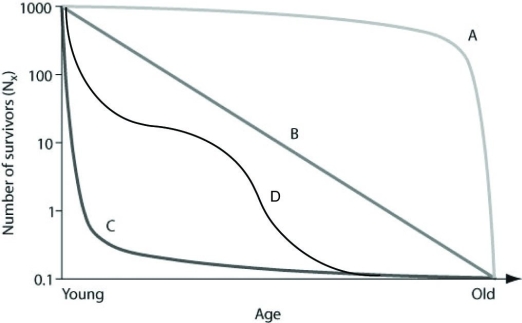 In the figure, which of the following survivorship curves is most consistent with humans who are living in developed countries where most of the population has consistent access to resources such as food, water, shelter and health care?
A) curve A
B) curve B
C) curve C
D) curve D
In the figure, which of the following survivorship curves is most consistent with humans who are living in developed countries where most of the population has consistent access to resources such as food, water, shelter and health care?A) curve A
B) curve B
C) curve C
D) curve D
Question
Use the hypothetical or idealized survivorship curves in the figure to answer the following question.  Which statement best explains survivorship curve B?
A) It is likely a species that provides little postnatal care, but lots of care for offspring during midlife as indicated by increased survivorship.
B) This curve is likely for a species that produces lots of offspring, only a few of which are expected to survive.
C) It is likely a species where no individuals in the cohort die when they are at 60-70% relative age.
D) Survivorship can only decrease; therefore, this curve could not happen in nature.
Which statement best explains survivorship curve B?A) It is likely a species that provides little postnatal care, but lots of care for offspring during midlife as indicated by increased survivorship.
B) This curve is likely for a species that produces lots of offspring, only a few of which are expected to survive.
C) It is likely a species where no individuals in the cohort die when they are at 60-70% relative age.
D) Survivorship can only decrease; therefore, this curve could not happen in nature.
Question
Use the table to answer the following question.
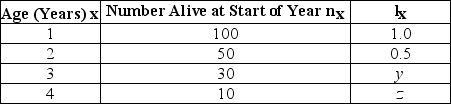
In the accompanying life table of a hypothetical population, what are the missing values for lx (y and z)? lx = the proportion alive at the start of year (age specific survivorship rate).
A) y = 0.3, z = 0.1
B) y = 1.0, z = 0.5
C) y = 0.5, z = 0.1
D) y = 1.0, z = 0.2
In the accompanying life table of a hypothetical population, what are the missing values for lx (y and z)? lx = the proportion alive at the start of year (age specific survivorship rate).
A) y = 0.3, z = 0.1
B) y = 1.0, z = 0.5
C) y = 0.5, z = 0.1
D) y = 1.0, z = 0.2
Question
Question
Use the table to answer the following question.
Life Table for Zootoca vivipara in the Netherlands
Data are from Strijbosch and Creemers, 1988.
Removing which of the following age-groups from the population would result in the largest decrease in population growth of Z. vivipara?
A) age-group 1
B) age-group 2
C) age-group 3
D) age-group 4
Life Table for Zootoca vivipara in the Netherlands
Data are from Strijbosch and Creemers, 1988.
Removing which of the following age-groups from the population would result in the largest decrease in population growth of Z. vivipara?
A) age-group 1
B) age-group 2
C) age-group 3
D) age-group 4
Question
Question
Use the hypothetical or idealized survivorship curves in the figure to answer the following question. 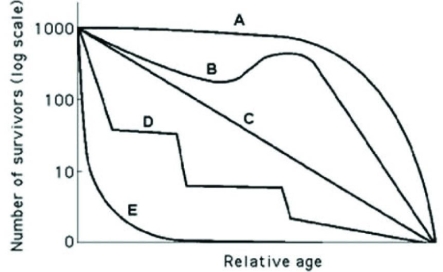 Which of the following curves best describes survivorship in a typical elephant population?
A) A
B) B
C) C
D) D
Which of the following curves best describes survivorship in a typical elephant population?A) A
B) B
C) C
D) D
Question
Question
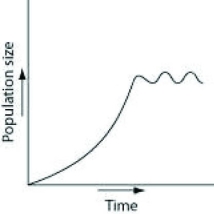
Use the graph to answer the following question. 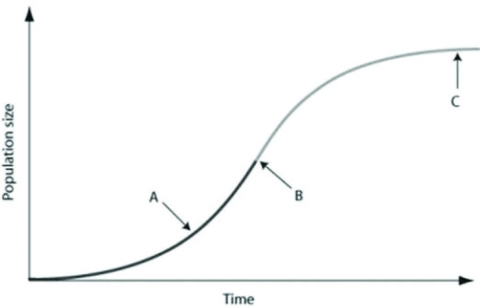 In the figure, which of the arrows represents the carrying capacity?
A) arrow A
B) arrow B
C) arrow C
D) the period of time prior up to arrow A
In the figure, which of the arrows represents the carrying capacity?A) arrow A
B) arrow B
C) arrow C
D) the period of time prior up to arrow A
Question
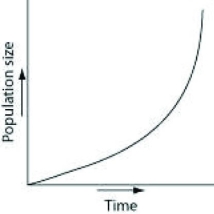
Use the graph to answer the following question. 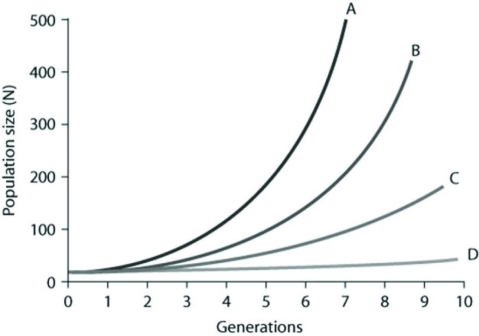 In the figure, curves A-D depict per capita rate increases (r). Which of the following best explains the difference between the shapes of these curves?
A) The population growth is logistic as generations continue to form.
B) The growth is exponential for curves A and B, but because population growth for C and D is slower, it is considered logistic.
C) Population growth within each curve gets steeper as time passes because growth depends on both per capita rates of increase and current population size.
D) Curve A has the fastest rate of logistic growth.
In the figure, curves A-D depict per capita rate increases (r). Which of the following best explains the difference between the shapes of these curves?A) The population growth is logistic as generations continue to form.
B) The growth is exponential for curves A and B, but because population growth for C and D is slower, it is considered logistic.
C) Population growth within each curve gets steeper as time passes because growth depends on both per capita rates of increase and current population size.
D) Curve A has the fastest rate of logistic growth.
Question
Question
Question
Question
Question
An undergraduate student is working in a research lab, and starting with a single bacterium, she cultures it in a flask of ideal nutrient broth at an optimum temperature over a two-hour period? Assume resources do not become limiting over this time frame.
A)
B)

C)

D)

A)
B)
C)
D)
Question
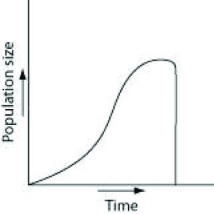
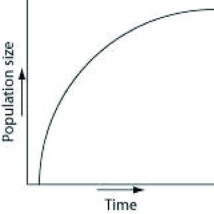
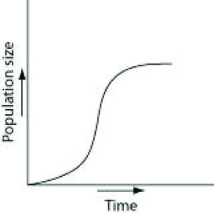
Which of the following graphs best illustrates the growth curve of a small population of rodents that has increased to a static carrying capacity?
A)
B)

C)

D)
A)
B)
C)
D)
Question
Question
Question
Question
Question
Question
Question
Question
Question
Question
In the process of researching how to manage a large game ranch, historical accounts indicated that a species of deer that once lived there had been extirpated. After doing some research to determine what might be an appropriately sized founding population, managers reintroduced deer to the ranch. The population then increased for several generations, and the managers graphed the number of individuals (vertical axis) against time, or the number of generations (horizontal axis). If no natural predators are impacting the population, which of the following graphs best represents the population?
A)

B)

C)
D)

A)
B)
C)
D)
Question
Question
Question
Question
Use the figure to answer the following question. 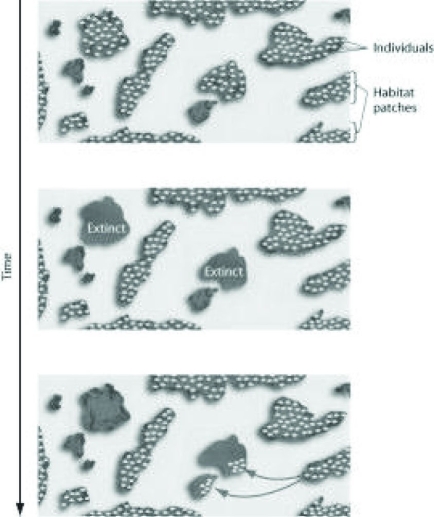 Which of the following topics is represented by the figures showing the fate of individuals in distinct habitat patches over time?
A) metapopulations
B) extinction
C) emigration
D) both extinction and emigration
Which of the following topics is represented by the figures showing the fate of individuals in distinct habitat patches over time?A) metapopulations
B) extinction
C) emigration
D) both extinction and emigration
Question
Question
Use the graph to answer the following question. 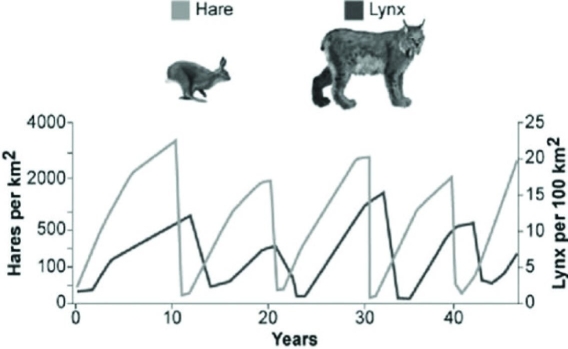 Which hypothesis is most consistent with these data on hare and lynx populations in the graph?
A) Hares decrease in number just before lynx population size begins to increase.
B) Lynx likely control hare population density.
C) Lynx and hare populations are independent of each other.
D) The relationship between the populations cannot be determined only from this graph.
Which hypothesis is most consistent with these data on hare and lynx populations in the graph?A) Hares decrease in number just before lynx population size begins to increase.
B) Lynx likely control hare population density.
C) Lynx and hare populations are independent of each other.
D) The relationship between the populations cannot be determined only from this graph.
Question
Question
Which of the following graphs illustrates the growth over several seasons of a population of snowshoe hares that were introduced to an appropriate habitat also inhabited by predators in northern Canada?
A)

B)

C)

D)
A)
B)
C)
D)
Question
Use the graphs to answer the following question. 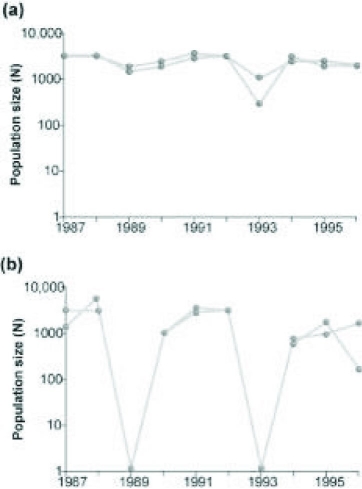 Graph (b) in the figure shows the normal fluctuations of a population of grouse, a ground-nesting bird. Assuming graph (a) in the figure is the result of some experimental treatment in the grouse population, what can be concluded?
A) The experimental treatment intensified the population cycling.
B) The experimental treatment did not affect population cycling in this species.
C) The experimental treatment has most likely identified the cause of population cycling.
D) The experimental treatment involved the introduction of a predator of the bird.
Graph (b) in the figure shows the normal fluctuations of a population of grouse, a ground-nesting bird. Assuming graph (a) in the figure is the result of some experimental treatment in the grouse population, what can be concluded?A) The experimental treatment intensified the population cycling.
B) The experimental treatment did not affect population cycling in this species.
C) The experimental treatment has most likely identified the cause of population cycling.
D) The experimental treatment involved the introduction of a predator of the bird.
Question
Often the growth cycle of one population has an effect on the cycle of another. As moose populations increase, for example, wolf populations also increase. Thus, if we are considering the logistic equation for the wolf population,  = rN
= rN 
Which of the factors accounts for the effect of the moose population?
A) r
B) N
C) rN
D) K
= rN Which of the factors accounts for the effect of the moose population?
A) r
B) N
C) rN
D) K
Question
Use the figure to answer the following question. 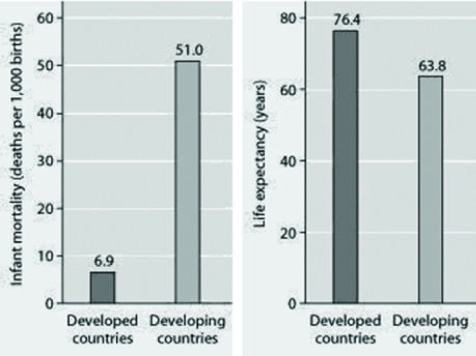 Infant mortality and life expectancy at birth in developed and
Developing countries (data as of 2005).
What is a logical conclusion that can be drawn from the graphs about developed countries?
A) lower infant mortality rates and lower life expectancy than developing countries
B) higher infant mortality rates and lower life expectancy than developing countries
C) lower infant mortality rates and higher life expectancy than developing countries
D) higher infant mortality rates and higher life expectancy than developing countries
Infant mortality and life expectancy at birth in developed andDeveloping countries (data as of 2005).
What is a logical conclusion that can be drawn from the graphs about developed countries?
A) lower infant mortality rates and lower life expectancy than developing countries
B) higher infant mortality rates and lower life expectancy than developing countries
C) lower infant mortality rates and higher life expectancy than developing countries
D) higher infant mortality rates and higher life expectancy than developing countries
Question
Use the figures to answer the following question. 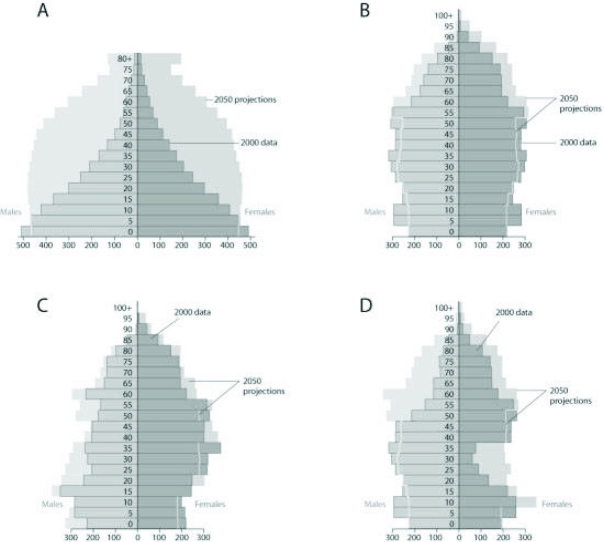 Based on the age-structure diagrams in the figure and on the large population of baby boomers (a demographic cohort born at a reproductive peak after World War II between 1946-1964 in the United States), which graph best reflects U.S. population in 20 years?
A) A
B) B
C) C
D) D
Based on the age-structure diagrams in the figure and on the large population of baby boomers (a demographic cohort born at a reproductive peak after World War II between 1946-1964 in the United States), which graph best reflects U.S. population in 20 years?A) A
B) B
C) C
D) D
Question
Use the figure to answer the following question. 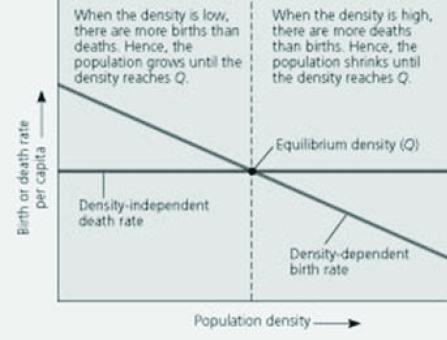 In the figure, one could depict a different scenario where the death rate per capita was dependent upon (and positively correlated with) the density of the population, and the birth rate was instead density independent. Which of the following would occur as the density of the population increased?
A) the death rate would decrease and the birth rate would decrease
B) the death rate would increase and the birth rate would decrease
C) the death rate would increase and the birth rate would remain stable
D) the death rate would remain stable and the birth rate would increase
In the figure, one could depict a different scenario where the death rate per capita was dependent upon (and positively correlated with) the density of the population, and the birth rate was instead density independent. Which of the following would occur as the density of the population increased?A) the death rate would decrease and the birth rate would decrease
B) the death rate would increase and the birth rate would decrease
C) the death rate would increase and the birth rate would remain stable
D) the death rate would remain stable and the birth rate would increase
Question
Which of the following is most consistent with the logistic growth equation,  = rN
= rN 
?
A) the number of individuals added per unit time is greatest when N is close to zero
B) the per capita growth rate (r) increases as N approaches K
C) population growth is zero when N equals K
D) the population grows exponentially when K is small
= rN ?
A) the number of individuals added per unit time is greatest when N is close to zero
B) the per capita growth rate (r) increases as N approaches K
C) population growth is zero when N equals K
D) the population grows exponentially when K is small
Question
Use the graph to answer the following question.  Based on the data graphed here, which size clutch would likely result in the highest estimated overall reproductive success (fecundity) after one year?
A) 2
B) 3
C) 4
D) 6
Based on the data graphed here, which size clutch would likely result in the highest estimated overall reproductive success (fecundity) after one year?A) 2
B) 3
C) 4
D) 6
Question
Use the graph to answer the following question. 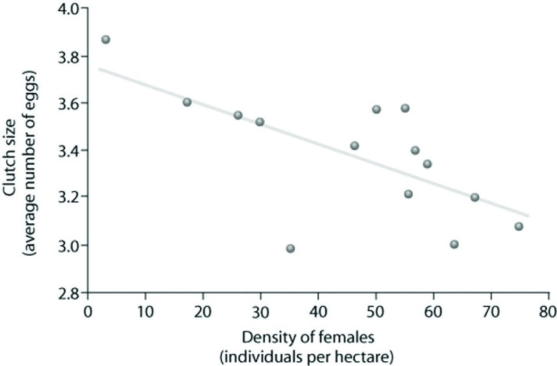 Which of the following claims can be best supported using the data?
A) Clutch size is always lowest at a density of about 35 females.
B) As female density increases, survivorship decreases.
C) Clutch size increases as female density increases.
D) Clutch size is inversely related to density.
Which of the following claims can be best supported using the data?A) Clutch size is always lowest at a density of about 35 females.
B) As female density increases, survivorship decreases.
C) Clutch size increases as female density increases.
D) Clutch size is inversely related to density.
Question
Use the graph to answer the following question. 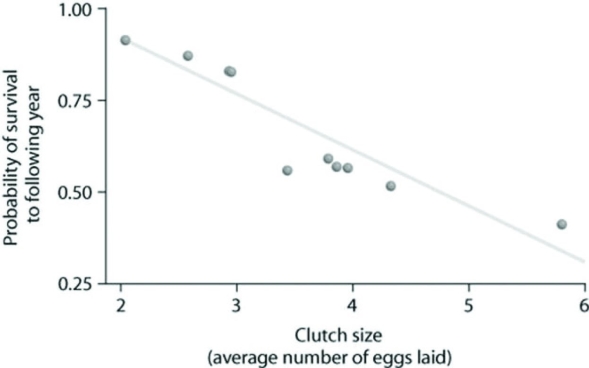 Which of the following hypotheses is most consistent with the data with respect to survival and clutch size?
A) Animals with low survival tend to have smaller clutch sizes.
B) Large clutch size correlates with low survival.
C) Animals with high survival tend to have medium-sized clutches.
D) A large clutch size will result in the highest population growth rate.
Which of the following hypotheses is most consistent with the data with respect to survival and clutch size?A) Animals with low survival tend to have smaller clutch sizes.
B) Large clutch size correlates with low survival.
C) Animals with high survival tend to have medium-sized clutches.
D) A large clutch size will result in the highest population growth rate.
Question
Use the figure to answer the following question. 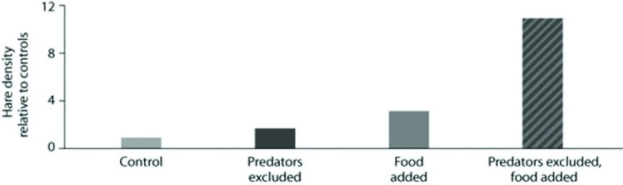 Which conclusion below is best supported by the data?
A) Food is the only factor in controlling hare population size.
B) Exclusion of lynx is the most important factor in controlling hare population size.
C) The effect of excluding predators and adding food in the same experiment is greater than the sum of excluding lynx alone plus adding food when considered individually.
D) Adding abundant food has a smaller effect on hare success than removing all of their predators.
Which conclusion below is best supported by the data?A) Food is the only factor in controlling hare population size.
B) Exclusion of lynx is the most important factor in controlling hare population size.
C) The effect of excluding predators and adding food in the same experiment is greater than the sum of excluding lynx alone plus adding food when considered individually.
D) Adding abundant food has a smaller effect on hare success than removing all of their predators.
Question
Question
Question
Question
According to the logistic growth equation below, ________.  = rN
= rN 
A) the number of individuals added per unit time is greatest when N is close to zero
B) the per capita population growth rate increases as N approaches K
C) population growth is zero when N equals K
D) the population grows exponentially when K is small
= rN A) the number of individuals added per unit time is greatest when N is close to zero
B) the per capita population growth rate increases as N approaches K
C) population growth is zero when N equals K
D) the population grows exponentially when K is small
Question
Question
Question
The following question refers to the figure below, which depicts the age structure of populations. 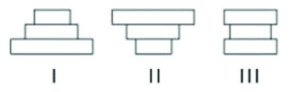 In the figure, populations of a plant species labeled I, II, and III are depicted using simplified age structures containing three age classes: young seedlings, middle-aged juveniles, and older adults. Which populations appear to have stable growth?
A) I
B) III
C) II
D) None of the above
In the figure, populations of a plant species labeled I, II, and III are depicted using simplified age structures containing three age classes: young seedlings, middle-aged juveniles, and older adults. Which populations appear to have stable growth?A) I
B) III
C) II
D) None of the above
Question
Question
Question
Question
Use the figure to answer the following question. 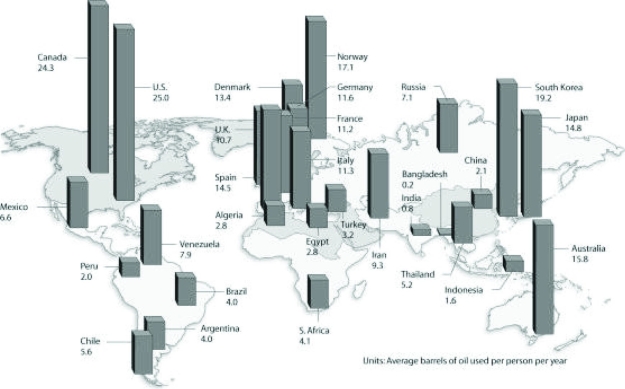 Based on the figure and given the populations of the following countries, which country uses the most oil overall?
A) United States (population = 320 million)
B) Canada (population = 36 million)
C) China (population = 1.33 billion)
D) Russia (population = 144 million)
Based on the figure and given the populations of the following countries, which country uses the most oil overall?A) United States (population = 320 million)
B) Canada (population = 36 million)
C) China (population = 1.33 billion)
D) Russia (population = 144 million)
Question
Question
Question
Question
Question

Unlock Deck
Sign up to unlock the cards in this deck!
Unlock Deck
Unlock Deck
1/73
Play
Full screen (f)
Deck 53: Populations and Life History Traits
1
To measure the population of lake trout in a 250-hectare lake, 500 individual trout were captured using nets and marked with a fin clip, then returned to the lake. The next week, the trout capture was repeated, and out of the 200 lake trout that were caught, 50 had fin clips. Using the mark-recapture estimate, the lake trout population size is predicted to be closest to which of the following?
A) 200
B) 400
C) 1,600
D) 2,000
A) 200
B) 400
C) 1,600
D) 2,000
D
2
Use the graph to answer the following question. Which of the following examples are plausible explanations for a population that would produce curve A in the figure?
A) ongoing predation of pocket gophers throughout their lives
B) susceptibility of middle-aged humans to heart disease
C) higher predation success by wolves of older, slower elk
D) high seedling mortality in sunflowers
Which of the following examples are plausible explanations for a population that would produce curve A in the figure?A) ongoing predation of pocket gophers throughout their lives
B) susceptibility of middle-aged humans to heart disease
C) higher predation success by wolves of older, slower elk
D) high seedling mortality in sunflowers
C
3
Use the graph to answer the following question. Based on the data provided, what factor of those listed below appears to be the most important in stabilizing the population from its initial size over the subsequent 100 years?
A) The absence of migration
B) A low migration rate
C) A high migration rate
Based on the data provided, what factor of those listed below appears to be the most important in stabilizing the population from its initial size over the subsequent 100 years?A) The absence of migration
B) A low migration rate
C) A high migration rate
C
4
Which of the following techniques would most accurately measure the dispersion pattern of the population being studied?
A) counting the number of times a one-kilometer transect is intersected by tracks of red squirrels after a snowfall
B) measuring the distance between several burrows within a large prairie dog colony in a grassland
C) measuring the average distance between individuals and their nearest neighbor, and then analyzing the variation and comparing those measurements at larger scales
D) counting the number of zebras from airplane census observations
Unlock Deck
Unlock for access to all 73 flashcards in this deck.
Unlock Deck
k this deck
5
Which of the following techniques would provide the most accurate data on population density?
A) Count the number of nests of a particular species of songbird and multiply this by a factor that extrapolates these data to actual animals.
B) Count the number of pine trees in several randomly selected 10-meter-square plots within a population, and extrapolate this number to the fraction of the study area these plots represent.
C) Use the mark-recapture method to estimate the number of individuals in the population.
D) Calculate the difference between all of the immigrants and emigrants to see if the population is growing or shrinking.
Unlock Deck
Unlock for access to all 73 flashcards in this deck.
Unlock Deck
k this deck
6
In a field of corn or lettuce on a farm, plants are cultivated with uniform spacing that will maximize plant growth. In natural habitats however, a uniform pattern of dispersion is much less common. While exceptions do exist, for example in populations of creosote bush in the desert, which of the following best explains why natural populations of plants usually exhibit clumped or random dispersion patterns?
A) Patterns of higher soil moisture, the concentration of soil nutrients, and the distribution of seeds from parent plants may be highly variable.
B) Precipitation across landscapes, especially mountain ranges, is uniform.
C) The competitive interactions between individuals of the same population usually lead to such dispersion patterns.
D) Since nearly all plants are wind-pollinated, the direction of breezes can affect whether plants will produce seeds.
Unlock Deck
Unlock for access to all 73 flashcards in this deck.
Unlock Deck
k this deck
7
Long-term studies of Belding's ground squirrels show that individuals are known to emigrate up to 2 kilometers from where they are born. Over time, immigrants comprise up to 8% of individuals in the new population. Which of the following answers describes an evolutionary benefit from immigration among populations?
A) These immigrants coming into the new populations make up for the deaths of individuals, keeping the populations' size stable.
B) These immigrants provide a source of genetic diversity for the receiving populations.
C) Those individuals that emigrate to these new populations are looking for less crowded conditions with more resources.
D) Gradually, the populations of ground squirrels will move from a clumped to a uniform population pattern of dispersion.
Unlock Deck
Unlock for access to all 73 flashcards in this deck.
Unlock Deck
k this deck
8
An ecologist recorded 12 white-tailed deer, Odocoileus virginianus, per square kilometer (km2) in one woodlot and 20/km2 in another woodlot. These data could be best used to answer which of the following questions?
A) How does the density of deer vary among similar habitats?
B) When deer disperse within their habitat, are they physically clumped or uniform?
C) Is the carrying capacity of the two woodlots controlled by availability of food, or of water?
D) What is the range of a white-tailed deer?
A) How does the density of deer vary among similar habitats?
B) When deer disperse within their habitat, are they physically clumped or uniform?
C) Is the carrying capacity of the two woodlots controlled by availability of food, or of water?
D) What is the range of a white-tailed deer?
Unlock Deck
Unlock for access to all 73 flashcards in this deck.
Unlock Deck
k this deck
9
Use the graph to answer the following question. Which survivorship curve most closely models a population of mice in which females consistently give birth to a large number of offspring, and the mortality rate of the offspring is fairly regular during each year of their lives, regardless of their age?
A) curve A
B) curve B
C) curve C
D) curves A or C
Which survivorship curve most closely models a population of mice in which females consistently give birth to a large number of offspring, and the mortality rate of the offspring is fairly regular during each year of their lives, regardless of their age?A) curve A
B) curve B
C) curve C
D) curves A or C
Unlock Deck
Unlock for access to all 73 flashcards in this deck.
Unlock Deck
k this deck
10
Use the table to answer the following question.
Life Table for Zootoca vivipara in the Netherlands
Data are from Strijbosch and Creemers, 1988.
The data in the table are most consistent with which of the following claims about the population of the Eurasian lizard, Zootoca vivipara?
A) the population is increasing
B) the population is decreasing
C) the population is stable
D) the population is decreasing, then increasing
Unlock Deck
Unlock for access to all 73 flashcards in this deck.
Unlock Deck
k this deck
11
Which of the following is a critical assumption in order for the mark-recapture method to be useful in generating an estimate the size of wildlife populations?
A) More individuals emigrate from, as opposed to immigrate into, a population.
B) Over 50% of the marked individuals were trapped during the recapture phase.
C) There is a 50:50 ratio of males to females in the population before and after trapping and recapture.
D) Marked individuals have the same probability of being recaptured as unmarked individuals during the recapture phase.
Unlock Deck
Unlock for access to all 73 flashcards in this deck.
Unlock Deck
k this deck
12
Use the hypothetical or idealized survivorship curves in the figure to answer the following question. Which of the following curves describes survivorship that is most typical in marine fish or mollusks?
A) A
B) B
C) C
D) E
Which of the following curves describes survivorship that is most typical in marine fish or mollusks?A) A
B) B
C) C
D) E
Unlock Deck
Unlock for access to all 73 flashcards in this deck.
Unlock Deck
k this deck
13
Which of the following species is most likely to exhibit uniform dispersion?
A) red squirrels, who actively defend territories
B) cattails, which grow primarily at edges of lakes and streams
C) dwarf mistletoes, which parasitize particular species of forest tree
D) lake trout, which seek out cold, deep water high in dissolved oxygen
A) red squirrels, who actively defend territories
B) cattails, which grow primarily at edges of lakes and streams
C) dwarf mistletoes, which parasitize particular species of forest tree
D) lake trout, which seek out cold, deep water high in dissolved oxygen
Unlock Deck
Unlock for access to all 73 flashcards in this deck.
Unlock Deck
k this deck
14
Use the graph to answer the following question. In the figure, which of the following survivorship curves is most consistent with humans who are living in developed countries where most of the population has consistent access to resources such as food, water, shelter and health care?
A) curve A
B) curve B
C) curve C
D) curve D
In the figure, which of the following survivorship curves is most consistent with humans who are living in developed countries where most of the population has consistent access to resources such as food, water, shelter and health care?A) curve A
B) curve B
C) curve C
D) curve D
Unlock Deck
Unlock for access to all 73 flashcards in this deck.
Unlock Deck
k this deck
15
Use the hypothetical or idealized survivorship curves in the figure to answer the following question. Which statement best explains survivorship curve B?
A) It is likely a species that provides little postnatal care, but lots of care for offspring during midlife as indicated by increased survivorship.
B) This curve is likely for a species that produces lots of offspring, only a few of which are expected to survive.
C) It is likely a species where no individuals in the cohort die when they are at 60-70% relative age.
D) Survivorship can only decrease; therefore, this curve could not happen in nature.
Which statement best explains survivorship curve B?A) It is likely a species that provides little postnatal care, but lots of care for offspring during midlife as indicated by increased survivorship.
B) This curve is likely for a species that produces lots of offspring, only a few of which are expected to survive.
C) It is likely a species where no individuals in the cohort die when they are at 60-70% relative age.
D) Survivorship can only decrease; therefore, this curve could not happen in nature.
Unlock Deck
Unlock for access to all 73 flashcards in this deck.
Unlock Deck
k this deck
16
Use the table to answer the following question.
In the accompanying life table of a hypothetical population, what are the missing values for lx (y and z)? lx = the proportion alive at the start of year (age specific survivorship rate).
A) y = 0.3, z = 0.1
B) y = 1.0, z = 0.5
C) y = 0.5, z = 0.1
D) y = 1.0, z = 0.2
In the accompanying life table of a hypothetical population, what are the missing values for lx (y and z)? lx = the proportion alive at the start of year (age specific survivorship rate).
A) y = 0.3, z = 0.1
B) y = 1.0, z = 0.5
C) y = 0.5, z = 0.1
D) y = 1.0, z = 0.2
Unlock Deck
Unlock for access to all 73 flashcards in this deck.
Unlock Deck
k this deck
17
Researchers marked 800 turtles in a population, and six months later they were able to trap a total of 300 more individuals, of which 150 were marked. Which of the following is the best estimate of the total population size?
A) 200
B) 1,050
C) 1,600
D) 2,100
A) 200
B) 1,050
C) 1,600
D) 2,100
Unlock Deck
Unlock for access to all 73 flashcards in this deck.
Unlock Deck
k this deck
18
Use the table to answer the following question.
Life Table for Zootoca vivipara in the Netherlands
Data are from Strijbosch and Creemers, 1988.
Removing which of the following age-groups from the population would result in the largest decrease in population growth of Z. vivipara?
A) age-group 1
B) age-group 2
C) age-group 3
D) age-group 4
Life Table for Zootoca vivipara in the Netherlands
Data are from Strijbosch and Creemers, 1988.
Removing which of the following age-groups from the population would result in the largest decrease in population growth of Z. vivipara?
A) age-group 1
B) age-group 2
C) age-group 3
D) age-group 4
Unlock Deck
Unlock for access to all 73 flashcards in this deck.
Unlock Deck
k this deck
19
Which of the following assumptions is applied when using the mark-recapture method to estimate population size?
A) Marked individuals have a slightly higher probability of being trapped.
B) The marked individuals have thoroughly mixed with the population after being marked.
C) Individuals have entered and/or left the population by immigration or emigration
D) Birth and death have changed the numbers of individuals during the course of the estimate
Unlock Deck
Unlock for access to all 73 flashcards in this deck.
Unlock Deck
k this deck
20
Use the hypothetical or idealized survivorship curves in the figure to answer the following question. Which of the following curves best describes survivorship in a typical elephant population?
A) A
B) B
C) C
D) D
Which of the following curves best describes survivorship in a typical elephant population?A) A
B) B
C) C
D) D
Unlock Deck
Unlock for access to all 73 flashcards in this deck.
Unlock Deck
k this deck
21
Ecologists define carrying capacity (K) as the maximum population size that a particular environment can sustain. Which statement about K is correct?
A) K varies among populations and in time.
B) K varies in space and is constant for any given species.
C) K varies among populations and in space and time.
D) K varies in space and time and is constant for any given species.
A) K varies among populations and in time.
B) K varies in space and is constant for any given species.
C) K varies among populations and in space and time.
D) K varies in space and time and is constant for any given species.
Unlock Deck
Unlock for access to all 73 flashcards in this deck.
Unlock Deck
k this deck
22
Use the graph to answer the following question. In the figure, which of the arrows represents the carrying capacity?
A) arrow A
B) arrow B
C) arrow C
D) the period of time prior up to arrow A
In the figure, which of the arrows represents the carrying capacity?A) arrow A
B) arrow B
C) arrow C
D) the period of time prior up to arrow A
Unlock Deck
Unlock for access to all 73 flashcards in this deck.
Unlock Deck
k this deck
23
Use the graph to answer the following question. In the figure, curves A-D depict per capita rate increases (r). Which of the following best explains the difference between the shapes of these curves?
A) The population growth is logistic as generations continue to form.
B) The growth is exponential for curves A and B, but because population growth for C and D is slower, it is considered logistic.
C) Population growth within each curve gets steeper as time passes because growth depends on both per capita rates of increase and current population size.
D) Curve A has the fastest rate of logistic growth.
In the figure, curves A-D depict per capita rate increases (r). Which of the following best explains the difference between the shapes of these curves?A) The population growth is logistic as generations continue to form.
B) The growth is exponential for curves A and B, but because population growth for C and D is slower, it is considered logistic.
C) Population growth within each curve gets steeper as time passes because growth depends on both per capita rates of increase and current population size.
D) Curve A has the fastest rate of logistic growth.
Unlock Deck
Unlock for access to all 73 flashcards in this deck.
Unlock Deck
k this deck
24
In April 2019, the population in the United States was approximately 328,545,050 people. If the estimated growth rate of the population in 2019 was 0.70%, which of the following is the best estimate of the population in April 2020?
A) 567,760,000 328,775,032
B) 335,677,020
C) 330,844,865
D) 351,543,204
A) 567,760,000 328,775,032
B) 335,677,020
C) 330,844,865
D) 351,543,204
Unlock Deck
Unlock for access to all 73 flashcards in this deck.
Unlock Deck
k this deck
25
A species population's size (N) may vary depending on a number of factors including crowding and resource limitation. As N approaches K (carrying capacity) for a certain population, which of the following outcomes is predicted by the logistic growth model?
A) The population growth rate will not change.
B) The population growth rate will approach zero.
C) The population size will increase exponentially.
D) The carrying capacity of the environment will increase.
A) The population growth rate will not change.
B) The population growth rate will approach zero.
C) The population size will increase exponentially.
D) The carrying capacity of the environment will increase.
Unlock Deck
Unlock for access to all 73 flashcards in this deck.
Unlock Deck
k this deck
26
A population of ground squirrels has an annual per capita birth rate of 0.06 and an annual per capita death rate of 0.02. Using these birth and death rates, calculate the total number of individuals added to (or lost from) a population of 1,000 individuals in one year.
A) 120 individuals added
B) 40 individuals added
C) 20 individuals added
D) 400 individuals added
A) 120 individuals added
B) 40 individuals added
C) 20 individuals added
D) 400 individuals added
Unlock Deck
Unlock for access to all 73 flashcards in this deck.
Unlock Deck
k this deck
27
Which of the following causes populations to shift most quickly from an exponential to a logistic population growth model?
A) favorable climatic conditions
B) removal of predators
C) decreased death rate
D) competition for resources
A) favorable climatic conditions
B) removal of predators
C) decreased death rate
D) competition for resources
Unlock Deck
Unlock for access to all 73 flashcards in this deck.
Unlock Deck
k this deck
28
An undergraduate student is working in a research lab, and starting with a single bacterium, she cultures it in a flask of ideal nutrient broth at an optimum temperature over a two-hour period? Assume resources do not become limiting over this time frame.
A)
B)
C)
D)
A)
B)
C)
D)
Unlock Deck
Unlock for access to all 73 flashcards in this deck.
Unlock Deck
k this deck
29
Which of the following graphs best illustrates the growth curve of a small population of rodents that has increased to a static carrying capacity?
A)
B)
C)
D)
A)
B)
C)
D)
Unlock Deck
Unlock for access to all 73 flashcards in this deck.
Unlock Deck
k this deck
30
In 2019, the United States Census Bureau reported the various components of population change as estimated below.
∙ One birth every 8 seconds
∙ One death every 11 seconds
∙ One international migrant (net) every 33 seconds
∙ Net gain of one person every 17 seconds
Use the information to estimate the net population growth for that year.
A) 1,855,058
B) 31,536,007
C) 525,600
D) 3,942,010
∙ One birth every 8 seconds
∙ One death every 11 seconds
∙ One international migrant (net) every 33 seconds
∙ Net gain of one person every 17 seconds
Use the information to estimate the net population growth for that year.
A) 1,855,058
B) 31,536,007
C) 525,600
D) 3,942,010
Unlock Deck
Unlock for access to all 73 flashcards in this deck.
Unlock Deck
k this deck
31
A researcher is studying two old-growth forests on the coast of northern California: One is undisturbed, while the other is being disturbed from logging and harvesting of the wood by a lumber company. In which region are more species likely to experience exponential growth, and why?
A) old-growth forest, because of stable conditions that would favor exponential growth in the forest
B) old-growth forest, because each of the species is well established and can produce many offspring
C) logged forest, because the disturbed forest affords more resources allowing some species populations to grow rapidly
D) logged forest, because the various populations are stimulated to a higher reproductive potential
Unlock Deck
Unlock for access to all 73 flashcards in this deck.
Unlock Deck
k this deck
32
In 2019, the United States Census Bureau reported the various components of population change as estimated below.
∙ One birth every 8 seconds
∙ One death every 11 seconds
∙ One international migrant (net of immigrants versus emigrants) every 33 seconds
∙ Net gain of one person every 17 seconds
During that year, which component was four times slower than the birth rate?
A) The net immigration rate
B) The net emigration rate
C) The birth rate
D) The death rate
Unlock Deck
Unlock for access to all 73 flashcards in this deck.
Unlock Deck
k this deck
33
In 2019, the United States Census Bureau reported the various components of population change as estimated below.
∙ One birth every 8 seconds
∙ One death every 11 seconds
∙ One international migrant (net of immigrants versus emigrants) every 33 seconds
∙ Net gain of one person every 17 seconds
During that year, which of the components was having the second largest effect on population growth?
A) The immigration rate
B) The emigration rate
C) The birth rate
D) The death rate
Unlock Deck
Unlock for access to all 73 flashcards in this deck.
Unlock Deck
k this deck
34
Starting from a single individual, which estimate best predicts the size of a population of bacteria at the end of a 2-hour time period if they reproduce by binary fission every 20 minutes? (Assume unlimited resources and no mortality.)
A) 16
B) 32
C) 64
D) 128
A) 16
B) 32
C) 64
D) 128
Unlock Deck
Unlock for access to all 73 flashcards in this deck.
Unlock Deck
k this deck
35
Which of the following is accurate about a population exhibiting exponential growth?
A) It grows at its maximum per capita rate.
B) It quickly reaches its carrying capacity.
C) It adds more new individuals when the population is small than when it is large.
D) It loses some individuals to emigration.
A) It grows at its maximum per capita rate.
B) It quickly reaches its carrying capacity.
C) It adds more new individuals when the population is small than when it is large.
D) It loses some individuals to emigration.
Unlock Deck
Unlock for access to all 73 flashcards in this deck.
Unlock Deck
k this deck
36
In 2019, the United States Census Bureau reported the various components of population change as estimated below.
∙ One birth every 8 seconds
∙ One death every 11 seconds
∙ One international migrant (net) every 33 seconds
∙ Net gain of one person every 17 seconds
In order to estimate the population growth rate (%) for that year, what other information would be required?
A) The emigration rate
B) The estimated number of people living in the United States in 2019
C) The estimated number of males versus females
D) The estimated number of females of reproductive age
Unlock Deck
Unlock for access to all 73 flashcards in this deck.
Unlock Deck
k this deck
37
An undergraduate student research assistant is attempting to help estimate the population size of a prairie dog colony, and completes several counts using mark-recapture methods. Which factors, other than reproductive rate and survivorship, would be necessary to consider when using the data to construct a life table and estimate the population size and future over time?
A) immigration or emigration of individuals to and from the population
B) reproductive rate and survivorship data are sufficient, nothing else is necessary
C) population size of a nearby colony
D) whether the burrows are clumped, uniform, or randomly distributed across the landscape
A) immigration or emigration of individuals to and from the population
B) reproductive rate and survivorship data are sufficient, nothing else is necessary
C) population size of a nearby colony
D) whether the burrows are clumped, uniform, or randomly distributed across the landscape
Unlock Deck
Unlock for access to all 73 flashcards in this deck.
Unlock Deck
k this deck
38
In 2019, the population of New Zealand was approximately 4,794,000 people. If the birth rate was approximately 13 births per 1,000 people, approximately how many births occurred in 2019?
A) 6,711
B) 14,000
C) 62,322
D) 623,000
A) 6,711
B) 14,000
C) 62,322
D) 623,000
Unlock Deck
Unlock for access to all 73 flashcards in this deck.
Unlock Deck
k this deck
39
In the process of researching how to manage a large game ranch, historical accounts indicated that a species of deer that once lived there had been extirpated. After doing some research to determine what might be an appropriately sized founding population, managers reintroduced deer to the ranch. The population then increased for several generations, and the managers graphed the number of individuals (vertical axis) against time, or the number of generations (horizontal axis). If no natural predators are impacting the population, which of the following graphs best represents the population?
A)
B)
C)
D)
A)
B)
C)
D)
Unlock Deck
Unlock for access to all 73 flashcards in this deck.
Unlock Deck
k this deck
40
In 2019, the United States Census Bureau reported the various components of population change as estimated below.
∙ One birth every 8 seconds
∙ One death every 11 seconds
∙ One international migrant (net of immigrants versus emigrants) every 33 seconds
∙ Net gain of one person every 17 seconds
Use the information to estimate the net population growth for that year.
A) 1,855,058
B) 31,536,007
C) 525,600
D) 3,942,010
Unlock Deck
Unlock for access to all 73 flashcards in this deck.
Unlock Deck
k this deck
41
Which example best illustrates a semelparous, K-selected species?
A) a plant that reproduces one time at the end of its life in a habitat with extensive competition for water
B) a plant that reproduces one time at the end of its life in a habitat where it does not experience competition with other plants for soil nutrient
C) a stable population of wolves in Yellowstone National Park
D) a red-winged black bird that typically raises three clutches of eggs per season in a wetland habitat with competition for nesting sites
Unlock Deck
Unlock for access to all 73 flashcards in this deck.
Unlock Deck
k this deck
42
Which of the following traits is characteristic of K-selected populations?
A) offspring with good chances of survival
B) many offspring per reproductive episode
C) small offspring
D) a high intrinsic rate of increase
A) offspring with good chances of survival
B) many offspring per reproductive episode
C) small offspring
D) a high intrinsic rate of increase
Unlock Deck
Unlock for access to all 73 flashcards in this deck.
Unlock Deck
k this deck
43
Use the figure to answer the following question. Which of the following topics is represented by the figures showing the fate of individuals in distinct habitat patches over time?
A) metapopulations
B) extinction
C) emigration
D) both extinction and emigration
Which of the following topics is represented by the figures showing the fate of individuals in distinct habitat patches over time?A) metapopulations
B) extinction
C) emigration
D) both extinction and emigration
Unlock Deck
Unlock for access to all 73 flashcards in this deck.
Unlock Deck
k this deck
44
A population of white-footed mice becomes severely overpopulated in a habitat that has been disturbed by human activity. Sometimes intrinsic factors cause the population to increase in mortality and cause lower reproduction rates to occur in reaction to the stress of overpopulation. Which of the following is an example of intrinsic population control?
A) Owl populations frequent the area more often because of increased hunting success.
B) Females undergo hormonal changes that delay sexual maturation, and many individuals suffer depressed immune systems and die due to the stress of overpopulation.
C) Clumped dispersion of the population leads to increased spread of disease and parasites, resulting in a population crash.
D) All of the resources (food and shelter) are used up by overpopulation, and much of the population dies of exposure and/or starvation.
Unlock Deck
Unlock for access to all 73 flashcards in this deck.
Unlock Deck
k this deck
45
Use the graph to answer the following question. Which hypothesis is most consistent with these data on hare and lynx populations in the graph?
A) Hares decrease in number just before lynx population size begins to increase.
B) Lynx likely control hare population density.
C) Lynx and hare populations are independent of each other.
D) The relationship between the populations cannot be determined only from this graph.
Which hypothesis is most consistent with these data on hare and lynx populations in the graph?A) Hares decrease in number just before lynx population size begins to increase.
B) Lynx likely control hare population density.
C) Lynx and hare populations are independent of each other.
D) The relationship between the populations cannot be determined only from this graph.
Unlock Deck
Unlock for access to all 73 flashcards in this deck.
Unlock Deck
k this deck
46
Two breeding female fish of the same species successfully reproduce, and one female lays 100 eggs, while the other female lays 1,000 eggs. Which one of the following outcomes is most likely, given the limits of fitness trade-offs?
A) The female laying 1,000 eggs breeds more often than the female laying 100 eggs.
B) The female laying 100 eggs lives longer than the female laying 1,000 eggs.
C) The eggs from the female laying 1,000 eggs have larger yolks than the yolks of the eggs from the female laying 100 eggs.
D) The female laying 100 eggs is larger than the female laying 1,000 eggs.
Unlock Deck
Unlock for access to all 73 flashcards in this deck.
Unlock Deck
k this deck
47
Which of the following graphs illustrates the growth over several seasons of a population of snowshoe hares that were introduced to an appropriate habitat also inhabited by predators in northern Canada?
A)
B)
C)
D)
A)
B)
C)
D)
Unlock Deck
Unlock for access to all 73 flashcards in this deck.
Unlock Deck
k this deck
48
Use the graphs to answer the following question. Graph (b) in the figure shows the normal fluctuations of a population of grouse, a ground-nesting bird. Assuming graph (a) in the figure is the result of some experimental treatment in the grouse population, what can be concluded?
A) The experimental treatment intensified the population cycling.
B) The experimental treatment did not affect population cycling in this species.
C) The experimental treatment has most likely identified the cause of population cycling.
D) The experimental treatment involved the introduction of a predator of the bird.
Graph (b) in the figure shows the normal fluctuations of a population of grouse, a ground-nesting bird. Assuming graph (a) in the figure is the result of some experimental treatment in the grouse population, what can be concluded?A) The experimental treatment intensified the population cycling.
B) The experimental treatment did not affect population cycling in this species.
C) The experimental treatment has most likely identified the cause of population cycling.
D) The experimental treatment involved the introduction of a predator of the bird.
Unlock Deck
Unlock for access to all 73 flashcards in this deck.
Unlock Deck
k this deck
49
Often the growth cycle of one population has an effect on the cycle of another. As moose populations increase, for example, wolf populations also increase. Thus, if we are considering the logistic equation for the wolf population, = rN
Which of the factors accounts for the effect of the moose population?
A) r
B) N
C) rN
D) K
= rN Which of the factors accounts for the effect of the moose population?
A) r
B) N
C) rN
D) K
Unlock Deck
Unlock for access to all 73 flashcards in this deck.
Unlock Deck
k this deck
50
Use the figure to answer the following question. Infant mortality and life expectancy at birth in developed and
Developing countries (data as of 2005).
What is a logical conclusion that can be drawn from the graphs about developed countries?
A) lower infant mortality rates and lower life expectancy than developing countries
B) higher infant mortality rates and lower life expectancy than developing countries
C) lower infant mortality rates and higher life expectancy than developing countries
D) higher infant mortality rates and higher life expectancy than developing countries
Infant mortality and life expectancy at birth in developed andDeveloping countries (data as of 2005).
What is a logical conclusion that can be drawn from the graphs about developed countries?
A) lower infant mortality rates and lower life expectancy than developing countries
B) higher infant mortality rates and lower life expectancy than developing countries
C) lower infant mortality rates and higher life expectancy than developing countries
D) higher infant mortality rates and higher life expectancy than developing countries
Unlock Deck
Unlock for access to all 73 flashcards in this deck.
Unlock Deck
k this deck
51
Use the figures to answer the following question. Based on the age-structure diagrams in the figure and on the large population of baby boomers (a demographic cohort born at a reproductive peak after World War II between 1946-1964 in the United States), which graph best reflects U.S. population in 20 years?
A) A
B) B
C) C
D) D
Based on the age-structure diagrams in the figure and on the large population of baby boomers (a demographic cohort born at a reproductive peak after World War II between 1946-1964 in the United States), which graph best reflects U.S. population in 20 years?A) A
B) B
C) C
D) D
Unlock Deck
Unlock for access to all 73 flashcards in this deck.
Unlock Deck
k this deck
52
Use the figure to answer the following question. In the figure, one could depict a different scenario where the death rate per capita was dependent upon (and positively correlated with) the density of the population, and the birth rate was instead density independent. Which of the following would occur as the density of the population increased?
A) the death rate would decrease and the birth rate would decrease
B) the death rate would increase and the birth rate would decrease
C) the death rate would increase and the birth rate would remain stable
D) the death rate would remain stable and the birth rate would increase
In the figure, one could depict a different scenario where the death rate per capita was dependent upon (and positively correlated with) the density of the population, and the birth rate was instead density independent. Which of the following would occur as the density of the population increased?A) the death rate would decrease and the birth rate would decrease
B) the death rate would increase and the birth rate would decrease
C) the death rate would increase and the birth rate would remain stable
D) the death rate would remain stable and the birth rate would increase
Unlock Deck
Unlock for access to all 73 flashcards in this deck.
Unlock Deck
k this deck
53
Which of the following is most consistent with the logistic growth equation, = rN
?
A) the number of individuals added per unit time is greatest when N is close to zero
B) the per capita growth rate (r) increases as N approaches K
C) population growth is zero when N equals K
D) the population grows exponentially when K is small
= rN ?
A) the number of individuals added per unit time is greatest when N is close to zero
B) the per capita growth rate (r) increases as N approaches K
C) population growth is zero when N equals K
D) the population grows exponentially when K is small
Unlock Deck
Unlock for access to all 73 flashcards in this deck.
Unlock Deck
k this deck
54
Use the graph to answer the following question. Based on the data graphed here, which size clutch would likely result in the highest estimated overall reproductive success (fecundity) after one year?
A) 2
B) 3
C) 4
D) 6
Based on the data graphed here, which size clutch would likely result in the highest estimated overall reproductive success (fecundity) after one year?A) 2
B) 3
C) 4
D) 6
Unlock Deck
Unlock for access to all 73 flashcards in this deck.
Unlock Deck
k this deck
55
Use the graph to answer the following question. Which of the following claims can be best supported using the data?
A) Clutch size is always lowest at a density of about 35 females.
B) As female density increases, survivorship decreases.
C) Clutch size increases as female density increases.
D) Clutch size is inversely related to density.
Which of the following claims can be best supported using the data?A) Clutch size is always lowest at a density of about 35 females.
B) As female density increases, survivorship decreases.
C) Clutch size increases as female density increases.
D) Clutch size is inversely related to density.
Unlock Deck
Unlock for access to all 73 flashcards in this deck.
Unlock Deck
k this deck
56
Use the graph to answer the following question. Which of the following hypotheses is most consistent with the data with respect to survival and clutch size?
A) Animals with low survival tend to have smaller clutch sizes.
B) Large clutch size correlates with low survival.
C) Animals with high survival tend to have medium-sized clutches.
D) A large clutch size will result in the highest population growth rate.
Which of the following hypotheses is most consistent with the data with respect to survival and clutch size?A) Animals with low survival tend to have smaller clutch sizes.
B) Large clutch size correlates with low survival.
C) Animals with high survival tend to have medium-sized clutches.
D) A large clutch size will result in the highest population growth rate.
Unlock Deck
Unlock for access to all 73 flashcards in this deck.
Unlock Deck
k this deck
57
Use the figure to answer the following question. Which conclusion below is best supported by the data?
A) Food is the only factor in controlling hare population size.
B) Exclusion of lynx is the most important factor in controlling hare population size.
C) The effect of excluding predators and adding food in the same experiment is greater than the sum of excluding lynx alone plus adding food when considered individually.
D) Adding abundant food has a smaller effect on hare success than removing all of their predators.
Which conclusion below is best supported by the data?A) Food is the only factor in controlling hare population size.
B) Exclusion of lynx is the most important factor in controlling hare population size.
C) The effect of excluding predators and adding food in the same experiment is greater than the sum of excluding lynx alone plus adding food when considered individually.
D) Adding abundant food has a smaller effect on hare success than removing all of their predators.
Unlock Deck
Unlock for access to all 73 flashcards in this deck.
Unlock Deck
k this deck
58
Which of the following is an energetic trade-off in natural selection?
A) choosing how many offspring to produce over the course of a lifetime and how long to live
B) producing large numbers of gametes when employing internal fertilization versus fewer numbers of gametes when employing external fertilization
C) increasing the number of individuals produced during each reproductive episode and a corresponding decrease in parental care
D) high survival rates of offspring and the cost of parental care
Unlock Deck
Unlock for access to all 73 flashcards in this deck.
Unlock Deck
k this deck
59
In which of the following situations would you expect to find the largest number of r-selected individuals?
A) a recently abandoned agricultural field in Colorado
B) a sand dune community south of Lake Michigan
C) an old-growth forest with large, mature trees
D) a coral reef community off the coast of Mexico
A) a recently abandoned agricultural field in Colorado
B) a sand dune community south of Lake Michigan
C) an old-growth forest with large, mature trees
D) a coral reef community off the coast of Mexico
Unlock Deck
Unlock for access to all 73 flashcards in this deck.
Unlock Deck
k this deck
60
Which of the following statements regarding the future of populations in developing, less industrialized countries are correct?
A) The reproductive rates are predicted to remain below replacement level. and the overall population size will increase dramatically.
B) Survivorship will increase and the fertility rate is predicted to remain high, especially in some regions.
C) Survivorship will increase, overall population size will increase dramatically, and the fertility rate is predicted to remain high, especially in some regions.
Unlock Deck
Unlock for access to all 73 flashcards in this deck.
Unlock Deck
k this deck
61
According to the logistic growth equation below, ________. = rN
A) the number of individuals added per unit time is greatest when N is close to zero
B) the per capita population growth rate increases as N approaches K
C) population growth is zero when N equals K
D) the population grows exponentially when K is small
= rN A) the number of individuals added per unit time is greatest when N is close to zero
B) the per capita population growth rate increases as N approaches K
C) population growth is zero when N equals K
D) the population grows exponentially when K is small
Unlock Deck
Unlock for access to all 73 flashcards in this deck.
Unlock Deck
k this deck
62
A population's carrying capacity ________.
A) may change as environmental conditions change
B) can be accurately calculated using the logistic growth model
C) increases as the per capita population growth rate decreases
D) can never be exceeded
A) may change as environmental conditions change
B) can be accurately calculated using the logistic growth model
C) increases as the per capita population growth rate decreases
D) can never be exceeded
Unlock Deck
Unlock for access to all 73 flashcards in this deck.
Unlock Deck
k this deck
63
Which of the following statements about human populations in industrialized countries is correct?
A) Life history is r-selected.
B) The population has undergone demographic transition and age distribution is relatively uniform.
C) Life history is r-selected, the population has undergone the demographic transition, and age distribution is relatively uniform.
D) The survivorship curve is a Type III.
Unlock Deck
Unlock for access to all 73 flashcards in this deck.
Unlock Deck
k this deck
64
The following question refers to the figure below, which depicts the age structure of populations. In the figure, populations of a plant species labeled I, II, and III are depicted using simplified age structures containing three age classes: young seedlings, middle-aged juveniles, and older adults. Which populations appear to have stable growth?
A) I
B) III
C) II
D) None of the above
In the figure, populations of a plant species labeled I, II, and III are depicted using simplified age structures containing three age classes: young seedlings, middle-aged juveniles, and older adults. Which populations appear to have stable growth?A) I
B) III
C) II
D) None of the above
Unlock Deck
Unlock for access to all 73 flashcards in this deck.
Unlock Deck
k this deck
65
During exponential growth, a population always ________.
A) has a constant per capita population growth rate
B) quickly reaches its carrying capacity
C) cycles through time
D) loses some individuals to emigration
A) has a constant per capita population growth rate
B) quickly reaches its carrying capacity
C) cycles through time
D) loses some individuals to emigration
Unlock Deck
Unlock for access to all 73 flashcards in this deck.
Unlock Deck
k this deck
66
The observation that members of a population are uniformly distributed suggests that ________.
A) resources are distributed unevenly.
B) the members of the population are competing for access to a resource.
C) the members of the population are neither attracted to nor repelled by one another.
D) the density of the population is low.
A) resources are distributed unevenly.
B) the members of the population are competing for access to a resource.
C) the members of the population are neither attracted to nor repelled by one another.
D) the density of the population is low.
Unlock Deck
Unlock for access to all 73 flashcards in this deck.
Unlock Deck
k this deck
67
Which of the following statements about human populations in industrialized countries is correct?
A) Birth rates and death rates are high.
B) Average family size is relatively large.
C) The population has undergone the demographic transition.
D) The survivorship curve is Type II.
A) Birth rates and death rates are high.
B) Average family size is relatively large.
C) The population has undergone the demographic transition.
D) The survivorship curve is Type II.
Unlock Deck
Unlock for access to all 73 flashcards in this deck.
Unlock Deck
k this deck
68
Use the figure to answer the following question. Based on the figure and given the populations of the following countries, which country uses the most oil overall?
A) United States (population = 320 million)
B) Canada (population = 36 million)
C) China (population = 1.33 billion)
D) Russia (population = 144 million)
Based on the figure and given the populations of the following countries, which country uses the most oil overall?A) United States (population = 320 million)
B) Canada (population = 36 million)
C) China (population = 1.33 billion)
D) Russia (population = 144 million)
Unlock Deck
Unlock for access to all 73 flashcards in this deck.
Unlock Deck
k this deck
69
Population ecologists follow the fate of same-age cohorts to ________.
A) determine a population's carrying capacity
B) determine the birth rate and death rate of each group in a population
C) determine if a population is regulated by density-dependent processes
D) determine the factors that affect the size of a population
A) determine a population's carrying capacity
B) determine the birth rate and death rate of each group in a population
C) determine if a population is regulated by density-dependent processes
D) determine the factors that affect the size of a population
Unlock Deck
Unlock for access to all 73 flashcards in this deck.
Unlock Deck
k this deck
70
Based on current growth rates, Earth's human population in 2019 will be closest to ________.
A) 2.5 million
B) 4.5 billion
C) 7.8 billion
D) 10.5 billion
A) 2.5 million
B) 4.5 billion
C) 7.8 billion
D) 10.5 billion
Unlock Deck
Unlock for access to all 73 flashcards in this deck.
Unlock Deck
k this deck
71
Scientific study of the population cycles of the snowshoe hare and its predator, the lynx, has revealed that ________.
A) predation is the dominant factor affecting prey population cycling
B) hares and lynx are so mutually dependent that each species cannot survive without the other
C) both hare and lynx population sizes are affected mainly by abiotic factors
D) the hare population is r-selected and the lynx population is K-selected
Unlock Deck
Unlock for access to all 73 flashcards in this deck.
Unlock Deck
k this deck
72
Analyzing ecological footprints reveals that ________.
A) Earth's carrying capacity would increase if per capita meat consumption increased
B) current demand by industrialized countries for resources is much smaller than the ecological footprint of those countries
C) it is not possible for technological improvements to increase Earth's carrying capacity for humans
D) the ecological footprint of the United States is large because per capita resource use is high
Unlock Deck
Unlock for access to all 73 flashcards in this deck.
Unlock Deck
k this deck
73
Which of the following is consistent with a recent study of ecological footprints?
A) Earth's carrying capacity would increase if per capita meat consumption increased
B) current demand by industrialized countries for resources is much smaller than the ecological footprint of those countries
C) it is not possible for technological improvements to increase Earth's carrying capacity for humans
D) the ecological footprint of the United States is large because per capita resource use is high
Unlock Deck
Unlock for access to all 73 flashcards in this deck.
Unlock Deck
k this deck
Unlock Deck
Unlock for access to all 73 flashcards in this deck.


