Exam 53: Populations and Life History Traits
Exam 1: Biology and Its Themes46 Questions
Exam 2: Atoms and Molecules61 Questions
Exam 3: The Chemistry of Water55 Questions
Exam 4: Carbon: the Basis of Molecular Diversity52 Questions
Exam 5: Biological Macromolecules and Lipids71 Questions
Exam 6: Energy and Life65 Questions
Exam 7: Cell Structure and Function66 Questions
Exam 8: Cell Membranes67 Questions
Exam 9: Cellular Signaling62 Questions
Exam 10: Cell Respiration68 Questions
Exam 11: Photosynthetic Processes64 Questions
Exam 12: Mitosis63 Questions
Exam 13: Sexual Life Cycles and Meiosis64 Questions
Exam 14: Mendelian Genetics65 Questions
Exam 15: Linkage and Chromosomes54 Questions
Exam 16: Nucleic Acids and Inheritance65 Questions
Exam 17: Expression of Genes70 Questions
Exam 18: Control of Gene Expression66 Questions
Exam 19: Dna Technology56 Questions
Exam 20: The Evolution of Genomes47 Questions
Exam 21: How Evolution Works60 Questions
Exam 22: Phylogenetic Reconstruction66 Questions
Exam 23: Microevolution65 Questions
Exam 24: Species and Speciation65 Questions
Exam 25: Macroevolution58 Questions
Exam 26: Introduction to Viruses54 Questions
Exam 27: Prokaryotes61 Questions
Exam 28: The Origin and Evolution of Eukaryotes66 Questions
Exam 29: Nonvascular and Seedless Vascular Plants72 Questions
Exam 30: Seed Plants64 Questions
Exam 31: Introduction to Fungi56 Questions
Exam 32: An Introduction to Animal Diversity58 Questions
Exam 33: Invertebrates58 Questions
Exam 34: Vertebrates66 Questions
Exam 35: Plant Structure and Growth68 Questions
Exam 36: Transport in Vascular Plants73 Questions
Exam 37: Plant Nutrition51 Questions
Exam 38: Reproduction of Flowering Plants59 Questions
Exam 39: Plant Signals and Behavior60 Questions
Exam 40: The Animal Body58 Questions
Exam 41: Chemical Signals in Animals62 Questions
Exam 42: Animal Digestive Systems58 Questions
Exam 43: Animal Transport Systems58 Questions
Exam 44: Animal Excretory Systems49 Questions
Exam 45: Animal Reproductive Systems64 Questions
Exam 46: Development in Animals68 Questions
Exam 47: Animal Defenses Against Infection65 Questions
Exam 48: Electrical Signals in Animals62 Questions
Exam 49: Neural Regulation in Animals69 Questions
Exam 50: Sensation and Movement in Animals68 Questions
Exam 51: An Overview of Ecology71 Questions
Exam 52: Behavioral Ecology64 Questions
Exam 53: Populations and Life History Traits73 Questions
Exam 54: Biodiversity and Communities71 Questions
Exam 55: Energy Flow and Chemical Cycling in Ecosystems80 Questions
Exam 56: Conservation and Global Ecology75 Questions
Select questions type
Use the hypothetical or idealized survivorship curves in the figure to answer the following question. 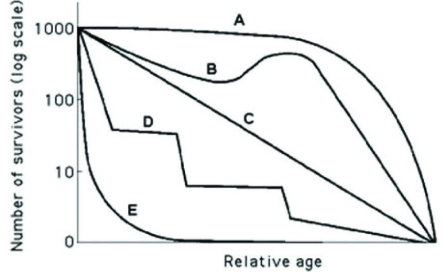 Which of the following curves describes survivorship that is most typical in marine fish or mollusks?
Free
(Multiple Choice)
5.0/5  (23)
(23)
Correct Answer: Verified
D
In a field of corn or lettuce on a farm, plants are cultivated with uniform spacing that will maximize plant growth. In natural habitats however, a uniform pattern of dispersion is much less common. While exceptions do exist, for example in populations of creosote bush in the desert, which of the following best explains why natural populations of plants usually exhibit clumped or random dispersion patterns?
Free
(Multiple Choice)
4.9/5 (33)
Correct Answer:Verified
A
Which of the following statements regarding the future of populations in developing, less industrialized countries are correct?
Free
(Multiple Choice)
4.8/5 (24)
Correct Answer:Verified
C
Use the graph to answer the following question. 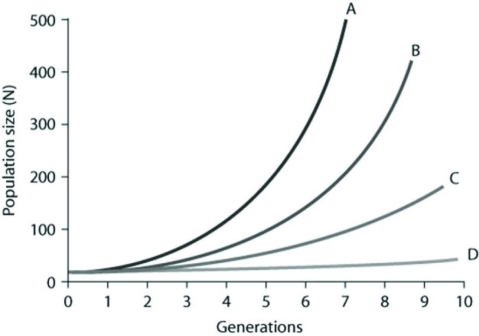 In the figure, curves A-D depict per capita rate increases (r). Which of the following best explains the difference between the shapes of these curves?
(Multiple Choice)
4.7/5 (36)
Use the graph to answer the following question. 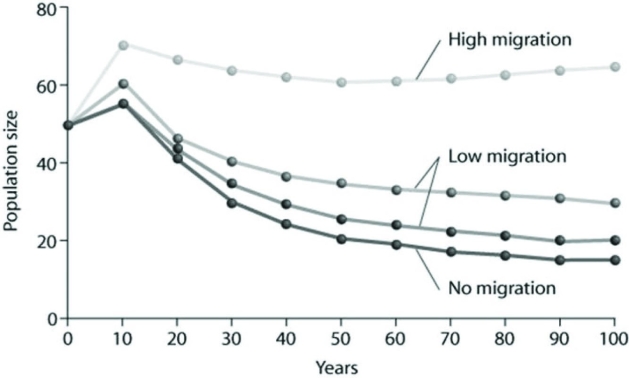 Based on the data provided, what factor of those listed below appears to be the most important in stabilizing the population from its initial size over the subsequent 100 years?
(Multiple Choice)
4.7/5 (33)
Which of the following is most consistent with the logistic growth equation,  = rN
= rN  ?
?
(Multiple Choice)
4.8/5 (41)
In April 2019, the population in the United States was approximately 328,545,050 people. If the estimated growth rate of the population in 2019 was 0.70%, which of the following is the best estimate of the population in April 2020?
(Multiple Choice)
4.8/5 (34)
Which of the following is consistent with a recent study of ecological footprints?
(Multiple Choice)
4.8/5 (33)
In 2019, the United States Census Bureau reported the various components of population change as estimated below.
∙ One birth every 8 seconds
∙ One death every 11 seconds
∙ One international migrant (net of immigrants versus emigrants) every 33 seconds
∙ Net gain of one person every 17 seconds
During that year, which of the components was having the second largest effect on population growth?
(Multiple Choice)
4.7/5 (41)
Use the graphs to answer the following question. 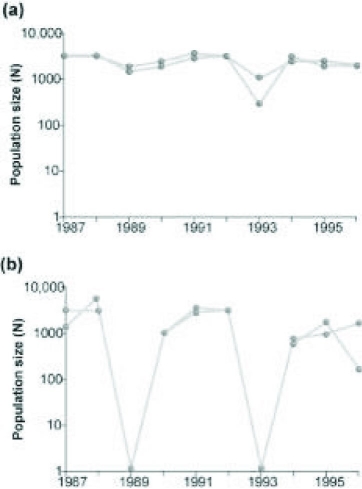 Graph (b) in the figure shows the normal fluctuations of a population of grouse, a ground-nesting bird. Assuming graph (a) in the figure is the result of some experimental treatment in the grouse population, what can be concluded?
(Multiple Choice)
4.9/5 (29)
Which of the following statements about human populations in industrialized countries is correct?
(Multiple Choice)
4.8/5 (37)
Which of the following causes populations to shift most quickly from an exponential to a logistic population growth model?
(Multiple Choice)
4.8/5 (34)
A researcher is studying two old-growth forests on the coast of northern California: One is undisturbed, while the other is being disturbed from logging and harvesting of the wood by a lumber company. In which region are more species likely to experience exponential growth, and why?
(Multiple Choice)
4.8/5 (36)
A population of white-footed mice becomes severely overpopulated in a habitat that has been disturbed by human activity. Sometimes intrinsic factors cause the population to increase in mortality and cause lower reproduction rates to occur in reaction to the stress of overpopulation. Which of the following is an example of intrinsic population control?
(Multiple Choice)
4.9/5 (36)
Use the figure to answer the following question. 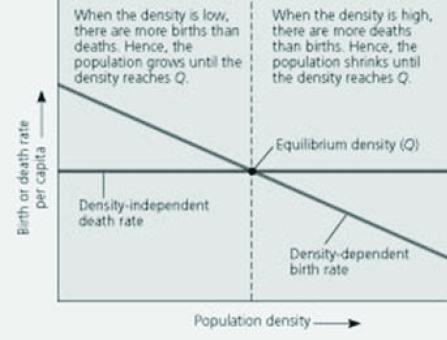 In the figure, one could depict a different scenario where the death rate per capita was dependent upon (and positively correlated with) the density of the population, and the birth rate was instead density independent. Which of the following would occur as the density of the population increased?
(Multiple Choice)
4.8/5 (32)
Use the hypothetical or idealized survivorship curves in the figure to answer the following question.  Which statement best explains survivorship curve B?
(Multiple Choice)
4.8/5 (30)
An undergraduate student research assistant is attempting to help estimate the population size of a prairie dog colony, and completes several counts using mark-recapture methods. Which factors, other than reproductive rate and survivorship, would be necessary to consider when using the data to construct a life table and estimate the population size and future over time?
(Multiple Choice)
4.9/5 (35)
Use the figures to answer the following question. 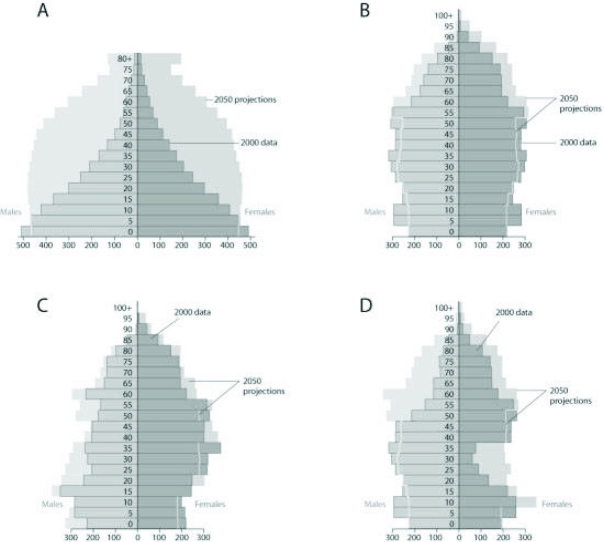 Based on the age-structure diagrams in the figure and on the large population of baby boomers (a demographic cohort born at a reproductive peak after World War II between 1946-1964 in the United States), which graph best reflects U.S. population in 20 years?
(Multiple Choice)
4.8/5 (36)
Use the graph to answer the following question. 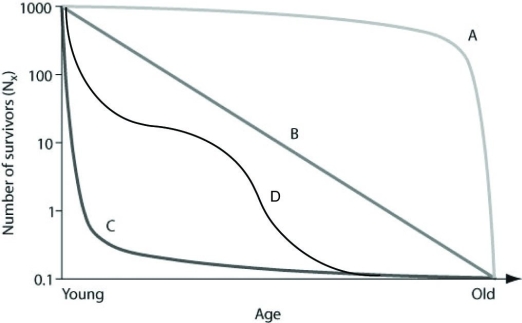 In the figure, which of the following survivorship curves is most consistent with humans who are living in developed countries where most of the population has consistent access to resources such as food, water, shelter and health care?
(Multiple Choice)
4.8/5 (33)
Which of the following is an energetic trade-off in natural selection?
(Multiple Choice)
4.9/5 (38)
Filters
- Essay(0)
- Multiple Choice(0)
- Short Answer(0)
- True False(0)
- Matching(0)