Deck 10: The Tools of Quality
Full screen (f)
Question
Question
Question
Question
Question
Question
Question
Question
Question
Question
Question
Question
Question
Question
Question
Question
Question
Question
Question
Question
Question
Question
The RC and More Superstore decides to track customer complaints as part of their ongoing customer satisfaction improvement program. After collecting data for two months, their check sheet appears as follows: 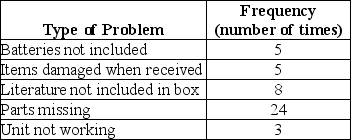 If they construct a Pareto chart, what is the percentage of complaints represented by the problem "Unit not working"?
A)3%
B)6.7%
C)11.1%
D)17.8%
E)23%
If they construct a Pareto chart, what is the percentage of complaints represented by the problem "Unit not working"?A)3%
B)6.7%
C)11.1%
D)17.8%
E)23%
Question
Question
The RC and More Superstore decides to track customer complaints as part of their ongoing customer satisfaction improvement program. After collecting data for two months, their check sheet appears as follows:  If they construct a Pareto chart, what is the percentage of complaints represented by the problem "Literature not included in box"?
A)9%
B)18%
C)36%
D)54%
E)81%
If they construct a Pareto chart, what is the percentage of complaints represented by the problem "Literature not included in box"?A)9%
B)18%
C)36%
D)54%
E)81%
Question
Question
Question
Question
The RC and More Superstore decides to track customer complaints as part of their ongoing customer satisfaction improvement program. After collecting data for two months, their check sheet appears as follows: 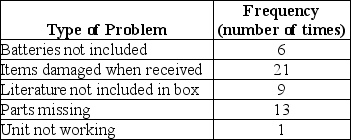 If they construct a Pareto chart, what is the cumulative percentage of the two left most bars?
A)20%
B)28%
C)54%
D)68%
E)80%
If they construct a Pareto chart, what is the cumulative percentage of the two left most bars?A)20%
B)28%
C)54%
D)68%
E)80%
Question
Question
The RC and More Superstore decides to track customer complaints as part of their ongoing customer satisfaction improvement program. After collecting data for two months, their check sheet appears as follows:  If they construct a Pareto chart, what is the cumulative percentage of the two left most bars?
A)12%
B)27%
C)40%
D)60%
E)71%
If they construct a Pareto chart, what is the cumulative percentage of the two left most bars?A)12%
B)27%
C)40%
D)60%
E)71%
Question
The RC and More Superstore decides to track customer complaints as part of their ongoing customer satisfaction improvement program. After collecting data for two months, their check sheet appears as follows: 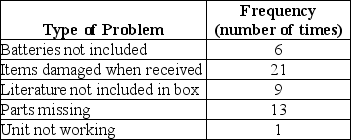 If they construct a Pareto chart, how many of these categories are required to make up 86% of all complaints?
A)1
B)2
C)3
D)4
E)5
If they construct a Pareto chart, how many of these categories are required to make up 86% of all complaints?A)1
B)2
C)3
D)4
E)5
Question
Question
The RC and More Superstore decides to track customer complaints as part of their ongoing customer satisfaction improvement program. After collecting data for two months, their check sheet appears as follows:  If they construct a Pareto chart, how many of these categories are required to make up 53% of all complaints?
A)1
B)2
C)3
D)4
E)5
If they construct a Pareto chart, how many of these categories are required to make up 53% of all complaints?A)1
B)2
C)3
D)4
E)5
Question
Question
Question
Question
Question
Question
Question
Question
Question
Question
Question
Question
Question
Question
Question
Question
Question
Question
Question
Question
Question
Question
Question
Question
Question
Question
Question
Question
Question
Cletus Inc. plans to overhaul the cafeteria menu and has formed a four-person team to evaluate alternatives. The team identifies four criteria and their respective percentage weights as shown in the table below: 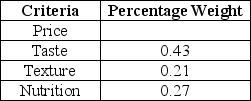 What is the percentage weight for the Nutrition criterion?
A)0.18
B)0.91
C)0.09
D)0.57
E)0.48
What is the percentage weight for the Nutrition criterion?A)0.18
B)0.91
C)0.09
D)0.57
E)0.48
Question
Question
Question
Cletus Inc. plans to overhaul the cafeteria menu and has formed a four-person team to evaluate alternatives. The team identifies four criteria and has ranked the Price criteria as shown in the table below: 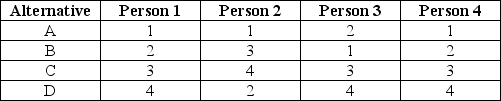 What is the final price ranking for alternative B?
A)first
B)second
C)third
D)fourth
E)cannot be determined from the information given
What is the final price ranking for alternative B?A)first
B)second
C)third
D)fourth
E)cannot be determined from the information given
Question
Question
Question
Question
Question
Cletus Inc. plans to overhaul the cafeteria menu and has formed a four-person team to evaluate alternatives. The team identifies four criteria and their corresponding percentage weights. Option C has ranks as shown in the table below: 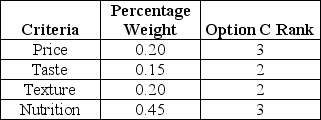 What is the importance score sum for option C?
A)1.35
B)2.20
C)2.65
D)3.45
E)4.80
What is the importance score sum for option C?A)1.35
B)2.20
C)2.65
D)3.45
E)4.80
Question
Question
Cletus Inc. plans to overhaul the cafeteria menu and has formed a four-person team to evaluate alternatives. The team identifies four criteria and their respective percentage weights as shown in the table below: 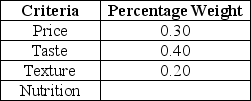 What is the percentage weight for the Nutrition criterion?
A)0.10
B)0.30
C)0.50
D)0.70
E)0.90
What is the percentage weight for the Nutrition criterion?A)0.10
B)0.30
C)0.50
D)0.70
E)0.90
Question
Cletus Inc. plans to overhaul the cafeteria menu and has formed a four-person team to evaluate alternatives. The team identifies four criteria and their corresponding percentage weights. Option A has ranks as shown in the table below: 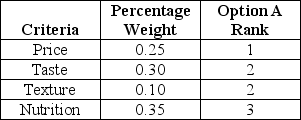 What is the importance score sum for option A?
A)1.0
B)2.1
C)4.2
D)8.0
E)9.6
What is the importance score sum for option A?A)1.0
B)2.1
C)4.2
D)8.0
E)9.6
Question
Cletus Inc. plans to overhaul the cafeteria menu and has formed a four-person team to evaluate alternatives. The team identifies four criteria and has ranked the Price criteria as shown in the table below:  What is the final price ranking for alternative C?
A)first
B)second
C)third
D)fourth
E)cannot be determined from the information given
What is the final price ranking for alternative C?A)first
B)second
C)third
D)fourth
E)cannot be determined from the information given
Question
Question
Question
Question
Question
Question

Unlock Deck
Sign up to unlock the cards in this deck!
Unlock Deck
Unlock Deck
1/98
Play
Full screen (f)
Deck 10: The Tools of Quality
1
The first step in process mapping is to settle on a standard set of process mapping symbols to be used.
True
2
What are the steps involved in process mapping?
A process map is a picture of a process. The first step in many process improvement projects is to create a map of the process as it exists. Steps in process mapping include:
• Settling on a standard set of process mapping symbols to be used.
• Clearly communicating the purpose of the process map to all the individuals involved in the exercise.
• Observing the work being performed by shadowing the workers performing the work.
• Developing a map of the process.
• Reviewing the process map with the employees to make needed changes and adjustments to the process map.
• Develop a map of the improved process.
3
The first step in setting up a ________ is to identify common defects occurring in the process.
A)histogram
B)Pareto chart
C)check sheet
D)control chart
E)process map
A)histogram
B)Pareto chart
C)check sheet
D)control chart
E)process map
C
4
The first step in many process improvement projects is to create a map of the process as it exists.
Unlock Deck
Unlock for access to all 98 flashcards in this deck.
Unlock Deck
k this deck
5
What are the basic process mapping symbols and why is it important to have a standard set of symbols?
Unlock Deck
Unlock for access to all 98 flashcards in this deck.
Unlock Deck
k this deck
6
In a process map, a parallelogram appears whenever materials, forms, or tools enter or leave the process.
Unlock Deck
Unlock for access to all 98 flashcards in this deck.
Unlock Deck
k this deck
7
A SIPOC diagram is useful when it is clear who the customers are and where specifications for inputs do not exist.
Unlock Deck
Unlock for access to all 98 flashcards in this deck.
Unlock Deck
k this deck
8
With reference to the language of process maps, a ________ is used whenever processing takes place.
A)circle
B)triangle
C)diamond
D)rectangle
E)parallelogram
A)circle
B)triangle
C)diamond
D)rectangle
E)parallelogram
Unlock Deck
Unlock for access to all 98 flashcards in this deck.
Unlock Deck
k this deck
9
________ are data-gathering tools that can be used in forming histograms.
A)Process maps
B)Pareto charts
C)Check sheets
D)Scatter plots
E)Control charts
A)Process maps
B)Pareto charts
C)Check sheets
D)Scatter plots
E)Control charts
Unlock Deck
Unlock for access to all 98 flashcards in this deck.
Unlock Deck
k this deck
10
With reference to the language of process maps, a ________ indicates there is a decision to be made.
A)parallelogram
B)rectangle
C)diamond
D)triangle
E)circle
A)parallelogram
B)rectangle
C)diamond
D)triangle
E)circle
Unlock Deck
Unlock for access to all 98 flashcards in this deck.
Unlock Deck
k this deck
11
A ________ determines the parameters for process improvement.
A)process map
B)check sheet
C)control chart
D)cause-and-effect diagram
E)histogram
A)process map
B)check sheet
C)control chart
D)cause-and-effect diagram
E)histogram
Unlock Deck
Unlock for access to all 98 flashcards in this deck.
Unlock Deck
k this deck
12
Check sheets are data-gathering tools that can be used in forming ________.
A)Pareto charts
B)scatter diagrams
C)cause-and-effect diagrams
D)histograms
E)control charts
A)Pareto charts
B)scatter diagrams
C)cause-and-effect diagrams
D)histograms
E)control charts
Unlock Deck
Unlock for access to all 98 flashcards in this deck.
Unlock Deck
k this deck
13
What is the first step in a process improvement project?
A)creating a control chart
B)developing scatter plots
C)developing a histogram
D)creating a process map
E)setting up a check sheet
A)creating a control chart
B)developing scatter plots
C)developing a histogram
D)creating a process map
E)setting up a check sheet
Unlock Deck
Unlock for access to all 98 flashcards in this deck.
Unlock Deck
k this deck
14
A histogram is a picture of a process.
Unlock Deck
Unlock for access to all 98 flashcards in this deck.
Unlock Deck
k this deck
15
A SIPOC diagram is a special type of ________.
A)control chart
B)process map
C)scatter diagram
D)histogram
E)cause-and-effect diagram
A)control chart
B)process map
C)scatter diagram
D)histogram
E)cause-and-effect diagram
Unlock Deck
Unlock for access to all 98 flashcards in this deck.
Unlock Deck
k this deck
16
In a process map, a rectangle indicates there is a decision to be made.
Unlock Deck
Unlock for access to all 98 flashcards in this deck.
Unlock Deck
k this deck
17
What is the first step in process mapping?
A)developing a map of the process
B)settling on a standard set of process mapping symbols to be used
C)reviewing a draft copy of the process map with the employees
D)observing the work being performed by shadowing the workers performing the work
E)clearly communicating the purpose of the process map to all the individuals involved in the exercise
Unlock Deck
Unlock for access to all 98 flashcards in this deck.
Unlock Deck
k this deck
18
The concept of a process map is that we must ________ the process before we can improve it.
A)understand
B)plan
C)know
D)analyze
E)coordinate
A)understand
B)plan
C)know
D)analyze
E)coordinate
Unlock Deck
Unlock for access to all 98 flashcards in this deck.
Unlock Deck
k this deck
19
The "P" in the acronym SIPOC stands for ________.
A)project
B)problem
C)people
D)process
E)product
A)project
B)problem
C)people
D)process
E)product
Unlock Deck
Unlock for access to all 98 flashcards in this deck.
Unlock Deck
k this deck
20
With reference to the language of process maps, a ________ is used whenever materials, forms, or tools enter or leave the process.
A)circle
B)triangle
C)diamond
D)rectangle
E)parallelogram
A)circle
B)triangle
C)diamond
D)rectangle
E)parallelogram
Unlock Deck
Unlock for access to all 98 flashcards in this deck.
Unlock Deck
k this deck
21
Calculate the number of classes if there are 32 observations in a data set.
A)7
B)6
C)5
D)4
E)3
A)7
B)6
C)5
D)4
E)3
Unlock Deck
Unlock for access to all 98 flashcards in this deck.
Unlock Deck
k this deck
22
The RC and More Superstore decides to track customer complaints as part of their ongoing customer satisfaction improvement program. After collecting data for two months, their check sheet appears as follows: If they construct a Pareto chart, what is the percentage of complaints represented by the problem "Unit not working"?
A)3%
B)6.7%
C)11.1%
D)17.8%
E)23%
If they construct a Pareto chart, what is the percentage of complaints represented by the problem "Unit not working"?A)3%
B)6.7%
C)11.1%
D)17.8%
E)23%
Unlock Deck
Unlock for access to all 98 flashcards in this deck.
Unlock Deck
k this deck
23
The first step in constructing ________ is to gather categorical data relating to quality problems.
A)control charts
B)histograms
C)scatter diagrams
D)Pareto charts
E)cause-and-effect diagrams
A)control charts
B)histograms
C)scatter diagrams
D)Pareto charts
E)cause-and-effect diagrams
Unlock Deck
Unlock for access to all 98 flashcards in this deck.
Unlock Deck
k this deck
24
The RC and More Superstore decides to track customer complaints as part of their ongoing customer satisfaction improvement program. After collecting data for two months, their check sheet appears as follows: If they construct a Pareto chart, what is the percentage of complaints represented by the problem "Literature not included in box"?
A)9%
B)18%
C)36%
D)54%
E)81%
If they construct a Pareto chart, what is the percentage of complaints represented by the problem "Literature not included in box"?A)9%
B)18%
C)36%
D)54%
E)81%
Unlock Deck
Unlock for access to all 98 flashcards in this deck.
Unlock Deck
k this deck
25
________ are simply graphical representations of data in a bar format.
A)Cause-and-effect diagrams
B)Process maps
C)Histograms
D)Scatter plots
E)Pareto charts
A)Cause-and-effect diagrams
B)Process maps
C)Histograms
D)Scatter plots
E)Pareto charts
Unlock Deck
Unlock for access to all 98 flashcards in this deck.
Unlock Deck
k this deck
26
The ________ is used to move to lower levels of abstraction in solving problems.
A)cause-and-effect diagram
B)Pareto chart
C)control chart
D)histogram
E)scatter diagram
A)cause-and-effect diagram
B)Pareto chart
C)control chart
D)histogram
E)scatter diagram
Unlock Deck
Unlock for access to all 98 flashcards in this deck.
Unlock Deck
k this deck
27
________ are frequency charts that are aided by the 80/20 rule.
A)Cause-and-effect diagrams
B)Control charts
C)Pareto charts
D)Histograms
E)Scatter diagrams
A)Cause-and-effect diagrams
B)Control charts
C)Pareto charts
D)Histograms
E)Scatter diagrams
Unlock Deck
Unlock for access to all 98 flashcards in this deck.
Unlock Deck
k this deck
28
The RC and More Superstore decides to track customer complaints as part of their ongoing customer satisfaction improvement program. After collecting data for two months, their check sheet appears as follows: If they construct a Pareto chart, what is the cumulative percentage of the two left most bars?
A)20%
B)28%
C)54%
D)68%
E)80%
If they construct a Pareto chart, what is the cumulative percentage of the two left most bars?A)20%
B)28%
C)54%
D)68%
E)80%
Unlock Deck
Unlock for access to all 98 flashcards in this deck.
Unlock Deck
k this deck
29
Calculate the number of classes if there are 16 observations in a data set.
A)7
B)6
C)5
D)4
E)3
A)7
B)6
C)5
D)4
E)3
Unlock Deck
Unlock for access to all 98 flashcards in this deck.
Unlock Deck
k this deck
30
The RC and More Superstore decides to track customer complaints as part of their ongoing customer satisfaction improvement program. After collecting data for two months, their check sheet appears as follows: If they construct a Pareto chart, what is the cumulative percentage of the two left most bars?
A)12%
B)27%
C)40%
D)60%
E)71%
If they construct a Pareto chart, what is the cumulative percentage of the two left most bars?A)12%
B)27%
C)40%
D)60%
E)71%
Unlock Deck
Unlock for access to all 98 flashcards in this deck.
Unlock Deck
k this deck
31
The RC and More Superstore decides to track customer complaints as part of their ongoing customer satisfaction improvement program. After collecting data for two months, their check sheet appears as follows: If they construct a Pareto chart, how many of these categories are required to make up 86% of all complaints?
A)1
B)2
C)3
D)4
E)5
If they construct a Pareto chart, how many of these categories are required to make up 86% of all complaints?A)1
B)2
C)3
D)4
E)5
Unlock Deck
Unlock for access to all 98 flashcards in this deck.
Unlock Deck
k this deck
32
Calculate the number of classes if there are 130 observations in a data set.
A)8
B)7
C)6
D)5
E)4
A)8
B)7
C)6
D)5
E)4
Unlock Deck
Unlock for access to all 98 flashcards in this deck.
Unlock Deck
k this deck
33
The RC and More Superstore decides to track customer complaints as part of their ongoing customer satisfaction improvement program. After collecting data for two months, their check sheet appears as follows: If they construct a Pareto chart, how many of these categories are required to make up 53% of all complaints?
A)1
B)2
C)3
D)4
E)5
If they construct a Pareto chart, how many of these categories are required to make up 53% of all complaints?A)1
B)2
C)3
D)4
E)5
Unlock Deck
Unlock for access to all 98 flashcards in this deck.
Unlock Deck
k this deck
34
The first step in creating a ________ is to state the problem clearly in the head of the fish.
A)control chart
B)Pareto chart
C)scatter diagram
D)cause-and-effect diagram
E)histogram
A)control chart
B)Pareto chart
C)scatter diagram
D)cause-and-effect diagram
E)histogram
Unlock Deck
Unlock for access to all 98 flashcards in this deck.
Unlock Deck
k this deck
35
The cause-and-effect diagram is also called a(n)________.
A)fishbone diagram
B)tree diagram
C)affinity diagram
D)matrix diagram
E)scatter diagram
A)fishbone diagram
B)tree diagram
C)affinity diagram
D)matrix diagram
E)scatter diagram
Unlock Deck
Unlock for access to all 98 flashcards in this deck.
Unlock Deck
k this deck
36
The first step in setting up a ________ is to determine the independent and dependent variables.
A)control chart
B)scatter plot
C)process map
D)histogram
E)check sheet
A)control chart
B)scatter plot
C)process map
D)histogram
E)check sheet
Unlock Deck
Unlock for access to all 98 flashcards in this deck.
Unlock Deck
k this deck
37
________ are used to determine whether a process will produce a product or service with consistent measurable properties.
A)Scatter diagrams
B)Control charts
C)Process maps
D)Cause-and-effect diagrams
E)Histograms
A)Scatter diagrams
B)Control charts
C)Process maps
D)Cause-and-effect diagrams
E)Histograms
Unlock Deck
Unlock for access to all 98 flashcards in this deck.
Unlock Deck
k this deck
38
________ are used to identify and prioritize problems to be solved.
A)Scatter diagrams
B)Histograms
C)Control charts
D)Cause-and-effect diagrams
E)Pareto charts
A)Scatter diagrams
B)Histograms
C)Control charts
D)Cause-and-effect diagrams
E)Pareto charts
Unlock Deck
Unlock for access to all 98 flashcards in this deck.
Unlock Deck
k this deck
39
The ________ is used to examine the relationships between variables.
A)scatter diagram
B)process map
C)cause-and-effect diagram
D)Pareto chart
E)control chart
A)scatter diagram
B)process map
C)cause-and-effect diagram
D)Pareto chart
E)control chart
Unlock Deck
Unlock for access to all 98 flashcards in this deck.
Unlock Deck
k this deck
40
Calculate the number of classes if there are 65 observations in a data set.
A)7
B)6
C)5
D)4
E)3
A)7
B)6
C)5
D)4
E)3
Unlock Deck
Unlock for access to all 98 flashcards in this deck.
Unlock Deck
k this deck
41
What are cause-and-effect diagrams?
Unlock Deck
Unlock for access to all 98 flashcards in this deck.
Unlock Deck
k this deck
42
The "ribs" of the fish on the fishbone diagram represent the problem while the "bones" represent the causes.
Unlock Deck
Unlock for access to all 98 flashcards in this deck.
Unlock Deck
k this deck
43
Describe the function of a Pareto chart. How does the 80/20 rule apply?
Unlock Deck
Unlock for access to all 98 flashcards in this deck.
Unlock Deck
k this deck
44
What are Ishikawa's seven basic tools of quality and how should they be used together?
Unlock Deck
Unlock for access to all 98 flashcards in this deck.
Unlock Deck
k this deck
45
The cause-and-effect diagram is also called a tree diagram.
Unlock Deck
Unlock for access to all 98 flashcards in this deck.
Unlock Deck
k this deck
46
Check sheets are data-gathering tools that can be used in forming histograms.
Unlock Deck
Unlock for access to all 98 flashcards in this deck.
Unlock Deck
k this deck
47
Define check sheets and describe the steps involved in setting up a check sheet.
Unlock Deck
Unlock for access to all 98 flashcards in this deck.
Unlock Deck
k this deck
48
Define a scatter diagram and describe the steps involved in setting up a scatter plot.
Unlock Deck
Unlock for access to all 98 flashcards in this deck.
Unlock Deck
k this deck
49
Pareto charts are used to identify and prioritize problems to be solved.
Unlock Deck
Unlock for access to all 98 flashcards in this deck.
Unlock Deck
k this deck
50
A scatter diagram is a graphical representation of data in a bar chart format.
Unlock Deck
Unlock for access to all 98 flashcards in this deck.
Unlock Deck
k this deck
51
When using Pareto analysis, a frequency chart is constructed showing the number of occurrences in ascending order.
Unlock Deck
Unlock for access to all 98 flashcards in this deck.
Unlock Deck
k this deck
52
The cause-and-effect diagram is used to move to higher levels of abstraction in solving problems.
Unlock Deck
Unlock for access to all 98 flashcards in this deck.
Unlock Deck
k this deck
53
The first step in setting up a fishbone diagram is to determine the independent and dependent variables.
Unlock Deck
Unlock for access to all 98 flashcards in this deck.
Unlock Deck
k this deck
54
Control charts are frequency charts that are aided by the 80/20 rule.
Unlock Deck
Unlock for access to all 98 flashcards in this deck.
Unlock Deck
k this deck
55
The first step in setting up a check sheet is to identify common defects occurring in the process.
Unlock Deck
Unlock for access to all 98 flashcards in this deck.
Unlock Deck
k this deck
56
Which of the following is one of Ishakawa's seven basic fools for quality improvements?
A)matrix diagram
B)activity network diagram
C)tree diagram
D)scatter diagram
E)affinity diagram
A)matrix diagram
B)activity network diagram
C)tree diagram
D)scatter diagram
E)affinity diagram
Unlock Deck
Unlock for access to all 98 flashcards in this deck.
Unlock Deck
k this deck
57
Histograms are simply graphical representations of data in a pie chart format.
Unlock Deck
Unlock for access to all 98 flashcards in this deck.
Unlock Deck
k this deck
58
Control charts are used to determine whether a process will produce a product or service with consistent measurable properties.
Unlock Deck
Unlock for access to all 98 flashcards in this deck.
Unlock Deck
k this deck
59
Define histograms and state the rules for developing histograms.
Unlock Deck
Unlock for access to all 98 flashcards in this deck.
Unlock Deck
k this deck
60
The root causes of the problems associated with the process are identified using a cause-and-effect diagram.
Unlock Deck
Unlock for access to all 98 flashcards in this deck.
Unlock Deck
k this deck
61
Which of the following is one of the new seven tools for management?
A)process map
B)cause-and-effect diagram
C)histogram
D)check sheet
E)affinity diagram
A)process map
B)cause-and-effect diagram
C)histogram
D)check sheet
E)affinity diagram
Unlock Deck
Unlock for access to all 98 flashcards in this deck.
Unlock Deck
k this deck
62
Cletus Inc. plans to overhaul the cafeteria menu and has formed a four-person team to evaluate alternatives. The team identifies four criteria and their respective percentage weights as shown in the table below: What is the percentage weight for the Nutrition criterion?
A)0.18
B)0.91
C)0.09
D)0.57
E)0.48
What is the percentage weight for the Nutrition criterion?A)0.18
B)0.91
C)0.09
D)0.57
E)0.48
Unlock Deck
Unlock for access to all 98 flashcards in this deck.
Unlock Deck
k this deck
63
The ________ is also known as a PERT diagram or critical path diagram and is used in controlling projects.
A)affinity diagram
B)tree diagram
C)activity network diagram
D)cause-and-effect diagram
E)matrix diagram
A)affinity diagram
B)tree diagram
C)activity network diagram
D)cause-and-effect diagram
E)matrix diagram
Unlock Deck
Unlock for access to all 98 flashcards in this deck.
Unlock Deck
k this deck
64
A(n)________ is very similar to a work breakdown structure used in planning projects.
A)matrix diagram
B)prioritization grid
C)interrelationship digraph
D)affinity diagram
E)tree diagram
A)matrix diagram
B)prioritization grid
C)interrelationship digraph
D)affinity diagram
E)tree diagram
Unlock Deck
Unlock for access to all 98 flashcards in this deck.
Unlock Deck
k this deck
65
Cletus Inc. plans to overhaul the cafeteria menu and has formed a four-person team to evaluate alternatives. The team identifies four criteria and has ranked the Price criteria as shown in the table below: What is the final price ranking for alternative B?
A)first
B)second
C)third
D)fourth
E)cannot be determined from the information given
What is the final price ranking for alternative B?A)first
B)second
C)third
D)fourth
E)cannot be determined from the information given
Unlock Deck
Unlock for access to all 98 flashcards in this deck.
Unlock Deck
k this deck
66
An activity network diagram helps a group converge on a set number of themes or ideas that can be addressed later.
Unlock Deck
Unlock for access to all 98 flashcards in this deck.
Unlock Deck
k this deck
67
The first step in completing a(n)________ is to construct an affinity diagram to identify the issues relating to a problem.
A)interrelationship digraph
B)matrix diagram
C)tree diagram
D)prioritization grid
E)activity network diagram
A)interrelationship digraph
B)matrix diagram
C)tree diagram
D)prioritization grid
E)activity network diagram
Unlock Deck
Unlock for access to all 98 flashcards in this deck.
Unlock Deck
k this deck
68
A(n)________ is useful to identify the steps needed to address the given problem.
A)tree diagram
B)prioritization grid
C)activity network diagram
D)interrelationship digraph
E)affinity diagram
A)tree diagram
B)prioritization grid
C)activity network diagram
D)interrelationship digraph
E)affinity diagram
Unlock Deck
Unlock for access to all 98 flashcards in this deck.
Unlock Deck
k this deck
69
The first step in completing a(n)________ is to assemble the header cards from the affinity diagram.
A)matrix diagram
B)tree diagram
C)prioritization grid
D)activity network diagram
E)interrelationship digraph
A)matrix diagram
B)tree diagram
C)prioritization grid
D)activity network diagram
E)interrelationship digraph
Unlock Deck
Unlock for access to all 98 flashcards in this deck.
Unlock Deck
k this deck
70
Cletus Inc. plans to overhaul the cafeteria menu and has formed a four-person team to evaluate alternatives. The team identifies four criteria and their corresponding percentage weights. Option C has ranks as shown in the table below: What is the importance score sum for option C?
A)1.35
B)2.20
C)2.65
D)3.45
E)4.80
What is the importance score sum for option C?A)1.35
B)2.20
C)2.65
D)3.45
E)4.80
Unlock Deck
Unlock for access to all 98 flashcards in this deck.
Unlock Deck
k this deck
71
The first step to making a prioritization grid is to construct an affinity diagram to identify the issues relating to a problem.
Unlock Deck
Unlock for access to all 98 flashcards in this deck.
Unlock Deck
k this deck
72
Cletus Inc. plans to overhaul the cafeteria menu and has formed a four-person team to evaluate alternatives. The team identifies four criteria and their respective percentage weights as shown in the table below: What is the percentage weight for the Nutrition criterion?
A)0.10
B)0.30
C)0.50
D)0.70
E)0.90
What is the percentage weight for the Nutrition criterion?A)0.10
B)0.30
C)0.50
D)0.70
E)0.90
Unlock Deck
Unlock for access to all 98 flashcards in this deck.
Unlock Deck
k this deck
73
Cletus Inc. plans to overhaul the cafeteria menu and has formed a four-person team to evaluate alternatives. The team identifies four criteria and their corresponding percentage weights. Option A has ranks as shown in the table below: What is the importance score sum for option A?
A)1.0
B)2.1
C)4.2
D)8.0
E)9.6
What is the importance score sum for option A?A)1.0
B)2.1
C)4.2
D)8.0
E)9.6
Unlock Deck
Unlock for access to all 98 flashcards in this deck.
Unlock Deck
k this deck
74
Cletus Inc. plans to overhaul the cafeteria menu and has formed a four-person team to evaluate alternatives. The team identifies four criteria and has ranked the Price criteria as shown in the table below: What is the final price ranking for alternative C?
A)first
B)second
C)third
D)fourth
E)cannot be determined from the information given
What is the final price ranking for alternative C?A)first
B)second
C)third
D)fourth
E)cannot be determined from the information given
Unlock Deck
Unlock for access to all 98 flashcards in this deck.
Unlock Deck
k this deck
75
An affinity diagram creates a hierarchy of ideas on a large surface.
Unlock Deck
Unlock for access to all 98 flashcards in this deck.
Unlock Deck
k this deck
76
A(n)________ is a tool that helps a group converge on a set number of themes or ideas that can be addressed later.
A)tree diagram
B)affinity diagram
C)prioritization grid
D)matrix diagram
E)interrelationship digraph
A)tree diagram
B)affinity diagram
C)prioritization grid
D)matrix diagram
E)interrelationship digraph
Unlock Deck
Unlock for access to all 98 flashcards in this deck.
Unlock Deck
k this deck
77
The tree diagram is useful to identify the steps needed to address a given problem.
Unlock Deck
Unlock for access to all 98 flashcards in this deck.
Unlock Deck
k this deck
78
The Pareto chart is one of the new seven tools for management.
Unlock Deck
Unlock for access to all 98 flashcards in this deck.
Unlock Deck
k this deck
79
The ________ is similar in concept to quality function deployment in its use of symbols, its layout, and its application.
A)matrix diagram
B)tree diagram
C)prioritization grid
D)affinity diagram
E)activity network diagram
A)matrix diagram
B)tree diagram
C)prioritization grid
D)affinity diagram
E)activity network diagram
Unlock Deck
Unlock for access to all 98 flashcards in this deck.
Unlock Deck
k this deck
80
A(n)________ is used to make decisions based on multiple criteria.
A)tree diagram
B)matrix diagram
C)interrelationship digraph
D)prioritization grid
E)affinity diagram
A)tree diagram
B)matrix diagram
C)interrelationship digraph
D)prioritization grid
E)affinity diagram
Unlock Deck
Unlock for access to all 98 flashcards in this deck.
Unlock Deck
k this deck
Unlock Deck
Unlock for access to all 98 flashcards in this deck.


