Deck 6: Random Variables and Probability Distributions
Full screen (f)
Question
Question
Question
Question
Question
Question
Question
Question

Question
At the College of Warm & Fuzzy, good grades in math are easy to come by. The
grade distribution is given in the table below: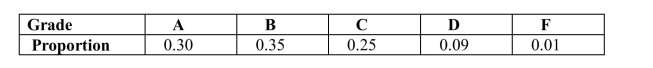 Suppose three students' grade reports are selected at random with replacement. (The
math grade is written down and the report replaced in the population of reports before
the next report is selected.) Three possible outcomes of this experiment are listed
below. Calculate the probabilities of these sequences appearing.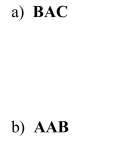
grade distribution is given in the table below:
Suppose three students' grade reports are selected at random with replacement. (Themath grade is written down and the report replaced in the population of reports before
the next report is selected.) Three possible outcomes of this experiment are listed
below. Calculate the probabilities of these sequences appearing.
Question
Question
The density curve for a continuous random variable is shown below. Use this curve
to find the following probabilities: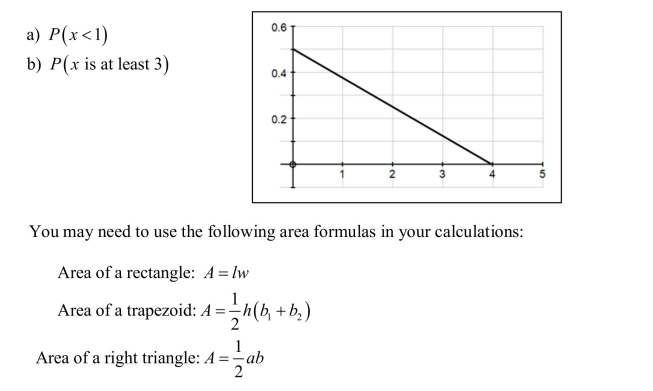
to find the following probabilities:
Question
Question
Question
Question
Road construction in the town of Hiawatha has presented some problems for the
traffic engineers. Small businesses such as Bev's Hair Gallery will require an
alternate entrance for their customers. This will in turn create a minor congestion of
traffic nearby because cars will be backed up and the entrance to the parking lot. The
engineers have studied the problem using simulations based on current traffic
patterns. The results from 500 trials are shown below: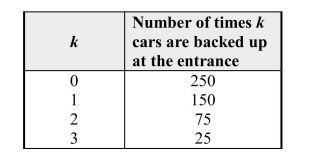 Let the random variable k = number of cars backed up at the entrance.
a) Fill in the table below with the estimated probability distribution of k, and sketch
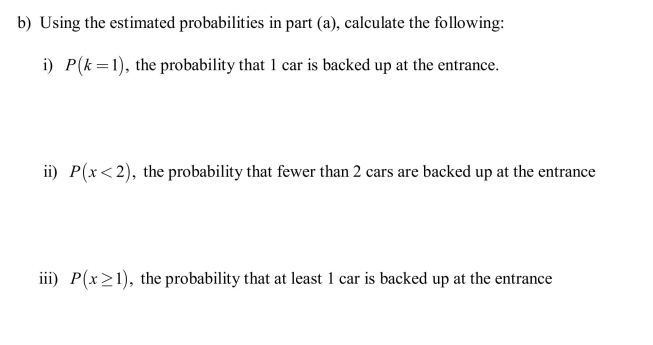
a probability histogram for x.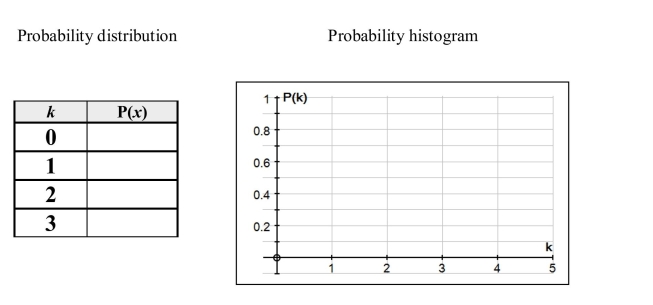 b) Using the estimated probabilities in part (a), calculate the following:
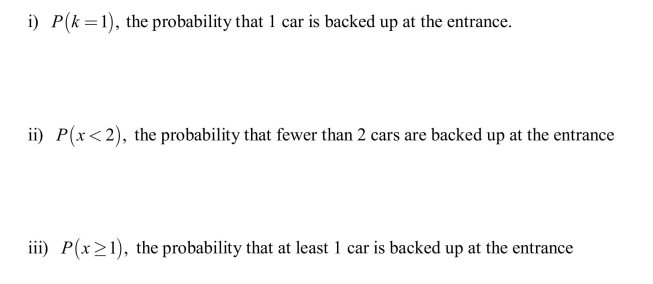
traffic engineers. Small businesses such as Bev's Hair Gallery will require an
alternate entrance for their customers. This will in turn create a minor congestion of
traffic nearby because cars will be backed up and the entrance to the parking lot. The
engineers have studied the problem using simulations based on current traffic
patterns. The results from 500 trials are shown below:
Let the random variable k = number of cars backed up at the entrance.a) Fill in the table below with the estimated probability distribution of k, and sketch
a probability histogram for x.
b) Using the estimated probabilities in part (a), calculate the following: Question

Question

Question
Question
Question
Question
Question
Question
Question
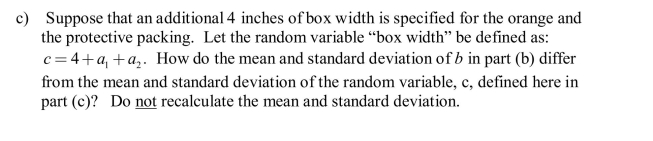
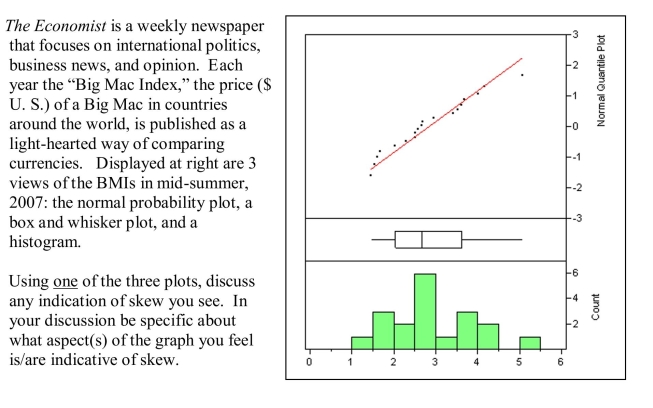
The number of copies sold of a newsmagazine varies from week to week. Empirical
data gathered over many years suggest the following distribution of x = weekly sales
(rounded to the nearest million.) What is the mean of this distribution?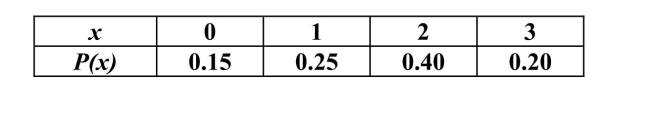
data gathered over many years suggest the following distribution of x = weekly sales
(rounded to the nearest million.) What is the mean of this distribution?
Question
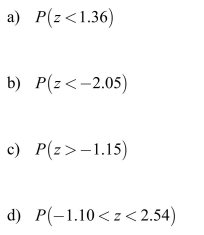
Let z denote a random variable having a standard normal distribution. Determine each
of the following probabilities.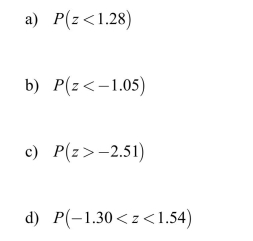
of the following probabilities.
Question
The graphs below are normal probability plots of the vocabulary and math concept
scores on a standardized exam for a large sample of students. One of the score
distributions is approximately normal. Identify the score distribution that is
approximately normal and explain the reason for your choice.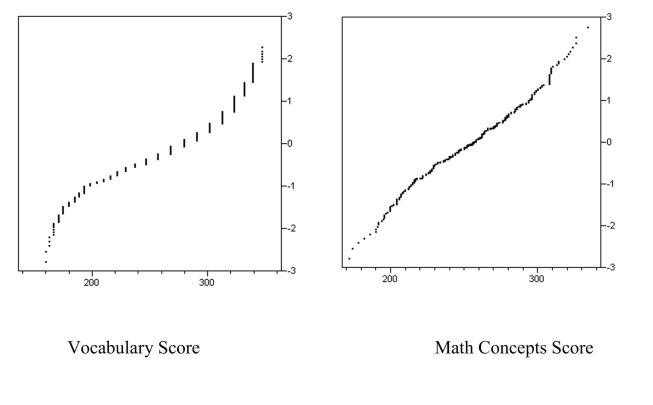
scores on a standardized exam for a large sample of students. One of the score
distributions is approximately normal. Identify the score distribution that is
approximately normal and explain the reason for your choice.
Question
At the University of Tough Love, good grades in math are hard to come by. The
grade distribution is shown in the table below: Suppose three students' grade reports are selected at random with replacement. (The
math grade is written down and the report replaced in the population of reports before
the next report is selected.) Three possible outcomes of this experiment are listed
below. Calculate the probabilities of these sequences appearing.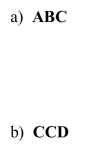
grade distribution is shown in the table below:
Suppose three students' grade reports are selected at random with replacement. (Themath grade is written down and the report replaced in the population of reports before
the next report is selected.) Three possible outcomes of this experiment are listed
below. Calculate the probabilities of these sequences appearing.
Question
Question
Each course at a large university has either a final exam or a final paper. The table
below presents the distribution of the number of final exams that students at the
university take in the Fall term, and their associated probabilities. What is the mean
of this distribution?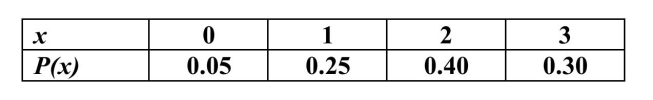
below presents the distribution of the number of final exams that students at the
university take in the Fall term, and their associated probabilities. What is the mean
of this distribution?
Question
A state-wide math test consists of 50 True/False questions and 40 multiple choice
questions with 5 answer options. The total score (TS) is equal to the number of
true/false items correct plus twice the number of multiple-choice items correct.
a) For students who are randomly guessing, the distribution of scores on the 50
True/False questions is a binomial distribution with probability of success equal to 0.50. If we define the random variable T = score from T/F items, what are the mean
and standard deviation of T for students who are guessing?
b) For students who are randomly guessing, the distribution of scores on the 40 multiple
choice questions is a binomial distribution with probability of success equal to 0.20.
If we define the random variable M = score from multiple choice items, what are the
mean and standard deviation of M for students who are guessing?
c) The total score, TS, is a random variable formed by calculating Using your
results from parts (a) and (b), find the mean and standard deviation of the random
variable TS.
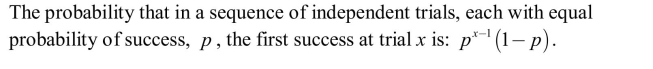
d) For students who randomly guess on the multiple choice part of the test, what is the
probability that the first question correct is the 4th question?
questions with 5 answer options. The total score (TS) is equal to the number of
true/false items correct plus twice the number of multiple-choice items correct.
a) For students who are randomly guessing, the distribution of scores on the 50
True/False questions is a binomial distribution with probability of success equal to 0.50. If we define the random variable T = score from T/F items, what are the mean
and standard deviation of T for students who are guessing?
b) For students who are randomly guessing, the distribution of scores on the 40 multiple
choice questions is a binomial distribution with probability of success equal to 0.20.
If we define the random variable M = score from multiple choice items, what are the
mean and standard deviation of M for students who are guessing?
c) The total score, TS, is a random variable formed by calculating
Using yourresults from parts (a) and (b), find the mean and standard deviation of the random
variable TS.
d) For students who randomly guess on the multiple choice part of the test, what is the
probability that the first question correct is the 4th question?
Question
Question
Road construction in the town of Hiawatha has presented some problems for the
traffic engineers. Small businesses such as Joe's Barber Shop will require an
alternate entrance for their customers. This will in turn create a minor congestion of
traffic nearby because cars will be backed up and the entrance to the parking lot. The
engineers have studied the problem using simulations based on current traffic
patterns. The results from 500 trials are shown below: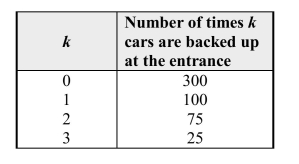 Let the random variable k = number of cars backed up at the entrance.
a) Fill in the table below with the estimated probability distribution of k, and sketch a
probability histogram for x.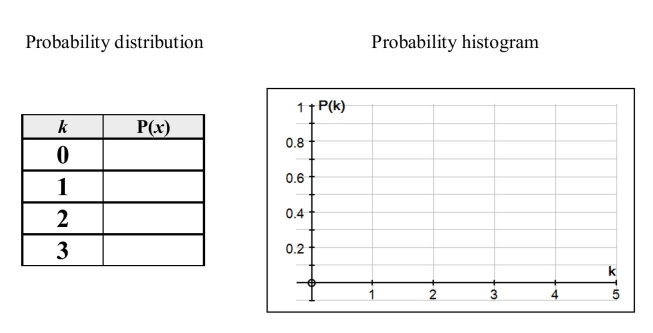
traffic engineers. Small businesses such as Joe's Barber Shop will require an
alternate entrance for their customers. This will in turn create a minor congestion of
traffic nearby because cars will be backed up and the entrance to the parking lot. The
engineers have studied the problem using simulations based on current traffic
patterns. The results from 500 trials are shown below:
Let the random variable k = number of cars backed up at the entrance.a) Fill in the table below with the estimated probability distribution of k, and sketch a
probability histogram for x.
Question
Suppose that the distribution of maximum daily temperatures in Hacienda Heights,
CA, for the month of December has a mean of 17˚Celsius with a standard deviation of
3˚Celsius. Let the random variable F be the maximum daily temperature in degrees
Fahrenheit. The relation between Fahrenheit degrees (F) and Celsius degrees (C) is: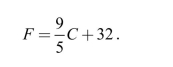 a) What is the mean of F?
b) What is the standard deviation of F?
CA, for the month of December has a mean of 17˚Celsius with a standard deviation of
3˚Celsius. Let the random variable F be the maximum daily temperature in degrees
Fahrenheit. The relation between Fahrenheit degrees (F) and Celsius degrees (C) is:
a) What is the mean of F?b) What is the standard deviation of F?
Question
Question
Question
Question
Question
The density curve for a continuous random variable is shown below. Use this curve
to find the following probabilities: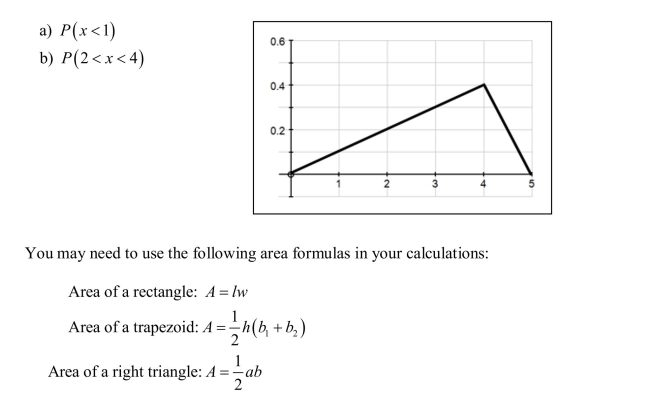
to find the following probabilities:
Question
When driving the nation's highways, Anna is known as something of a lead foot. Her
number of miles per hour over the speed limit varies, but has a mean of 7.5 mph and
standard deviation of 2 mph. Unfortunately her state adjusts the fines so that the
amount of the fine (in dollars) is given by the formula: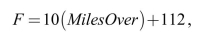 where F is the amount of the fine, and MilesOver is the number of miles over the
speed limit. Let random variable F be the amount of her fine if she is stopped for
speeding.
a) What is the mean of F?
b) What is the standard deviation of F?
number of miles per hour over the speed limit varies, but has a mean of 7.5 mph and
standard deviation of 2 mph. Unfortunately her state adjusts the fines so that the
amount of the fine (in dollars) is given by the formula:
where F is the amount of the fine, and MilesOver is the number of miles over thespeed limit. Let random variable F be the amount of her fine if she is stopped for
speeding.
a) What is the mean of F?
b) What is the standard deviation of F?
Question
Question

Question
Question
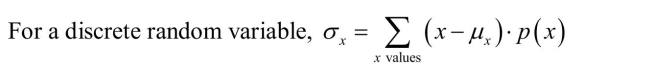
For a variable that has a standard normal distribution, 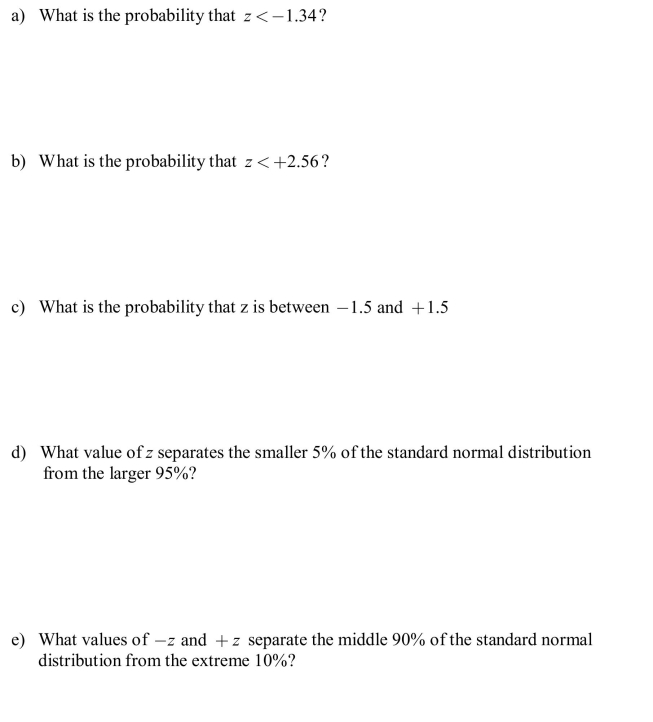
Question
Question
The Department of Transportation (D.O.T.) in a very large city has organized a new
system of bus transportation. In an advertising campaign, citizens are encouraged to
use the new "GO-D.O.T!" system. Suppose that at one of the bus stops the length of
time (in minutes) that a commuter must wait for a bus is a uniformly distributed
random variable, T. The possible values of T are from 0 minutes to 20 minutes.
Question
Question
Question
At the last home football game of the season, the senior football players walk through
a specially constructed welcoming arch, 2 abreast. The arch is 50" wide. It is
considered unseemly to bump each other on the way through, so the arch must be
wide enough for two players to go through. The distribution of widths of football
players with shoulder pads is approximately normal with a mean of 30 inches, and the
standard deviation is 5 inches. Let random variable w = width in inches of a
randomly selected padded football player.
Question
For a variable z that has a standard normal distribution, 
Question
Question
A marketer of holiday fruit boxes has a new order for boxes that will hold 12 pieces of
fruit. The box is to hold 4 rows of fruit, each row consisting of an orange and two
apples. In addition to the fruit there will need to be protective packing lining the
box. The mean diameter of oranges is 3.0 inches and the standard deviation is 0.25
inches. The mean diameter of apples is 4.0 inches and the standard deviation is 0.2
inches.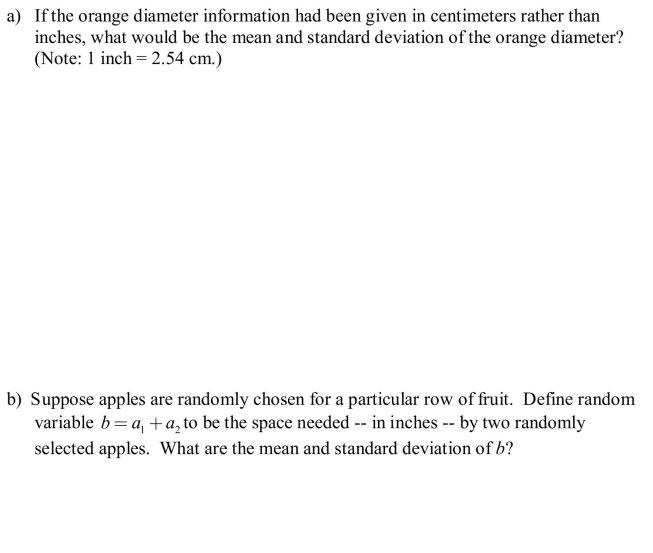
Question
Question
Question
Question
Question
Question

Unlock Deck
Sign up to unlock the cards in this deck!
Unlock Deck
Unlock Deck
1/57
Play
Full screen (f)
Deck 6: Random Variables and Probability Distributions
1
What is a random variable?
A random variable is a numerical variable whose value depends on the outcome of a chance
experiment.
experiment.
2
False
3
The standard normal distribution has a mean equal to 0 and standard
deviation equal to 1.
deviation equal to 1.
True
4
A random variable is discrete if its value depends upon the outcome of a
chance experiment.
chance experiment.
Unlock Deck
Unlock for access to all 57 flashcards in this deck.
Unlock Deck
k this deck
5
Using the notation C = continuous and D = discrete, indicate whether each of the
following random variables is discrete or continuous.
a) The number of defective lights in a school's main hallway on a randomly selected
day
b) The barometric pressure at midnight in a particular location in Iowa on a randomly
selected day
c) The number of staples left in a stapler at a randomly selected time
d) The number of sentences in a short story selected at random from a collection of
short stories
e) The oven temperature at a randomly selected time during the cooking of a turkey
Unlock Deck
Unlock for access to all 57 flashcards in this deck.
Unlock Deck
k this deck
6
A random variable is continuous if its possible values are all points in
some interval.
some interval.
Unlock Deck
Unlock for access to all 57 flashcards in this deck.
Unlock Deck
k this deck
7
What is a random variable?
Unlock Deck
Unlock for access to all 57 flashcards in this deck.
Unlock Deck
k this deck
8
Unlock Deck
Unlock for access to all 57 flashcards in this deck.
Unlock Deck
k this deck
9
At the College of Warm & Fuzzy, good grades in math are easy to come by. The
grade distribution is given in the table below: Suppose three students' grade reports are selected at random with replacement. (The
math grade is written down and the report replaced in the population of reports before
the next report is selected.) Three possible outcomes of this experiment are listed
below. Calculate the probabilities of these sequences appearing.
grade distribution is given in the table below:
Suppose three students' grade reports are selected at random with replacement. (Themath grade is written down and the report replaced in the population of reports before
the next report is selected.) Three possible outcomes of this experiment are listed
below. Calculate the probabilities of these sequences appearing.
Unlock Deck
Unlock for access to all 57 flashcards in this deck.
Unlock Deck
k this deck
10
Unlock Deck
Unlock for access to all 57 flashcards in this deck.
Unlock Deck
k this deck
11
The density curve for a continuous random variable is shown below. Use this curve
to find the following probabilities:
to find the following probabilities:
Unlock Deck
Unlock for access to all 57 flashcards in this deck.
Unlock Deck
k this deck
12
Unlock Deck
Unlock for access to all 57 flashcards in this deck.
Unlock Deck
k this deck
13
For a continuous random variable x, the area under the density curve above
an interval a to b represents the probability that the value of x is between a
and b.
an interval a to b represents the probability that the value of x is between a
and b.
Unlock Deck
Unlock for access to all 57 flashcards in this deck.
Unlock Deck
k this deck
14
Unlock Deck
Unlock for access to all 57 flashcards in this deck.
Unlock Deck
k this deck
15
Road construction in the town of Hiawatha has presented some problems for the
traffic engineers. Small businesses such as Bev's Hair Gallery will require an
alternate entrance for their customers. This will in turn create a minor congestion of
traffic nearby because cars will be backed up and the entrance to the parking lot. The
engineers have studied the problem using simulations based on current traffic
patterns. The results from 500 trials are shown below: Let the random variable k = number of cars backed up at the entrance.
a) Fill in the table below with the estimated probability distribution of k, and sketch
a probability histogram for x. b) Using the estimated probabilities in part (a), calculate the following:
traffic engineers. Small businesses such as Bev's Hair Gallery will require an
alternate entrance for their customers. This will in turn create a minor congestion of
traffic nearby because cars will be backed up and the entrance to the parking lot. The
engineers have studied the problem using simulations based on current traffic
patterns. The results from 500 trials are shown below:
Let the random variable k = number of cars backed up at the entrance.a) Fill in the table below with the estimated probability distribution of k, and sketch
a probability histogram for x.
b) Using the estimated probabilities in part (a), calculate the following: Unlock Deck
Unlock for access to all 57 flashcards in this deck.
Unlock Deck
k this deck
16
Unlock Deck
Unlock for access to all 57 flashcards in this deck.
Unlock Deck
k this deck
17
Unlock Deck
Unlock for access to all 57 flashcards in this deck.
Unlock Deck
k this deck
18
A normal probability plot suggests that a normal probability model is
plausible if there is no obvious pattern in the scatter of points.
plausible if there is no obvious pattern in the scatter of points.
Unlock Deck
Unlock for access to all 57 flashcards in this deck.
Unlock Deck
k this deck
19
Unlock Deck
Unlock for access to all 57 flashcards in this deck.
Unlock Deck
k this deck
20
The distribution of all values of a random variable is called a normal
distribution.
distribution.
Unlock Deck
Unlock for access to all 57 flashcards in this deck.
Unlock Deck
k this deck
21
Determine the following areas under the standard normal (z) curve.
a) The area under the z curve to the left of 1.56
b) The area under the z curve to the left of -2.13
c) The area under the z curve to the right of 0.88
d) The area under the z curve to the right of -1.23
e) The area under the z curve between -2 and 3
f) The area under the z curve between -2.4 and -1.4
Unlock Deck
Unlock for access to all 57 flashcards in this deck.
Unlock Deck
k this deck
22
Electric power cords are a common hazard in households with computers. They are
easily tripped over and the delicate computer equipment may be pulled from tables
and damaged. A new "breakaway" power cord has been designed by Alpha
Enterprises. Alpha has determined that a breakaway force of between 3.0 and 5.0
pounds is appropriate. (If the force is too low the cord would break in normal use; if
the force is too high the cord would not be effective.) Alpha can order cord material
from two companies, Beta and Gamma. The breakaway force for the Beta material
is approximately normally distributed with a mean of 4.5 pounds and a standard
deviation of 1.0 pounds. The breakaway force for the Gamma material is
approximately normally distributed with a mean of 4.0 pounds and a standard
deviation of 1.5 pounds.
Alpha will choose the cord material that has the higher probability of breaking within
the specified 3.0 and 5.0 pound limits. From which company should Alpha order
cord material? Provide appropriate statistical justification for your choice.
Unlock Deck
Unlock for access to all 57 flashcards in this deck.
Unlock Deck
k this deck
23
One theory of why birds form in flocks is that flocks increase efficiency in scanning
for approaching predators. Because birds can barely move their eyes they must turn
their heads to look for predators, making them temporarily unable to peck for food. If
the birds form flocks, each bird could spend less time scanning; when a single bird
detects a predator it alerts the other birds.
The Chanting Goshawk is a predator of the Red-billed Weaver bird. From field
observation it is estimated that an individual weaver bird has a probability of 0.20 of
detecting a goshawk in time to fly to safety. Suppose that a goshawk suddenly comes
upon a flock of 4 weaver birds pecking for food on the ground, and attacks.
a) What is the probability that none of the weaver birds will detect the goshawk's
presence before it is too late, thus allowing the goshawk to have a weaver bird
lunch?
b) What is the probability that at least one of the weaver birds will detect the
goshawk's presence, thus alerting the others and all fly away, leaving the
goshawk hungry?
c) Suppose this is Wednesday, and all weaver birds form flocks of size 4 on
Wednesdays. Using your results from parts (a) and/or (b), find the probability
that a goshawk will go hungry until swooping down on the 5th flock of 4 weaver
birds seen that day.
Unlock Deck
Unlock for access to all 57 flashcards in this deck.
Unlock Deck
k this deck
24
The number of copies sold of a newsmagazine varies from week to week. Empirical
data gathered over many years suggest the following distribution of x = weekly sales
(rounded to the nearest million.) What is the mean of this distribution?
data gathered over many years suggest the following distribution of x = weekly sales
(rounded to the nearest million.) What is the mean of this distribution?
Unlock Deck
Unlock for access to all 57 flashcards in this deck.
Unlock Deck
k this deck
25
Let z denote a random variable having a standard normal distribution. Determine each
of the following probabilities.
of the following probabilities.
Unlock Deck
Unlock for access to all 57 flashcards in this deck.
Unlock Deck
k this deck
26
The graphs below are normal probability plots of the vocabulary and math concept
scores on a standardized exam for a large sample of students. One of the score
distributions is approximately normal. Identify the score distribution that is
approximately normal and explain the reason for your choice.
scores on a standardized exam for a large sample of students. One of the score
distributions is approximately normal. Identify the score distribution that is
approximately normal and explain the reason for your choice.
Unlock Deck
Unlock for access to all 57 flashcards in this deck.
Unlock Deck
k this deck
27
At the University of Tough Love, good grades in math are hard to come by. The
grade distribution is shown in the table below: Suppose three students' grade reports are selected at random with replacement. (The
math grade is written down and the report replaced in the population of reports before
the next report is selected.) Three possible outcomes of this experiment are listed
below. Calculate the probabilities of these sequences appearing.
grade distribution is shown in the table below:
Suppose three students' grade reports are selected at random with replacement. (Themath grade is written down and the report replaced in the population of reports before
the next report is selected.) Three possible outcomes of this experiment are listed
below. Calculate the probabilities of these sequences appearing.
Unlock Deck
Unlock for access to all 57 flashcards in this deck.
Unlock Deck
k this deck
28
What information about a probability distribution do the mean and standard deviation
of a random variable provide?
of a random variable provide?
Unlock Deck
Unlock for access to all 57 flashcards in this deck.
Unlock Deck
k this deck
29
Each course at a large university has either a final exam or a final paper. The table
below presents the distribution of the number of final exams that students at the
university take in the Fall term, and their associated probabilities. What is the mean
of this distribution?
below presents the distribution of the number of final exams that students at the
university take in the Fall term, and their associated probabilities. What is the mean
of this distribution?
Unlock Deck
Unlock for access to all 57 flashcards in this deck.
Unlock Deck
k this deck
30
A state-wide math test consists of 50 True/False questions and 40 multiple choice
questions with 5 answer options. The total score (TS) is equal to the number of
true/false items correct plus twice the number of multiple-choice items correct.
a) For students who are randomly guessing, the distribution of scores on the 50
True/False questions is a binomial distribution with probability of success equal to 0.50. If we define the random variable T = score from T/F items, what are the mean
and standard deviation of T for students who are guessing?
b) For students who are randomly guessing, the distribution of scores on the 40 multiple
choice questions is a binomial distribution with probability of success equal to 0.20.
If we define the random variable M = score from multiple choice items, what are the
mean and standard deviation of M for students who are guessing?
c) The total score, TS, is a random variable formed by calculating Using your
results from parts (a) and (b), find the mean and standard deviation of the random
variable TS.
d) For students who randomly guess on the multiple choice part of the test, what is the
probability that the first question correct is the 4th question?
questions with 5 answer options. The total score (TS) is equal to the number of
true/false items correct plus twice the number of multiple-choice items correct.
a) For students who are randomly guessing, the distribution of scores on the 50
True/False questions is a binomial distribution with probability of success equal to 0.50. If we define the random variable T = score from T/F items, what are the mean
and standard deviation of T for students who are guessing?
b) For students who are randomly guessing, the distribution of scores on the 40 multiple
choice questions is a binomial distribution with probability of success equal to 0.20.
If we define the random variable M = score from multiple choice items, what are the
mean and standard deviation of M for students who are guessing?
c) The total score, TS, is a random variable formed by calculating
Using yourresults from parts (a) and (b), find the mean and standard deviation of the random
variable TS.
d) For students who randomly guess on the multiple choice part of the test, what is the
probability that the first question correct is the 4th question?
Unlock Deck
Unlock for access to all 57 flashcards in this deck.
Unlock Deck
k this deck
31
A gasoline tank for a certain model car is designed to hold 12 gallons of gas. Suppose
that the actual capacity of gas tanks in cars of this type is well approximated by a
normal distribution with mean 12.0 gallons and standard deviation 0.2 gallons. What
is the approximate probability that a randomly selected car of this model will have a
gas tank that holds at most 11.7 gallons?
that the actual capacity of gas tanks in cars of this type is well approximated by a
normal distribution with mean 12.0 gallons and standard deviation 0.2 gallons. What
is the approximate probability that a randomly selected car of this model will have a
gas tank that holds at most 11.7 gallons?
Unlock Deck
Unlock for access to all 57 flashcards in this deck.
Unlock Deck
k this deck
32
Road construction in the town of Hiawatha has presented some problems for the
traffic engineers. Small businesses such as Joe's Barber Shop will require an
alternate entrance for their customers. This will in turn create a minor congestion of
traffic nearby because cars will be backed up and the entrance to the parking lot. The
engineers have studied the problem using simulations based on current traffic
patterns. The results from 500 trials are shown below: Let the random variable k = number of cars backed up at the entrance.
a) Fill in the table below with the estimated probability distribution of k, and sketch a
probability histogram for x.
traffic engineers. Small businesses such as Joe's Barber Shop will require an
alternate entrance for their customers. This will in turn create a minor congestion of
traffic nearby because cars will be backed up and the entrance to the parking lot. The
engineers have studied the problem using simulations based on current traffic
patterns. The results from 500 trials are shown below:
Let the random variable k = number of cars backed up at the entrance.a) Fill in the table below with the estimated probability distribution of k, and sketch a
probability histogram for x.
Unlock Deck
Unlock for access to all 57 flashcards in this deck.
Unlock Deck
k this deck
33
Suppose that the distribution of maximum daily temperatures in Hacienda Heights,
CA, for the month of December has a mean of 17˚Celsius with a standard deviation of
3˚Celsius. Let the random variable F be the maximum daily temperature in degrees
Fahrenheit. The relation between Fahrenheit degrees (F) and Celsius degrees (C) is: a) What is the mean of F?
b) What is the standard deviation of F?
CA, for the month of December has a mean of 17˚Celsius with a standard deviation of
3˚Celsius. Let the random variable F be the maximum daily temperature in degrees
Fahrenheit. The relation between Fahrenheit degrees (F) and Celsius degrees (C) is:
a) What is the mean of F?b) What is the standard deviation of F?
Unlock Deck
Unlock for access to all 57 flashcards in this deck.
Unlock Deck
k this deck
34
Using the notation C = continuous and D = discrete, indicate whether each of the
random variables is discrete or continuous.
a) The number of steps to the principal's office from a randomly selected location
at a particular school.
b) The average night time temperature on a randomly selected day in July at Long's
Peak in Colorado
c) The number of eggs in a kitchen on a randomly selected day.
d) The number of sentences in a short story selected at random from a collection
of short stories.
e) The circumference of a randomly selected California redwood tree
Unlock Deck
Unlock for access to all 57 flashcards in this deck.
Unlock Deck
k this deck
35
Determine the following areas under the standard normal (z) curve.
a) The area under the z curve to the left of 2.53
b) The area under the z curve to the left of -1.33
c) The area under the z curve to the right of 0.76
d) The area under the z curve to the right of -1.47
e) The area under the z curve between -1 and 3
f) The area under the z curve between -2.6 and -1.2
Unlock Deck
Unlock for access to all 57 flashcards in this deck.
Unlock Deck
k this deck
36
One theory of why birds form in flocks is that flocks increase efficiency in scanning
for approaching predators. Because birds can barely move their eyes they must turn
their heads to look for predators, making them temporarily unable to peck for food. If
the birds form flocks, each bird could spend less time scanning; when a single bird
detects a predator it alerts the other birds.
The Chanting Goshawk is a predator of the Red-billed Weaver bird. From field
observation it is estimated that an individual weaver bird has a probability of 0.20 of
detecting a goshawk in time to fly to safety. Suppose that a goshawk suddenly comes
upon a flock of 4 weaver birds pecking for food on the ground, and attacks.
a) What is the probability that none of the weaver birds will detect the goshawk's
presence before it is too late, thus allowing the goshawk to have a weaver bird
lunch?
b) What is the probability that at least one of the weaver birds will detect the
goshawk's presence, thus alerting the others and all fly away, leaving the
goshawk hungry?
c) Suppose this is Wednesday, and all weaver birds form flocks of size 4 on
Wednesdays. Using your results from parts (a) and/or (b), find the probability
that a goshawk will go hungry until swooping down on the 5th flock of 4 weaver
birds seen that day.
for approaching predators. Because birds can barely move their eyes they must turn
their heads to look for predators, making them temporarily unable to peck for food. If
the birds form flocks, each bird could spend less time scanning; when a single bird
detects a predator it alerts the other birds.
The Chanting Goshawk is a predator of the Red-billed Weaver bird. From field
observation it is estimated that an individual weaver bird has a probability of 0.20 of
detecting a goshawk in time to fly to safety. Suppose that a goshawk suddenly comes
upon a flock of 4 weaver birds pecking for food on the ground, and attacks.
a) What is the probability that none of the weaver birds will detect the goshawk's
presence before it is too late, thus allowing the goshawk to have a weaver bird
lunch?
b) What is the probability that at least one of the weaver birds will detect the
goshawk's presence, thus alerting the others and all fly away, leaving the
goshawk hungry?
c) Suppose this is Wednesday, and all weaver birds form flocks of size 4 on
Wednesdays. Using your results from parts (a) and/or (b), find the probability
that a goshawk will go hungry until swooping down on the 5th flock of 4 weaver
birds seen that day.
Unlock Deck
Unlock for access to all 57 flashcards in this deck.
Unlock Deck
k this deck
37
What information about a probability distribution do the mean and standard deviation
of a random variable provide?
of a random variable provide?
Unlock Deck
Unlock for access to all 57 flashcards in this deck.
Unlock Deck
k this deck
38
The density curve for a continuous random variable is shown below. Use this curve
to find the following probabilities:
to find the following probabilities:
Unlock Deck
Unlock for access to all 57 flashcards in this deck.
Unlock Deck
k this deck
39
When driving the nation's highways, Anna is known as something of a lead foot. Her
number of miles per hour over the speed limit varies, but has a mean of 7.5 mph and
standard deviation of 2 mph. Unfortunately her state adjusts the fines so that the
amount of the fine (in dollars) is given by the formula: where F is the amount of the fine, and MilesOver is the number of miles over the
speed limit. Let random variable F be the amount of her fine if she is stopped for
speeding.
a) What is the mean of F?
b) What is the standard deviation of F?
number of miles per hour over the speed limit varies, but has a mean of 7.5 mph and
standard deviation of 2 mph. Unfortunately her state adjusts the fines so that the
amount of the fine (in dollars) is given by the formula:
where F is the amount of the fine, and MilesOver is the number of miles over thespeed limit. Let random variable F be the amount of her fine if she is stopped for
speeding.
a) What is the mean of F?
b) What is the standard deviation of F?
Unlock Deck
Unlock for access to all 57 flashcards in this deck.
Unlock Deck
k this deck
40
New skiers come to learn to ski on the semi-dangerous slopes of Northeastern Iowa.
On Big Bunny Slope skiers will sometimes fail to make the turn at Big Bend. On
Little Bunny Slope, skiers will sometimes tumble at Little Hill. The ski instructors
send a randomly selected group of 25 new skiers down each slope, wait a few
moments, and then send the Ski Patrol Ambulance down after them, stopping at Big
Bend to gather those who don't make the turn and then Little Hill to gather those who
tumble. The skiers descend the slopes far enough apart that they don't run into each
other, so their runs down the slopes are all independent.
a) The probability that a new skier will not make the turn at Big Bend is 0.3. If we
define the random variable B = number of new skiers in a group of 25 needing to
be driven to the First Aid Station from Big Bend, we can model this situation as a
binomial chance experiment. What are the mean and standard deviation of B?
b) The probability that a new skier will tumble at Little Hill is 0.1. If we define the
random variable L = number of new skiers in a group of 25 needing to be driven
to the First Aid Station from Little Hill, we can model this situation as a binomial
chance experiment. What are the mean and standard deviation of L?
c) Consider an instance of the instructors sending one group down Big Bunny Slope,
and one group down Little Bunny Slope. The total number of injuries requiring
the ambulance, T, is the random variable formed by calculating B + L. Using
your results from (a) and (b), calculate the mean and standard deviation of the
random variable T.
d) When the 25 skiers are sent down from the top of Big Bunny Slope, they are sent
one at a time. What is the probability that the first one needing the Ambulance is
the 7th one to be sent down the slope?
Unlock Deck
Unlock for access to all 57 flashcards in this deck.
Unlock Deck
k this deck
41
Unlock Deck
Unlock for access to all 57 flashcards in this deck.
Unlock Deck
k this deck
42
In a study performed by the statistics classes at Jefferson High School, city parking
spaces were examined for compliance with the requirement to put money in the
parking meters. Overall, the students found that 80% of metered parking places had
meters that were not expired, and 20% had meters that were expired. If the traffic
officer in charge of ticketing checks meters at random, what is the probability he or
she will find an expired meter before the 3rd one checked?
Unlock Deck
Unlock for access to all 57 flashcards in this deck.
Unlock Deck
k this deck
43
For a variable that has a standard normal distribution,
Unlock Deck
Unlock for access to all 57 flashcards in this deck.
Unlock Deck
k this deck
44
In a study performed by the statistics classes at Washington High School, city parking
spaces were examined for compliance with the requirement to put money in the
parking meters. Overall, the students found that 76% of metered parking places had
meters that were not expired, and 24% had meters that were expired. If the traffic
officer in charge of ticketing checks meters at random, what is the probability he or
she will find an expired meter before the 3rd one checked?
Unlock Deck
Unlock for access to all 57 flashcards in this deck.
Unlock Deck
k this deck
45
The Department of Transportation (D.O.T.) in a very large city has organized a new
system of bus transportation. In an advertising campaign, citizens are encouraged to
use the new "GO-D.O.T!" system. Suppose that at one of the bus stops the length of
time (in minutes) that a commuter must wait for a bus is a uniformly distributed
random variable, T. The possible values of T are from 0 minutes to 20 minutes.
system of bus transportation. In an advertising campaign, citizens are encouraged to
use the new "GO-D.O.T!" system. Suppose that at one of the bus stops the length of
time (in minutes) that a commuter must wait for a bus is a uniformly distributed
random variable, T. The possible values of T are from 0 minutes to 20 minutes.
Unlock Deck
Unlock for access to all 57 flashcards in this deck.
Unlock Deck
k this deck
46
In a study of left- and right-handers' reaction times to tones delivered to the right ear,
the left-handers' reaction times were approximately normally distributed with a mean
of 240 milliseconds and standard deviation of 32 milliseconds. The mean reaction
time for right-handers was 210 ms.
a) Sketch a normal distribution that describes left-handers' reaction times, and
locate the mean reaction time for right-handers in this distribution.
b) About what proportion of left-handers reaction times would be "better" (that is,
smaller) than the mean reaction time for right-handers?
Unlock Deck
Unlock for access to all 57 flashcards in this deck.
Unlock Deck
k this deck
47
The Department of Transportation (D.O.T.) in a very large city has organized a new
system of bus transportation. In an advertising campaign, citizens are encouraged to
use the new "GO-D.O.T!" system. Suppose that at one of the bus stops the length of
time (in minutes) that a commuter must wait for a bus is a uniformly distributed
random variable, T. The possible values of T are from 0 minutes to 20 minutes.
a) Sketch the probability distribution of T.
b) What is the probability that a randomly selected commuter will spend more than 7
minutes waiting for GO-D.O.T?
Unlock Deck
Unlock for access to all 57 flashcards in this deck.
Unlock Deck
k this deck
48
At the last home football game of the season, the senior football players walk through
a specially constructed welcoming arch, 2 abreast. The arch is 50" wide. It is
considered unseemly to bump each other on the way through, so the arch must be
wide enough for two players to go through. The distribution of widths of football
players with shoulder pads is approximately normal with a mean of 30 inches, and the
standard deviation is 5 inches. Let random variable w = width in inches of a
randomly selected padded football player.
a specially constructed welcoming arch, 2 abreast. The arch is 50" wide. It is
considered unseemly to bump each other on the way through, so the arch must be
wide enough for two players to go through. The distribution of widths of football
players with shoulder pads is approximately normal with a mean of 30 inches, and the
standard deviation is 5 inches. Let random variable w = width in inches of a
randomly selected padded football player.
Unlock Deck
Unlock for access to all 57 flashcards in this deck.
Unlock Deck
k this deck
49
For a variable z that has a standard normal distribution,
Unlock Deck
Unlock for access to all 57 flashcards in this deck.
Unlock Deck
k this deck
50
The time that it takes a randomly selected employee to perform a certain task is
approximately normally distributed with a mean value of 120 seconds and a standard
deviation of 20 seconds. The slowest 10% (that is, the 10% with the longest times)
are to be given remedial training. What times qualify for the remedial training?
approximately normally distributed with a mean value of 120 seconds and a standard
deviation of 20 seconds. The slowest 10% (that is, the 10% with the longest times)
are to be given remedial training. What times qualify for the remedial training?
Unlock Deck
Unlock for access to all 57 flashcards in this deck.
Unlock Deck
k this deck
51
A marketer of holiday fruit boxes has a new order for boxes that will hold 12 pieces of
fruit. The box is to hold 4 rows of fruit, each row consisting of an orange and two
apples. In addition to the fruit there will need to be protective packing lining the
box. The mean diameter of oranges is 3.0 inches and the standard deviation is 0.25
inches. The mean diameter of apples is 4.0 inches and the standard deviation is 0.2
inches.
fruit. The box is to hold 4 rows of fruit, each row consisting of an orange and two
apples. In addition to the fruit there will need to be protective packing lining the
box. The mean diameter of oranges is 3.0 inches and the standard deviation is 0.25
inches. The mean diameter of apples is 4.0 inches and the standard deviation is 0.2
inches.
Unlock Deck
Unlock for access to all 57 flashcards in this deck.
Unlock Deck
k this deck
52
In a study of left- and right-handers' reaction times to tones delivered to the right ear,
the right-handers' reaction times were approximately normally distributed with a
mean of 210 milliseconds and standard deviation of 40 milliseconds. The mean
reaction time for left-handers was 240 ms.
a) Sketch a normal distribution that describes right-handers' reaction times, and
locate the mean reaction time for left-handers in this distribution.
b) What proportion of right-handers reaction times would be faster than the mean
reaction time for left-handers?
Unlock Deck
Unlock for access to all 57 flashcards in this deck.
Unlock Deck
k this deck
53
Professor Mean is planning the big Statistics Department Super Bowl party.
Statisticians take pride in their variability, and it is not certain what kinds of chips
people will choose. Professor Mean takes a 4-sided die to the grocery store, starts at
one end of the chips aisle, and travels to the other end. For each different kind of
chip, Dr. Mean rolls the die. If it comes up a 4, she purchases a bag of those chips for
the party. There are 40 different kinds of chips in the aisle. Define random variable
x number of types of chips purchased out of the 40 types available.
a) Random variable x is a binomial random variable. What is the mean of the
random variable x?
b) What is the standard deviation of the random variable x?
Unlock Deck
Unlock for access to all 57 flashcards in this deck.
Unlock Deck
k this deck
54
Electric power cords are a common hazard in households with computers. They are
easily tripped over and the delicate computer equipment may be pulled from tables
and damaged. A new "breakaway" power cord has been designed by Alpha
Enterprises. A lpha has determined that a breakaway force of between 3.0 and 5.0
pounds is appropriate. (If the force is too low the cord would break in normal use; if
the force is too high the cord would not be effective.) Alpha can order cord material
from two companies, Beta and Gamma. The breakaway force for the Beta material
is approximately normally distributed with a mean of 4.5 pounds and a standard
deviation of 1.0 pounds. The breakaway force for the Gamma material is
approximately normally distributed with a mean of 4.0 pounds and a standard
deviation of 1.5 pounds.
Alpha will choose the cord material that has the higher probability of breaking within
the specified 3.0 and 5.0 pound limits. From which company should Alpha order
cord material? Provide appropriate statistical justification for your choice.
Unlock Deck
Unlock for access to all 57 flashcards in this deck.
Unlock Deck
k this deck
55
Fifty-five percent of the lunches at a very large high school are purchased using
"lunch cards" rather than cash. Assume that the method of payment (cash or lunch
card) for one student is independent of the method of payment for the next student in
line. What is the probability of observing the following sequence of purchase
methods for the first five students through the lunch line?
Cash, Card, Cash, Card, Cash
Unlock Deck
Unlock for access to all 57 flashcards in this deck.
Unlock Deck
k this deck
56
Unlock Deck
Unlock for access to all 57 flashcards in this deck.
Unlock Deck
k this deck
57
Inspecting meat is a very important part of the process of ensuring healthy food. So
that meat inspectors do not fall into a pattern of inspection, they use a 4-sided die to
decide whether or not to sample the meat from a particular "side" of beef. The meat
inspector rolls the die and if it comes up a 4, a sample is taken of that meat. Define
random variable x number of samples inspected in a meat locker with 30 sides of
beef.
a) What is the mean of the random variable x?
b) What is the standard deviation of the random variable x?
Unlock Deck
Unlock for access to all 57 flashcards in this deck.
Unlock Deck
k this deck
Unlock Deck
Unlock for access to all 57 flashcards in this deck.


