Deck 9: Process Improvement and Six Sigma
Full screen (f)
Question
Question
Question
Question
Question
The Janson Medical Clinic recently conducted a patient satisfaction survey of 100 patients. Using a scale of 1-5, with 1 being "very dissatisfied" and 5 being "very satisfied," the clinic compiled a check sheet for responses that were either 1 or 2, indicating dissatisfaction with the performance attributes. This check sheet is shown in Table 9.6.
Doctors have extremely busy schedules. They have surgeries to perform, and many are teaching faculty at the local medical school. Many surgeries are emergencies or take longer than expected, resulting in delays in getting back to the clinic.
In the clinic, one or two telephone receptionists answer calls for three different departments, which include 20 or more doctors. Their job is basically to schedule appointments, provide directions, and transfer calls to the proper secretaries, which generally requires putting the patient on hold. Often, the receptionist must take a handwritten message and personally deliver it to the secretary because the secretary's phone line is busy. However, the receptionist cannot leave her desk without someone else to cover the phones.
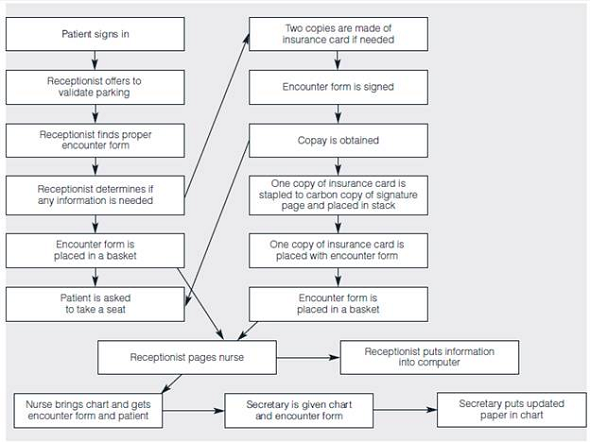
A student intern examined the processes for answering phone calls and registering patients. The flowcharts she developed are shown in Figures 9.28 and 9.29.
TABLE 9.6 Check Sheet of Dissatisfied Responses

FIGURE 9.28 Current Process for Answering Phone Calls
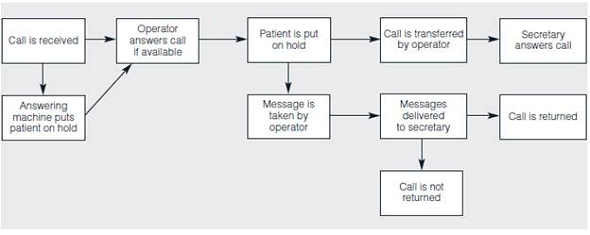
FIGURE 9.29 Current Patient Registration Process
Construct a Pareto diagram for the causes of dissatisfaction. What conclusions do you reach?
Doctors have extremely busy schedules. They have surgeries to perform, and many are teaching faculty at the local medical school. Many surgeries are emergencies or take longer than expected, resulting in delays in getting back to the clinic.
In the clinic, one or two telephone receptionists answer calls for three different departments, which include 20 or more doctors. Their job is basically to schedule appointments, provide directions, and transfer calls to the proper secretaries, which generally requires putting the patient on hold. Often, the receptionist must take a handwritten message and personally deliver it to the secretary because the secretary's phone line is busy. However, the receptionist cannot leave her desk without someone else to cover the phones.
A student intern examined the processes for answering phone calls and registering patients. The flowcharts she developed are shown in Figures 9.28 and 9.29.
TABLE 9.6 Check Sheet of Dissatisfied Responses
FIGURE 9.28 Current Process for Answering Phone Calls
FIGURE 9.29 Current Patient Registration Process
Construct a Pareto diagram for the causes of dissatisfaction. What conclusions do you reach?
Question
Question
Question
Question
Question
Question
Question
Question
Question
Question
Question
Question
Question
Question
Question
Question
Question
Question
Question
Question
Question
Question
Question
Question
Question
Question
Question
Question
Question
Question
Question
Question
Question
Question
Question
Question
Question
Question
Question
Question
Question
Question
Question
Question
Question
Question
Question
Question
Question
Question
Question
Question
Question
Question
Question
Question
Question
Question

Unlock Deck
Sign up to unlock the cards in this deck!
Unlock Deck
Unlock Deck
1/63
Play
Full screen (f)
Deck 9: Process Improvement and Six Sigma
1
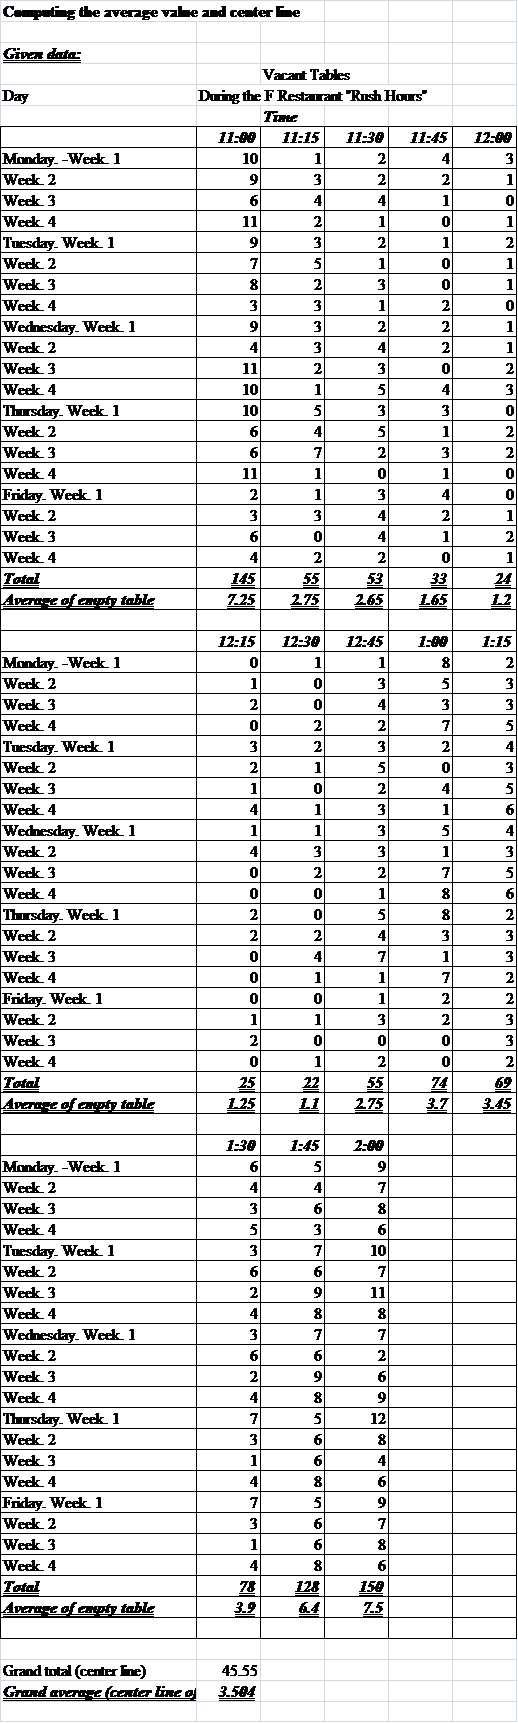
Fred Read, the owner of the Freadilunch (pronounced Freddylunch) Restaurant, a suburban, quick service restaurant, was concerned about the loss of several regular customers. He measured the number of empty lunch tables from 11 A.M. until 2 P.M. over a four-week period. To better understand the reasons for the loss of customers, long lines, and dissatisfied patrons, Fred talked to several regular customers. He found that they liked the food and atmosphere of the restaurant, but felt that there were opportunities for improvement based on the lack of capability to quickly handle takeout orders (they had to be phoned in, not faxed), excessive time spent waiting for tables, inefficient service, surly waiters on certain days, and long lines at the cash register. He puzzled over how to sort out possible causes that led to these perceived problems. Fred also decided to design a check sheet to systematically gather data and determine which of these problems were the most significant. (Data for the check sheet information gathered for "Vacant Tables" and for "Customer Concerns" can be found in the Freadilunch 1 and Freadilunch 2 tabs in the Excel workbook C09Data.xlsx on the Student Companion Site.)
Plot the average number of empty tables on a run chart, computing the average value (center line), but ignoring the control limits. What do these data show?
Plot the average number of empty tables on a run chart, computing the average value (center line), but ignoring the control limits. What do these data show?
Excel showing calculation of average value (center-line) from given data:
 The scatter diagram showing the average empty tables by time:
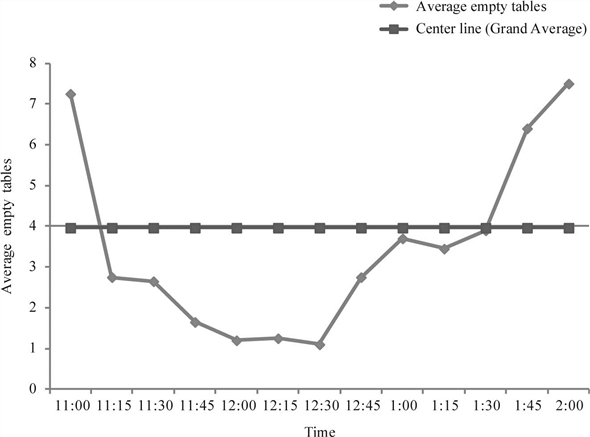 The given data shows the grand average value of
 . The scatter diagram shows that the utilization of tables is the highest from 11:45 - 12:30.
The scatter diagram showing the average empty tables by time: The given data shows the grand average value of . The scatter diagram shows that the utilization of tables is the highest from 11:45 - 12:30. 2
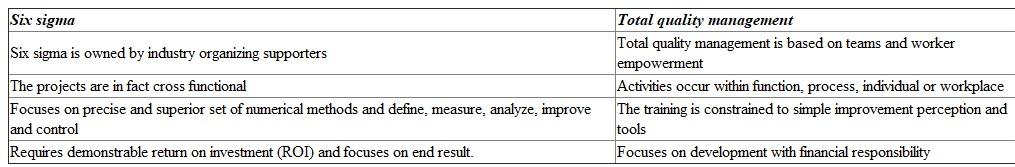
List the key principles of the Six Sigma philosophy. How does it differ from TQM?
Principles of six sigma philosophy:
• Believe in terms of main business procedures and requirement of customers with clear attention on overall planned objectives.
• The organization must set bigger objectives so that they can improve themselves.
• Firm must focus on business supporters who are responsible for winning projects, support the activities of team and helps to defeat confrontation to change and acquire resources.
• Produce extremely competent process improvement experts who can apply enhancement tools and lead teams.
• Ensuring appropriate metrics identified in previous process which has focus on business results which therefore offers incentives.
• Providing widespread training tracked by project team deployment to maximize profits, reduce non-value added actions and achieves the reduction of cycle time.• Highlighting experimental measures which can be applied to all parts of organization.
Contrasting features between six sigma and total quality management:
3
The Six Sigma philosophy seeks to develop technical leadership through "Belt" training, then use it in team-based projects designed to improve processes. To what extent are these two concepts (technical experts versus team experts) at odds? What must be done to prevent them from blocking success in improvement projects?
Methods to prevent them from blocking success:
The skills of technical experts will complement those of team members.
If both (technical and team experts) do not agree the following then these concepts will be in different sides-
• Ways to analyze problems
• How to implement improvements
• Hold the gains through proper control techniques
To prevent them from clashing, they can follow the given methods-
• Every employee should get training
• Orientation to the environmental factors
• Methods and concepts used by other employees or companies
• Project champion has to find out disputes and resolve in such a way as to enhance project success.
4
State the typical elements that make up a project charter.
Unlock Deck
Unlock for access to all 63 flashcards in this deck.
Unlock Deck
k this deck
5
The Janson Medical Clinic recently conducted a patient satisfaction survey of 100 patients. Using a scale of 1-5, with 1 being "very dissatisfied" and 5 being "very satisfied," the clinic compiled a check sheet for responses that were either 1 or 2, indicating dissatisfaction with the performance attributes. This check sheet is shown in Table 9.6.
Doctors have extremely busy schedules. They have surgeries to perform, and many are teaching faculty at the local medical school. Many surgeries are emergencies or take longer than expected, resulting in delays in getting back to the clinic.
In the clinic, one or two telephone receptionists answer calls for three different departments, which include 20 or more doctors. Their job is basically to schedule appointments, provide directions, and transfer calls to the proper secretaries, which generally requires putting the patient on hold. Often, the receptionist must take a handwritten message and personally deliver it to the secretary because the secretary's phone line is busy. However, the receptionist cannot leave her desk without someone else to cover the phones.
A student intern examined the processes for answering phone calls and registering patients. The flowcharts she developed are shown in Figures 9.28 and 9.29.
TABLE 9.6 Check Sheet of Dissatisfied Responses
FIGURE 9.28 Current Process for Answering Phone Calls
FIGURE 9.29 Current Patient Registration Process
Construct a Pareto diagram for the causes of dissatisfaction. What conclusions do you reach?
Unlock Deck
Unlock for access to all 63 flashcards in this deck.
Unlock Deck
k this deck
6
List some of the common processes that a student performs. How can these processes be improved using a process improvement approach?
Unlock Deck
Unlock for access to all 63 flashcards in this deck.
Unlock Deck
k this deck
7
Note: Data sets for many problems in this chapter are available in the Excel workbook C09Data.xlsx on the Student Companion Site. Click the appropriate worksheet tab as noted in the problem ( e.g. Prob. 9-12, etc.) to access the data. We also recommend using the ASQ Learn about Quality Excel templates noted in this chapter to facilitate your solutions to appropriate problems.
Placewrite, Inc., an independent outplacement service, helps unemployed executives find jobs. One of the major activities of the service is pre paring resumes. Three word processors work at the service typing resumes and cover letters. Together they handle about 120 individual clients.
Turnaround time for typing is expected to be 24 hours. The word-processing operation begins with clients placing work in the assigned word processor's bin. When the word processor picks up the work (in batches), it is logged in using a time clock stamp, and the work is typed and printed. After the batch is completed, the word processor returns the work to the clients' bin, logs in the time delivered, and picks up new work. A supervisor tries to balance the workload for the three word processors. Lately, many of the clients have been complaining about errors in their documents-misspellings, missing lines, wrong formatting, and so on. The supervisor has told the word processors to be more careful, but the errors still persist.
a. Develop a cause-and-effect diagram that might clarify the source of errors.
b. What tools might the supervisor use to study ways to reduce the number of errors?
Unlock Deck
Unlock for access to all 63 flashcards in this deck.
Unlock Deck
k this deck
8
Note: Data sets for many problems in this chapter are available in the Excel workbook C09Data.xlsx on the Student Companion Site. Click the appropriate worksheet tab as noted in the problem ( e.g. Prob. 9-12, etc.) to access the data. We also recommend using the ASQ Learn about Quality Excel templates noted in this chapter to facilitate your solutions to appropriate problems.
A process at Printwright, Inc.'s largest facility is used to make plastic gears for a computer printer. The data found in the worksheet Prob. 9-15 were gathered by a quality analyst. The gears were designed to be 3.57 ± 0.05 centimeters (cm) in diameter. Construct a histogram of the data. What can you observe about the shape of the distribution? What would you recommend to the production manager based on your analysis?
A process at Printwright, Inc.'s largest facility is used to make plastic gears for a computer printer. The data found in the worksheet Prob. 9-15 were gathered by a quality analyst. The gears were designed to be 3.57 ± 0.05 centimeters (cm) in diameter. Construct a histogram of the data. What can you observe about the shape of the distribution? What would you recommend to the production manager based on your analysis?
Unlock Deck
Unlock for access to all 63 flashcards in this deck.
Unlock Deck
k this deck
9
Note: Data sets for many problems in this chapter are available in the Excel workbook C09Data.xlsx on the Student Companion Site. Click the appropriate worksheet tab as noted in the problem ( e.g. Prob. 9-12, etc.) to access the data. We also recommend using the ASQ Learn about Quality Excel templates noted in this chapter to facilitate your solutions to appropriate problems.
Neverflounder Fish Company advertises that 98.7 percent of their fish were caught within the past 36 hours and that all of their products are 100 percent fresh. How many dpmo does this claim represent? At what sigma level is this process operating?
Neverflounder Fish Company advertises that 98.7 percent of their fish were caught within the past 36 hours and that all of their products are 100 percent fresh. How many dpmo does this claim represent? At what sigma level is this process operating?
Unlock Deck
Unlock for access to all 63 flashcards in this deck.
Unlock Deck
k this deck
10
Nanospark Electronics manufactures 100,000 circuit boards per month. A random sample of 1,000 boards is inspected every week for three characteristics. During a recent week, three defects were found for one characteristic, and one defect each was found for the other two characteristics. If these inspections produced defect counts that were representative of the population, what is the overall sigma level for this process? What is the sigma level for the characteristic that showed three defects?
Unlock Deck
Unlock for access to all 63 flashcards in this deck.
Unlock Deck
k this deck
11
Explain the knowledge and management expertise that Green Belts, Black Belts, and Master Black Belts should have?
Unlock Deck
Unlock for access to all 63 flashcards in this deck.
Unlock Deck
k this deck
12
What is an operational definition? Why is it important?
Unlock Deck
Unlock for access to all 63 flashcards in this deck.
Unlock Deck
k this deck
13
Three popular websites for Six Sigma are http://www.ge.com/sixsigma, http://www.isixsigma.com, and http://asq.org/sixsigma. Explore these sites and consider the following questions.
a. How does GE use Six Sigma to enhance customer perception of its products and services?
b. What is the apparent purpose of the isixsigma website?
c. Who are the customers of the sixsigmaforum website?
d. Do the three websites reach basic agreement about the concept of Six Sigma? How do they differ?
Unlock Deck
Unlock for access to all 63 flashcards in this deck.
Unlock Deck
k this deck
14
In small teams, develop cause-and-effect diagrams for the following problems:
a. Poor exam grade
b. No job offers
c. Late for work or school
a. Poor exam grade
b. No job offers
c. Late for work or school
Unlock Deck
Unlock for access to all 63 flashcards in this deck.
Unlock Deck
k this deck
15
How might a Six Sigma project be done to improve a registration process in a university? An admission process?
Unlock Deck
Unlock for access to all 63 flashcards in this deck.
Unlock Deck
k this deck
16
Note: Data sets for many problems in this chapter are available in the Excel workbook C09Data.xlsx on the Student Companion Site. Click the appropriate worksheet tab as noted in the problem ( e.g. Prob. 9-12, etc.) to access the data. We also recommend using the ASQ Learn about Quality Excel templates noted in this chapter to facilitate your solutions to appropriate problems.
Deuce Printing Company realized that they were losing customers and orders due to various delays and errors. In order to get to the root cause of the problem, they decided to track problems that might be contributing to customer dissatisfaction. The list of the problems provided in worksheet Prob. 9-16 shows their frequencies of occurrence over a six-month period. What technique might you use to graphically show the causes of customer dissatisfaction? What recommendations could you make to reduce errors and increase customer satisfaction?
Deuce Printing Company realized that they were losing customers and orders due to various delays and errors. In order to get to the root cause of the problem, they decided to track problems that might be contributing to customer dissatisfaction. The list of the problems provided in worksheet Prob. 9-16 shows their frequencies of occurrence over a six-month period. What technique might you use to graphically show the causes of customer dissatisfaction? What recommendations could you make to reduce errors and increase customer satisfaction?
Unlock Deck
Unlock for access to all 63 flashcards in this deck.
Unlock Deck
k this deck
17
Explain the four themes that different improvement methodologies share. How are they reflected in the Deming cycle, creative problem-solving process, and DMAIC?
Unlock Deck
Unlock for access to all 63 flashcards in this deck.
Unlock Deck
k this deck
18
Explain the theoretical basis for the six-sigma 3.4 dpmo measure. How does it relate to process capability concepts?
Unlock Deck
Unlock for access to all 63 flashcards in this deck.
Unlock Deck
k this deck
19
Note: Data sets for many problems in this chapter are available in the Excel workbook C09Data.xlsx on the Student Companion Site. Click the appropriate worksheet tab as noted in the problem ( e.g. Prob. 9-12, etc.) to access the data. We also recommend using the ASQ Learn about Quality Excel templates noted in this chapter to facilitate your solutions to appropriate problems.
The maintenance of products such as aircraft engines is part of a complex supply chain. Distribution centers fulfill orders for spare parts to customers around the world and typically run on a 24/7 basis. Each day, as many as 4,000 different SKUs are shipped out and over 1,000 SKUs are received in inventory. It is critical that each order be 100 percent accurate. For example, orders that don't match the shipping list are returned to the distribution center because of customs regulations.
a. If the distribution center has identified inaccurate shipments as a significant problem, explain how the DMAIC process might be applied.
b. Develop a logical cause-and-effect diagram for the problem "inaccurate shipment."
c. Think about how a process for fulfilling orders might work and create a process map (you might want to refer back to process design concepts in Chapter 7).
Unlock Deck
Unlock for access to all 63 flashcards in this deck.
Unlock Deck
k this deck
20
Explain different types of check sheets and how they are used.
Unlock Deck
Unlock for access to all 63 flashcards in this deck.
Unlock Deck
k this deck
21
Some of the key processes associated with business activities for a typical company include sales and marketing, supply chain management, managing information technology, and managing human resources. What types of Six Sigma projects might be considered in order to improve each of these activities?
Unlock Deck
Unlock for access to all 63 flashcards in this deck.
Unlock Deck
k this deck
22
Discuss how DMAIC might be used in your personal life. For example, how could you use it if you wanted to lose weight or improve a skill such as playing a musical instrument?
Unlock Deck
Unlock for access to all 63 flashcards in this deck.
Unlock Deck
k this deck
23
Discuss factors that should be considered when selecting Six Sigma projects.
Unlock Deck
Unlock for access to all 63 flashcards in this deck.
Unlock Deck
k this deck
24
Note: Data sets for many problems in this chapter are available in the Excel workbook C09Data.xlsx on the Student Companion Site. Click the appropriate worksheet tab as noted in the problem ( e.g. Prob. 9-12, etc.) to access the data. We also recommend using the ASQ Learn about Quality Excel templates noted in this chapter to facilitate your solutions to appropriate problems.
In a DeltaWidgets, Inc. process, the production rate (parts/hour) was thought to affect the number of defectives found during a subsequent inspection. To test this theory, the production rate was varied and the numbers of defects were collected for the same batch sizes. The results can be found in the worksheet Prob. 9-17. Construct a scatter diagram for these data. What conclusions can you reach?
In a DeltaWidgets, Inc. process, the production rate (parts/hour) was thought to affect the number of defectives found during a subsequent inspection. To test this theory, the production rate was varied and the numbers of defects were collected for the same batch sizes. The results can be found in the worksheet Prob. 9-17. Construct a scatter diagram for these data. What conclusions can you reach?
Unlock Deck
Unlock for access to all 63 flashcards in this deck.
Unlock Deck
k this deck
25
Neverflounder Fish Company advertises that 98.7 percent of their fish were caught within the past 36 hours and that all of their products are 100 percent fresh. How many dpmo does this claim represent? At what sigma level is this process operating?
Unlock Deck
Unlock for access to all 63 flashcards in this deck.
Unlock Deck
k this deck
26
Note: Data sets for many problems in this chapter are available in the Excel workbook C09Data.xlsx on the Student Companion Site. Click the appropriate worksheet tab as noted in the problem ( e.g. Prob. 9-12, etc.) to access the data. We also recommend using the ASQ Learn about Quality Excel templates noted in this chapter to facilitate your solutions to appropriate problems.
Verasource Microprocessor Corporation (VMC) sells 2,000 specialized microprocessor chips each month at a price of $1,500 each. Variable costs amount to $1,500,000, and fixed costs are $500,000. Currently the company has a defect rate of 8 percent (which are chips returned by customers, scrapped by VMC, and replaced). Note that the variable costs include the cost of producing the defective chips.
a. What is the hidden cost to the company of making this rate of defectives instead of 2,000 good chips each month?
b. Suppose a Six Sigma effort can reduce the defects to a six-sigma level (assume for simplicity that the defective rate is essentially zero). What is the impact on profitability?
Unlock Deck
Unlock for access to all 63 flashcards in this deck.
Unlock Deck
k this deck
27
How can a manager effectively balance the key components of a Six Sigma implementation design related to who, what, where, when, why, and how it could be done?
Unlock Deck
Unlock for access to all 63 flashcards in this deck.
Unlock Deck
k this deck
28
What is a value stream map and how does it differ from an ordinary flowchart?
Unlock Deck
Unlock for access to all 63 flashcards in this deck.
Unlock Deck
k this deck
29
Identify an important problem around your school or in some related function, such as a student organization, and apply the DMAIC process to develop an improved solution. Use whatever process improvement tools are appropriate.
Unlock Deck
Unlock for access to all 63 flashcards in this deck.
Unlock Deck
k this deck
30
Search the Internet for websites that contain descriptions and examples of quality improvement methodologies. How do they compare with the ones described in this chapter?
Unlock Deck
Unlock for access to all 63 flashcards in this deck.
Unlock Deck
k this deck
31
Note: Data sets for many problems in this chapter are available in the Excel workbook C09Data.xlsx on the Student Companion Site. Click the appropriate worksheet tab as noted in the problem ( e.g. Prob. 9-12, etc.) to access the data. We also recommend using the ASQ Learn about Quality Excel templates noted in this chapter to facilitate your solutions to appropriate problems.
A catalog order-filling process at Cats Catalog Company for personalized printed products for pet owners can be described as follows: 53 Telephone orders are taken over a 12-hour period each day. Orders are collected from each person at the end of the day and checked for errors by the supervisor of the phone department, usually the following morning. The supervisor does not send each one-day batch of orders to the data processing department until after 1:00 P.M. In the next step-data processing-orders are invoiced in the one-day batches. Then they are printed and matched back to the original orders. At this point, if the order is from a new customer, it is sent to the person who did the customer verification and setup of new customer accounts. This process must be completed before the order can be invoiced. The next step-order verification and proofreading-occurs after invoicing is completed. The orders, with invoices attached, are given to a person who verifies that all required information is present and correct to permit typesetting. If the verifier has any questions, they are checked by computer or by calling the customer. Finally, the completed orders are sent to the typesetting department of the print shop.
a. Develop a flowchart for this process.
b. Identify opportunities for improving the quality of service in this situation.
Unlock Deck
Unlock for access to all 63 flashcards in this deck.
Unlock Deck
k this deck
32
Note: Data sets for many problems in this chapter are available in the Excel workbook C09Data.xlsx on the Student Companion Site. Click the appropriate worksheet tab as noted in the problem ( e.g. Prob. 9-12, etc.) to access the data. We also recommend using the ASQ Learn about Quality Excel templates noted in this chapter to facilitate your solutions to appropriate problems.
The number of defects found in 25 samples of 100 Malossdientes Candy Company lemon drops taken on a daily basis from a production line over a five-week period is given in the worksheet Prob. 9-18.
a. Compute dpmo and find the sigma level.
b. Plot these data on a run chart. Can you identify any special causes?
c. Plot the data on the appropriate control chart. Does this confirm your answer to part (b) or does it provide better information?
Unlock Deck
Unlock for access to all 63 flashcards in this deck.
Unlock Deck
k this deck
33
Explain the steps of the Deming cycle.
Unlock Deck
Unlock for access to all 63 flashcards in this deck.
Unlock Deck
k this deck
34
What is Kepner and Tregoe's definition of a problem?
Unlock Deck
Unlock for access to all 63 flashcards in this deck.
Unlock Deck
k this deck
35
Explain the structure and purpose of the A3 Report that Toyota created. How does it support the DMAIC process?
Unlock Deck
Unlock for access to all 63 flashcards in this deck.
Unlock Deck
k this deck
36
What is root cause analysis? Describe some tools that are useful in identifying a root cause.
Unlock Deck
Unlock for access to all 63 flashcards in this deck.
Unlock Deck
k this deck
37
Suggest a set of CTQs that might influence overall service satisfaction for service at an automobile dealership.
Unlock Deck
Unlock for access to all 63 flashcards in this deck.
Unlock Deck
k this deck
38
Discuss what would be the most appropriate tool to use to attack each of these problems:
a. A copy machine suffers frequent paper jams and users are often confused as to how to fix the problem.
b. The publication team for an engineering department wants to improve the accuracy of its user documentation but is unsure of why documents aren't error-free.
c. A rental car agency is getting numerous complaints about the length of time that customers have to wait to obtain a car. They need to get a better handle on the factors that relate to the wait time.
d. A kitchen in a restaurant always seems to be getting orders mixed up and plated incorrectly.
e. A local zoo wants to understand where its guests come from in order to better target marketing efforts.
f. A contracting agency wants to investigate why they had so many changes in their contracts. They believe that the number of changes may be related to the dollar value of the original contract or the days between the request for proposal and the contract award.
g. A travel agency is interested in gaining a better understanding of how call volume varies by time of year in order to adjust staffing schedules.
Unlock Deck
Unlock for access to all 63 flashcards in this deck.
Unlock Deck
k this deck
39
In 1995, Jack Welch, who was then CEO of General Electric, sent a memo to his senior managers telling them that they would have to require every employee to have started Six Sigma training to be promoted. Furthermore, 40 percent of the managers' bonuses were to be tied to the successful introduction of Six Sigma. Do you believe that this directive was a motivational action, or did it violate W. Edwards Deming's maxim that managers and leaders must "cast out fear"? Why or why not?
Unlock Deck
Unlock for access to all 63 flashcards in this deck.
Unlock Deck
k this deck
40
Note: Data sets for many problems in this chapter are available in the Excel workbook C09Data.xlsx on the Student Companion Site. Click the appropriate worksheet tab as noted in the problem ( e.g. Prob. 9-12, etc.) to access the data. We also recommend using the ASQ Learn about Quality Excel templates noted in this chapter to facilitate your solutions to appropriate problems.
Analysis of customer complaints at the Lauren Elizabeth Apparel Company revealed errors in five categories, such as billing, shipping, etc. Data can be found in the worksheet Prob. 9-19. Construct a Pareto diagram for these data. What conclusions can you reach?
Analysis of customer complaints at the Lauren Elizabeth Apparel Company revealed errors in five categories, such as billing, shipping, etc. Data can be found in the worksheet Prob. 9-19. Construct a Pareto diagram for these data. What conclusions can you reach?
Unlock Deck
Unlock for access to all 63 flashcards in this deck.
Unlock Deck
k this deck
41
During one month, MegaInvCo (MIC) processed 51,000 invoices for Alpha Corp, 49,000 for Beta Corp, and 25,000 for Gamma Corp. Of these, 510 of the Alpha, 525 of the Beta, and 480 of the Gamma invoices had to be reprocessed for errors. What is the overall defect rate and the sigma level for all of the combined batches? For each individual batch?
Unlock Deck
Unlock for access to all 63 flashcards in this deck.
Unlock Deck
k this deck
42
A flowchart for a fast-food drive-through window is shown in Figure 9.25. Determine the important quality characteristics inherent in this process and suggest possible improvements.
Unlock Deck
Unlock for access to all 63 flashcards in this deck.
Unlock Deck
k this deck
43
Note: Data sets for many problems in this chapter are available in the Excel workbook C09Data.xlsx on the Student Companion Site. Click the appropriate worksheet tab as noted in the problem ( e.g. Prob. 9-12, etc.) to access the data. We also recommend using the ASQ Learn about Quality Excel templates noted in this chapter to facilitate your solutions to appropriate problems.
A Six Sigma analyst at Lakerio United Bank suspected that errors in counting and manually strapping cash into bundles were related to the number of weeks that employees had been employed on that job. The data available in the worksheet Prob. 9-12 were gathered from the process. What do you conclude from your analysis? What do you recommend?
A Six Sigma analyst at Lakerio United Bank suspected that errors in counting and manually strapping cash into bundles were related to the number of weeks that employees had been employed on that job. The data available in the worksheet Prob. 9-12 were gathered from the process. What do you conclude from your analysis? What do you recommend?
Unlock Deck
Unlock for access to all 63 flashcards in this deck.
Unlock Deck
k this deck
44
Why is brainstorming an important tool in the Improvement phase of DMAIC?
Unlock Deck
Unlock for access to all 63 flashcards in this deck.
Unlock Deck
k this deck
45
Find a local company that is using Six Sigma or lean principles. Write a case study of their experiences, focusing on the challenges they faced during their implementation efforts.
Unlock Deck
Unlock for access to all 63 flashcards in this deck.
Unlock Deck
k this deck
46
Work with teachers at a local high school or grade school to identify some students who are having difficulties in school. Apply quality tools to help find the source of the problems and create an improvement plan.
Unlock Deck
Unlock for access to all 63 flashcards in this deck.
Unlock Deck
k this deck
47
Explain the concept of Pareto analysis. How is a Pareto distribution created?
Unlock Deck
Unlock for access to all 63 flashcards in this deck.
Unlock Deck
k this deck
48
Note: Data sets for many problems in this chapter are available in the Excel workbook C09Data.xlsx on the Student Companion Site. Click the appropriate worksheet tab as noted in the problem ( e.g. Prob. 9-12, etc.) to access the data. We also recommend using the ASQ Learn about Quality Excel templates noted in this chapter to facilitate your solutions to appropriate problems.
The Cabo Fiesta Mexican Restaurant is trying to determine whether sales of its popular Pan Con Mucho Sabor breadsticks are correlated with the sales of margaritas. It has data on sales of bread-stick baskets and margaritas for 25 weeks, shown in the worksheet Prob. 9-20. Plot a scatter diagram and compute the correlation using Excel tools. What do your results indicate?
The Cabo Fiesta Mexican Restaurant is trying to determine whether sales of its popular Pan Con Mucho Sabor breadsticks are correlated with the sales of margaritas. It has data on sales of bread-stick baskets and margaritas for 25 weeks, shown in the worksheet Prob. 9-20. Plot a scatter diagram and compute the correlation using Excel tools. What do your results indicate?
Unlock Deck
Unlock for access to all 63 flashcards in this deck.
Unlock Deck
k this deck
49
What is Six Sigma? Briefly outline its history at Motorola and General Electric.
Unlock Deck
Unlock for access to all 63 flashcards in this deck.
Unlock Deck
k this deck
50
List and explain the five categories into which all quality problem solving can be classified. Provide some quality-related examples in each category.
Unlock Deck
Unlock for access to all 63 flashcards in this deck.
Unlock Deck
k this deck
51
A consultant told the story of two Six Sigma teams that made separate presentations on how they would improve processes in their own areas. At the end of the second presentation, the consultant asked a basic question that stopped both Black Belt team leaders in their tracks: "Haven't you both just proposed making improvements based on eliminating parts of processes in the other group's areas? It seems that the implementation costs in one area will cancel out the savings in the other area!" What had the Black Belts failed to recognize? What would you recommend to prevent this situation from happening in other organizations?
Unlock Deck
Unlock for access to all 63 flashcards in this deck.
Unlock Deck
k this deck
52
Describe the key tools used in lean production.
Unlock Deck
Unlock for access to all 63 flashcards in this deck.
Unlock Deck
k this deck
53
"Resistance to change" is a common theme in the behavioral sciences. What part do you believe that resistance to change plays in management's fostering of successful versus unsuccessful adoptions of Six Sigma approaches? What impact does workers' resistance or lack of resistance have?
Unlock Deck
Unlock for access to all 63 flashcards in this deck.
Unlock Deck
k this deck
54
How can lean concepts be applied in a classroom?
Unlock Deck
Unlock for access to all 63 flashcards in this deck.
Unlock Deck
k this deck
55
Note: Data sets for many problems in this chapter are available in the Excel workbook C09Data.xlsx on the Student Companion Site. Click the appropriate worksheet tab as noted in the problem ( e.g. Prob. 9-12, etc.) to access the data. We also recommend using the ASQ Learn about Quality Excel templates noted in this chapter to facilitate your solutions to appropriate problems.
The times required for trainees in an electronics course at ElecktronTech to assemble a component used in a computer were measured. These are provided in the worksheet Prob. 9-13. Construct a histogram of the data. What recommendations for improvement would you give the course instructor?
The times required for trainees in an electronics course at ElecktronTech to assemble a component used in a computer were measured. These are provided in the worksheet Prob. 9-13. Construct a histogram of the data. What recommendations for improvement would you give the course instructor?
Unlock Deck
Unlock for access to all 63 flashcards in this deck.
Unlock Deck
k this deck
56
Why is Lean Six Sigma especially useful in services? Cite some examples.
Unlock Deck
Unlock for access to all 63 flashcards in this deck.
Unlock Deck
k this deck
57
Note: Data sets for many problems in this chapter are available in the Excel workbook C09Data.xlsx on the Student Companion Site. Click the appropriate worksheet tab as noted in the problem ( e.g. Prob. 9-12, etc.) to access the data. We also recommend using the ASQ Learn about Quality Excel templates noted in this chapter to facilitate your solutions to appropriate problems.
Expand Table 9.2 for sigma levels from 3.0 to 6.0 in increments of 0.1 on a spreadsheet. Construct a chart showing dpmo as a function of the sigma level.
Expand Table 9.2 for sigma levels from 3.0 to 6.0 in increments of 0.1 on a spreadsheet. Construct a chart showing dpmo as a function of the sigma level.
Unlock Deck
Unlock for access to all 63 flashcards in this deck.
Unlock Deck
k this deck
58
Note: Data sets for many problems in this chapter are available in the Excel workbook C09Data.xlsx on the Student Companion Site. Click the appropriate worksheet tab as noted in the problem ( e.g. Prob. 9-12, etc.) to access the data. We also recommend using the ASQ Learn about Quality Excel templates noted in this chapter to facilitate your solutions to appropriate problems.
The current process for fulfilling a room service request at the Luxmark hotel can be described as follows. After the tray is prepared at the room service station, the server proceeds to the room, knocks on the door, sets up the meal, has the customer sign the check, asks if anything else is needed, and then returns to the room service station.
a. Draw a flowchart that describes this process.
b. From the perspective of creating a high level of customer satisfaction from this experience, what improvements might you suggest to enhance this process? Think creatively!
Unlock Deck
Unlock for access to all 63 flashcards in this deck.
Unlock Deck
k this deck
59
What is a SIPOC diagram? How is it used in DMAIC?
Unlock Deck
Unlock for access to all 63 flashcards in this deck.
Unlock Deck
k this deck
60
The January 22, 2001, issue of Fortune contained an article "Why You Can Safely Ignore Six Sigma," that was highly critical of Six Sigma. Here are some of the criticisms levied against Six Sigma:
a. The results often don't have any noticeable impact on company financial statements. Thus, Six Sigma success doesn't correlate to higher stock value. This criticism applies to 90 percent of the companies that implement Six Sigma.
b. Only early adopters can benefit.
c. Six Sigma focuses on defects, which are hard to objectively determine for service businesses.
d. Six Sigma can't guarantee that your product will have a market.
How would you respond to these statements?
Unlock Deck
Unlock for access to all 63 flashcards in this deck.
Unlock Deck
k this deck
61
Develop a flowchart of the process you use to study for an exam. How might you improve this process?
Unlock Deck
Unlock for access to all 63 flashcards in this deck.
Unlock Deck
k this deck
62
Explain the role of projects in Six Sigma. How are Six Sigma teams typically organized?
Unlock Deck
Unlock for access to all 63 flashcards in this deck.
Unlock Deck
k this deck
63
Note: Data sets for many problems in this chapter are available in the Excel workbook C09Data.xlsx on the Student Companion Site. Click the appropriate worksheet tab as noted in the problem ( e.g. Prob. 9-12, etc.) to access the data. We also recommend using the ASQ Learn about Quality Excel templates noted in this chapter to facilitate your solutions to appropriate problems.
The times required to prepare standard-size packages for shipping at Packman Shipping Company were measured. The packers were divided into two equal groups of 20 people, each, having similar experience in packing. These data are provided in the worksheet Prob. 9-14. Construct a scatter diagram for these data. What recommendations for improvement would you give the section leader, based on your findings?
The times required to prepare standard-size packages for shipping at Packman Shipping Company were measured. The packers were divided into two equal groups of 20 people, each, having similar experience in packing. These data are provided in the worksheet Prob. 9-14. Construct a scatter diagram for these data. What recommendations for improvement would you give the section leader, based on your findings?
Unlock Deck
Unlock for access to all 63 flashcards in this deck.
Unlock Deck
k this deck
Unlock Deck
Unlock for access to all 63 flashcards in this deck.


