Deck 11: The Income-Expenditure Model
Full screen (f)
Question
Question
Question
Question
Question
Question
Question
Question
Question
Question
Question
Question
Question
Question
Question
Question
Question
Question
Question
Question
Question
Question
Question
Question
Question
Question
Question
Question
Question
Question
Question
Question
Question
Question
Question
Question
Question
Question
Question
Question
Question
Question
Question
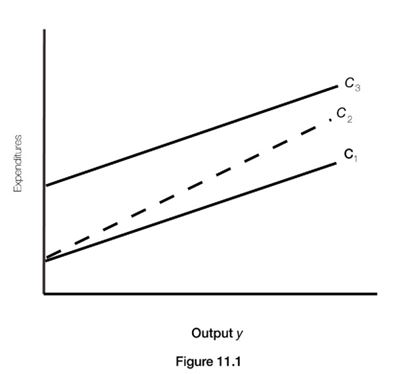
In Figure 11.1, an increase in the marginal propensity to consume is represented by a change in the consumption function from
Question
Question
In Figure 11.1, an increase in consumer wealth is represented by a change in the consumption function from
A)

B)

C)

D)

Question
Question
In Figure 11.1, a decrease in the marginal propensity to save is represented by a change in the consumption function from
A)
B)
C)
D)
Question
Question
Question
Question
Question
Question
In Figure 11.1, an increase in the marginal propensity to save is represented by a change in the consumption function from
A)
B)
C)
D)
Question
Question
Question
In Figure 11.1, a decrease in consumer wealth is represented by a change in the consumption function from
A)
B)
C)
D)
Question
Question
In Figure 11.1, a decrease in the marginal propensity to consume is represented by a change in the consumption function from
A)
B)
C)
D)
Question
Question
Question
Question
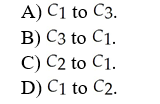
Refer to Figure 11.2. Suppose that Ca = 40, MPC = 0.8, I = 10. The slope of the consumption function is
A) 0.1.
B) 0.2.
C) 0.8.
D) 0.9.
Question
Question
Question
Refer to Figure 11.2. Suppose that Ca = 40, MPC = 0.8, I = 10. Equilibrium income is
A) 40.
B) 50.
C) 250.
D) 400.
Question
Question
Refer to Figure 11.2. Suppose that Ca = 40, MPC = 0.8, I = 10. What is the value of consumption in equilibrium?
A) 32
B) 80
C) 240
D) 320
Question
Refer to Figure 11.2. Suppose that Ca = 40, MPC = 0.8, I = 10. The value of autonomous consumption is
A) 10.
B) 40.
C) 50.
D) 80.
Question
Question
Question
Question
Question
Question
Question
Question
Question
Question
Question
Question

Unlock Deck
Sign up to unlock the cards in this deck!
Unlock Deck
Unlock Deck
1/193
Play
Full screen (f)
Deck 11: The Income-Expenditure Model
1
The consumption function describes the relationship between
A) prices and demand.
B) investment and interest rates.
C) consumers and firms.
D) consumer spending and income.
A) prices and demand.
B) investment and interest rates.
C) consumers and firms.
D) consumer spending and income.
consumer spending and income.
2
The income-expenditure model assumes that the aggregate supply curve is horizontal at a given price level.
True
3
In the income-expenditure model, the 45-degree line
A) is the locus of all the points for which output equals expenditures.
B) marks all equilibrium output levels.
C) shows total expenditures at various price levels.
D) is also called the planned expenditures line.
A) is the locus of all the points for which output equals expenditures.
B) marks all equilibrium output levels.
C) shows total expenditures at various price levels.
D) is also called the planned expenditures line.
is the locus of all the points for which output equals expenditures.
4
The marginal propensity to consume (MPC)is the
A) ratio of consumption to savings.
B) fraction of additional income that is spent.
C) ratio of consumption to income.
D) fraction of additional consumption that is not based on the level of income.
A) ratio of consumption to savings.
B) fraction of additional income that is spent.
C) ratio of consumption to income.
D) fraction of additional consumption that is not based on the level of income.
Unlock Deck
Unlock for access to all 193 flashcards in this deck.
Unlock Deck
k this deck
5
The total demand for goods and services at a given price level is also known as
A) the consumption function.
B) planned expenditures.
C) equilibrium output.
D) autonomous consumption.
A) the consumption function.
B) planned expenditures.
C) equilibrium output.
D) autonomous consumption.
Unlock Deck
Unlock for access to all 193 flashcards in this deck.
Unlock Deck
k this deck
6
The income-expenditure model focuses on changes in
A) output levels.
B) price.
C) import restrictions.
D) operational lags.
A) output levels.
B) price.
C) import restrictions.
D) operational lags.
Unlock Deck
Unlock for access to all 193 flashcards in this deck.
Unlock Deck
k this deck
7
The income-expenditure model focuses on changes in price levels.
Unlock Deck
Unlock for access to all 193 flashcards in this deck.
Unlock Deck
k this deck
8
Unlike Classical economists, Keynes believed that the economy could be trapped in a depression and not return to full employment without government intervention.
Unlock Deck
Unlock for access to all 193 flashcards in this deck.
Unlock Deck
k this deck
9
If firms are producing an output greater than planned expenditures, these firms will cut back on production, which decreases GDP.
Unlock Deck
Unlock for access to all 193 flashcards in this deck.
Unlock Deck
k this deck
10
If an economy is producing a level of output which is lower than the equilibrium level, planned expenditures ________ total output and ________ goods and services are being produced than are being demanded.
A) exceed; more
B) exceed; fewer
C) are less than; more
D) are less than; fewer
A) exceed; more
B) exceed; fewer
C) are less than; more
D) are less than; fewer
Unlock Deck
Unlock for access to all 193 flashcards in this deck.
Unlock Deck
k this deck
11
John Maynard Keynes argued that the fundamental problem which led to the world depression was
A) negative net exports on goods and services.
B) a decreasing supply of goods and services.
C) insufficient demand for goods and services.
D) a shortage of goods and services.
A) negative net exports on goods and services.
B) a decreasing supply of goods and services.
C) insufficient demand for goods and services.
D) a shortage of goods and services.
Unlock Deck
Unlock for access to all 193 flashcards in this deck.
Unlock Deck
k this deck
12
In the income-expenditure model, equilibrium output is the level of output at which the 45-degree line intersects the planned expenditures line. Explain why this output level is an equilibrium level. Illustrate your answer with a diagram of the income-expenditure model.
Unlock Deck
Unlock for access to all 193 flashcards in this deck.
Unlock Deck
k this deck
13
When output exceeds planned expenditures, there is insufficient production in the economy.
Unlock Deck
Unlock for access to all 193 flashcards in this deck.
Unlock Deck
k this deck
14
In the income-expenditure model, firms stand ready to provide all the output that is demanded.
Unlock Deck
Unlock for access to all 193 flashcards in this deck.
Unlock Deck
k this deck
15
The marginal propensity to save (MPS)is the
A) fraction of income that is saved.
B) the ratio of additional savings to additional income.
C) the ratio of savings to consumption.
D) savings that is not based on the level of income.
A) fraction of income that is saved.
B) the ratio of additional savings to additional income.
C) the ratio of savings to consumption.
D) savings that is not based on the level of income.
Unlock Deck
Unlock for access to all 193 flashcards in this deck.
Unlock Deck
k this deck
16
Suppose planned expenditures exceed output. Explain how equilibrium is restored in this economy.
Unlock Deck
Unlock for access to all 193 flashcards in this deck.
Unlock Deck
k this deck
17
The income-expenditure model is best used for short-run analysis of economic fluctuations.
Unlock Deck
Unlock for access to all 193 flashcards in this deck.
Unlock Deck
k this deck
18
The level of GDP at which planned expenditure equals the amount of output produced is the
A) potential output.
B) long-run output.
C) autonomous output.
D) equilibrium output.
A) potential output.
B) long-run output.
C) autonomous output.
D) equilibrium output.
Unlock Deck
Unlock for access to all 193 flashcards in this deck.
Unlock Deck
k this deck
19
If an economy is producing a level of output which is higher than the equilibrium level, planned expenditures ________ total output and ________ goods and services are being produced than are being demanded.
A) exceed; more
B) exceed; fewer
C) are less than; more
D) are less than; fewer
A) exceed; more
B) exceed; fewer
C) are less than; more
D) are less than; fewer
Unlock Deck
Unlock for access to all 193 flashcards in this deck.
Unlock Deck
k this deck
20
When prices do not change very much, the income-expenditure model can be used to understand economic fluctuation in the
A) long run.
B) short run.
C) fiscal year.
D) federal budget allocation.
A) long run.
B) short run.
C) fiscal year.
D) federal budget allocation.
Unlock Deck
Unlock for access to all 193 flashcards in this deck.
Unlock Deck
k this deck
21
An increase in consumer confidence will
A) not change autonomous consumption and rotate the consumption function upward.
B) not change autonomous consumption and rotate the consumption function downward.
C) increase autonomous consumption and shift the consumption function upward.
D) decrease autonomous consumption and shift the consumption function downward.
Unlock Deck
Unlock for access to all 193 flashcards in this deck.
Unlock Deck
k this deck
22
The marginal propensity to consume is always
A) less than one.
B) greater than one.
C) equal to one.
D) equal to zero.
A) less than one.
B) greater than one.
C) equal to one.
D) equal to zero.
Unlock Deck
Unlock for access to all 193 flashcards in this deck.
Unlock Deck
k this deck
23
If the consumption function is C = 90 + 0.75y, then the marginal propensity to consume is
A) 0.2.5.
B) 0.75.
C) 67.5.
D) 90.
A) 0.2.5.
B) 0.75.
C) 67.5.
D) 90.
Unlock Deck
Unlock for access to all 193 flashcards in this deck.
Unlock Deck
k this deck
24
An increase in consumer spending based on an increase in income is reflected by
A) an upward rotation of the consumption function.
B) an increase in the MPC.
C) a downward shift in the consumption function.
D) a movement up along the consumption function.
A) an upward rotation of the consumption function.
B) an increase in the MPC.
C) a downward shift in the consumption function.
D) a movement up along the consumption function.
Unlock Deck
Unlock for access to all 193 flashcards in this deck.
Unlock Deck
k this deck
25
If the consumption function is C = 25 + 0.9y and income increases by $100, then consumer spending will increase by
A) $10.
B) $25.
C) $90.
D) $115.
A) $10.
B) $25.
C) $90.
D) $115.
Unlock Deck
Unlock for access to all 193 flashcards in this deck.
Unlock Deck
k this deck
26
If the consumption function is C = 25 + 0.9y and income increases by $100, then autonomous consumption spending will be
A) $10.
B) $25.
C) $90.
D) $115.
A) $10.
B) $25.
C) $90.
D) $115.
Unlock Deck
Unlock for access to all 193 flashcards in this deck.
Unlock Deck
k this deck
27
A decrease in consumer wealth will
A) not change autonomous consumption and rotate the consumption function upward.
B) not change autonomous consumption and rotate the consumption function downward.
C) increase autonomous consumption and shift the consumption function upward.
D) decrease autonomous consumption and shift the consumption function downward.
Unlock Deck
Unlock for access to all 193 flashcards in this deck.
Unlock Deck
k this deck
28
If the consumption function is C = 90 + 0.75y, then the level of autonomous consumption is
A) 0.25.
B) 0.75.
C) 67.5.
D) 90.
A) 0.25.
B) 0.75.
C) 67.5.
D) 90.
Unlock Deck
Unlock for access to all 193 flashcards in this deck.
Unlock Deck
k this deck
29
If the consumption function is C = 90 + 0.75y, then the marginal propensity to save is
A) 0.25.
B) 0.75.
C) 67.5.
D) 90.
A) 0.25.
B) 0.75.
C) 67.5.
D) 90.
Unlock Deck
Unlock for access to all 193 flashcards in this deck.
Unlock Deck
k this deck
30
The slope of the consumption function is equal to:
A) autonomous consumption.
B) the marginal propensity to consume.
C) the marginal propensity to save.
D) zero.
A) autonomous consumption.
B) the marginal propensity to consume.
C) the marginal propensity to save.
D) zero.
Unlock Deck
Unlock for access to all 193 flashcards in this deck.
Unlock Deck
k this deck
31
Which of the following shifts the entire consumption function upwards?
A) an increase in income
B) a decrease in the value of consumer durables
C) a decrease in consumer confidence
D) an increase in consumer wealth
A) an increase in income
B) a decrease in the value of consumer durables
C) a decrease in consumer confidence
D) an increase in consumer wealth
Unlock Deck
Unlock for access to all 193 flashcards in this deck.
Unlock Deck
k this deck
32
If the consumption function is C = 25 + 0.9y and income increases by $100, then savings will increase by
A) $10.
B) $25.
C) $90.
D) $115.
A) $10.
B) $25.
C) $90.
D) $115.
Unlock Deck
Unlock for access to all 193 flashcards in this deck.
Unlock Deck
k this deck
33
The marginal propensity to consume (MPC)is equal to
A) MPS + 1.
B) MPS - 1.
C) 1 - MPS.
D) 1 + MPS.
A) MPS + 1.
B) MPS - 1.
C) 1 - MPS.
D) 1 + MPS.
Unlock Deck
Unlock for access to all 193 flashcards in this deck.
Unlock Deck
k this deck
34
Let "C = Ca + by" define the consumption function. The term "b" is known as
A) autonomous consumption.
B) induced consumption.
C) the marginal propensity to consume.
D) the marginal propensity to save.
A) autonomous consumption.
B) induced consumption.
C) the marginal propensity to consume.
D) the marginal propensity to save.
Unlock Deck
Unlock for access to all 193 flashcards in this deck.
Unlock Deck
k this deck
35
Autonomous consumption is
A) the sum of consumption that depends on the level of income and consumption that does not depend on income.
B) the part of consumption that depends on the level of income.
C) the part of consumption that does not depend on income.
D) the relationship between consumption spending and the level of income.
Unlock Deck
Unlock for access to all 193 flashcards in this deck.
Unlock Deck
k this deck
36
The marginal propensity to save (MPS)is equal to
A) 1 - MPC.
B) MPC - 1.
C) MPC + 1.
D) 1 + MPC.
A) 1 - MPC.
B) MPC - 1.
C) MPC + 1.
D) 1 + MPC.
Unlock Deck
Unlock for access to all 193 flashcards in this deck.
Unlock Deck
k this deck
37
The sum of the marginal propensity to consume (MPC)and the marginal propensity to save (MPS)is
A) equal to one.
B) greater than one.
C) less than one.
D) negative.
A) equal to one.
B) greater than one.
C) less than one.
D) negative.
Unlock Deck
Unlock for access to all 193 flashcards in this deck.
Unlock Deck
k this deck
38
At a fixed income level, an increase in consumption which is accompanied by a decrease in savings is reflected by
A) an upward rotation of the consumption function.
B) a downward rotation of the consumption function.
C) an upward shift of the consumption function.
D) a movement up along the consumption function.
A) an upward rotation of the consumption function.
B) a downward rotation of the consumption function.
C) an upward shift of the consumption function.
D) a movement up along the consumption function.
Unlock Deck
Unlock for access to all 193 flashcards in this deck.
Unlock Deck
k this deck
39
Let "C = Ca+ by" define the consumption function. The term "by" is
A) autonomous consumption.
B) current income.
C) the marginal propensity to consume.
D) consumption that depends on income.
A) autonomous consumption.
B) current income.
C) the marginal propensity to consume.
D) consumption that depends on income.
Unlock Deck
Unlock for access to all 193 flashcards in this deck.
Unlock Deck
k this deck
40
Let "C =Ca + by" define the consumption function. The term "
Ca " is known as
A) autonomous consumption.
B) induced consumption.
C) the marginal propensity to consume.
D) the marginal propensity to save.
Ca " is known as
A) autonomous consumption.
B) induced consumption.
C) the marginal propensity to consume.
D) the marginal propensity to save.
Unlock Deck
Unlock for access to all 193 flashcards in this deck.
Unlock Deck
k this deck
41
Recall the Application about the impact that home equity values have on consumer spending and wealth to answer the following question(s). From 1997 to mid-2006, housing prices rose nationally by approximately 90 percent and consumer wealth increased by $6.5 trillion, but in the summer of 2006, housing prices began to fall. Home equity is the single largest component of net wealth for most families in the United States, and changes in the value of home equity affect consumer spending.
According to this Application, home equity is the single largest component of net wealth for most families in the United States. As home equity falls
A) autonomous consumption will decrease, shifting the consumption function downward.
B) autonomous consumption will decrease, shifting the consumption function upward.
C) the MPC will decrease, increasing the slope of the consumption function.
D) the MPC will decrease, decreasing the slope of the consumption function.
Unlock Deck
Unlock for access to all 193 flashcards in this deck.
Unlock Deck
k this deck
42
Recall the Application about the impact that home equity values have on consumer spending and wealth to answer the following question(s). From 1997 to mid-2006, housing prices rose nationally by approximately 90 percent and consumer wealth increased by $6.5 trillion, but in the summer of 2006, housing prices began to fall. Home equity is the single largest component of net wealth for most families in the United States, and changes in the value of home equity affect consumer spending.
According to this Application, studies estimated that a decrease of consumer wealth of $1 would ________ consumption spending by somewhere between ________.
A) lower; $0.02 and $0.07
B) raise; $0.21 and $0.72
C) lower; $0.21 and $0.72
D) raise; $0.10 and $0.50
According to this Application, studies estimated that a decrease of consumer wealth of $1 would ________ consumption spending by somewhere between ________.
A) lower; $0.02 and $0.07
B) raise; $0.21 and $0.72
C) lower; $0.21 and $0.72
D) raise; $0.10 and $0.50
Unlock Deck
Unlock for access to all 193 flashcards in this deck.
Unlock Deck
k this deck
43
In Figure 11.1, an increase in the marginal propensity to consume is represented by a change in the consumption function from
Unlock Deck
Unlock for access to all 193 flashcards in this deck.
Unlock Deck
k this deck
44
Recall the Application about the impact that home equity values have on consumer spending and wealth to answer the following question(s). From 1997 to mid-2006, housing prices rose nationally by approximately 90 percent and consumer wealth increased by $6.5 trillion, but in the summer of 2006, housing prices began to fall. Home equity is the single largest component of net wealth for most families in the United States, and changes in the value of home equity affect consumer spending.
According to this Application, the decrease in consumer wealth due to decreases in the value of home equity has
A) decreased consumer spending.
B) increased consumer saving.
C) decreased the marginal propensity to save.
D) increased short-run aggregate supply.
According to this Application, the decrease in consumer wealth due to decreases in the value of home equity has
A) decreased consumer spending.
B) increased consumer saving.
C) decreased the marginal propensity to save.
D) increased short-run aggregate supply.
Unlock Deck
Unlock for access to all 193 flashcards in this deck.
Unlock Deck
k this deck
45
In Figure 11.1, an increase in consumer wealth is represented by a change in the consumption function from
A)
B)
C)
D)
Unlock Deck
Unlock for access to all 193 flashcards in this deck.
Unlock Deck
k this deck
46
Which of the following causes the consumption function to rotate downwards?
A) a decrease in consumer tax rates
B) a decrease in autonomous consumption
C) a decrease in the marginal propensity to save (MPS)
D) a decrease in the marginal propensity to consume (MPC)
A) a decrease in consumer tax rates
B) a decrease in autonomous consumption
C) a decrease in the marginal propensity to save (MPS)
D) a decrease in the marginal propensity to consume (MPC)
Unlock Deck
Unlock for access to all 193 flashcards in this deck.
Unlock Deck
k this deck
47
In Figure 11.1, a decrease in the marginal propensity to save is represented by a change in the consumption function from
A)
B)
C)
D)
Unlock Deck
Unlock for access to all 193 flashcards in this deck.
Unlock Deck
k this deck
48
The marginal propensity to consume (MPC)is the fraction of additional income that is spent.
Unlock Deck
Unlock for access to all 193 flashcards in this deck.
Unlock Deck
k this deck
49
The consumption function shows the relationship between consumer spending and price level.
Unlock Deck
Unlock for access to all 193 flashcards in this deck.
Unlock Deck
k this deck
50
Autonomous consumption is consumer spending which is based on income levels.
Unlock Deck
Unlock for access to all 193 flashcards in this deck.
Unlock Deck
k this deck
51
Increases in consumer wealth will cause an increase in autonomous consumption.
Unlock Deck
Unlock for access to all 193 flashcards in this deck.
Unlock Deck
k this deck
52
The slope of the consumption function is equal to the level of autonomous consumption.
Unlock Deck
Unlock for access to all 193 flashcards in this deck.
Unlock Deck
k this deck
53
In Figure 11.1, an increase in the marginal propensity to save is represented by a change in the consumption function from
A)
B)
C)
D)
Unlock Deck
Unlock for access to all 193 flashcards in this deck.
Unlock Deck
k this deck
54
A movement along the consumption function is the result of a change in
A) autonomous consumption.
B) income.
C) consumer wealth.
D) expected wealth.
A) autonomous consumption.
B) income.
C) consumer wealth.
D) expected wealth.
Unlock Deck
Unlock for access to all 193 flashcards in this deck.
Unlock Deck
k this deck
55
Recall the Application about the impact that home equity values have on consumer spending and wealth to answer the following question(s). From 1997 to mid-2006, housing prices rose nationally by approximately 90 percent and consumer wealth increased by $6.5 trillion, but in the summer of 2006, housing prices began to fall. Home equity is the single largest component of net wealth for most families in the United States, and changes in the value of home equity affect consumer spending.
According to this Application, what is home equity?
A) the value of homes less the value of the property on which the homes are sitting
B) the value of homes plus the value of the content in the homes
C) the average retail value of homes listed for sale
D) the difference between the value of homes and the amount of mortgage debt on the property
Unlock Deck
Unlock for access to all 193 flashcards in this deck.
Unlock Deck
k this deck
56
In Figure 11.1, a decrease in consumer wealth is represented by a change in the consumption function from
A)
B)
C)
D)
Unlock Deck
Unlock for access to all 193 flashcards in this deck.
Unlock Deck
k this deck
57
Which of the following increases the slope of the consumption function?
A) an increase in the marginal propensity to consume
B) a decrease in the value of consumer durables
C) an increase in consumer confidence
D) an increase in consumer wealth
A) an increase in the marginal propensity to consume
B) a decrease in the value of consumer durables
C) an increase in consumer confidence
D) an increase in consumer wealth
Unlock Deck
Unlock for access to all 193 flashcards in this deck.
Unlock Deck
k this deck
58
In Figure 11.1, a decrease in the marginal propensity to consume is represented by a change in the consumption function from
A)
B)
C)
D)
Unlock Deck
Unlock for access to all 193 flashcards in this deck.
Unlock Deck
k this deck
59
Which of the following causes autonomous consumption to decrease?
A) a decrease in consumer income
B) consumers becoming more thrifty
C) consumers becoming more optimistic about future decreases in the price level
D) an increase in average family size
A) a decrease in consumer income
B) consumers becoming more thrifty
C) consumers becoming more optimistic about future decreases in the price level
D) an increase in average family size
Unlock Deck
Unlock for access to all 193 flashcards in this deck.
Unlock Deck
k this deck
60
Recall the Application about the impact that home equity values have on consumer spending and wealth to answer the following question(s). From 1997 to mid-2006, housing prices rose nationally by approximately 90 percent and consumer wealth increased by $6.5 trillion, but in the summer of 2006, housing prices began to fall. Home equity is the single largest component of net wealth for most families in the United States, and changes in the value of home equity affect consumer spending.
According to this Application, falling home equity values have decreased consumer wealth, which is a measure of a consumer's
A) total net worth.
B) annual income.
C) annual income minus annual expenses.
D) annual income minus total expenses.
According to this Application, falling home equity values have decreased consumer wealth, which is a measure of a consumer's
A) total net worth.
B) annual income.
C) annual income minus annual expenses.
D) annual income minus total expenses.
Unlock Deck
Unlock for access to all 193 flashcards in this deck.
Unlock Deck
k this deck
61
Let S =y - (150 + 0.6y). Assume no government or foreign sectors. What is the consumption function?
A) C = -150 + 0.4y
B) C = 150 + 0.4y
C) C = 150 + 0.6y
D) C = -150 - 0.6y
A) C = -150 + 0.4y
B) C = 150 + 0.4y
C) C = 150 + 0.6y
D) C = -150 - 0.6y
Unlock Deck
Unlock for access to all 193 flashcards in this deck.
Unlock Deck
k this deck
62
Refer to Figure 11.2. Suppose that Ca = 40, MPC = 0.8, I = 10. The slope of the consumption function is
A) 0.1.
B) 0.2.
C) 0.8.
D) 0.9.
Unlock Deck
Unlock for access to all 193 flashcards in this deck.
Unlock Deck
k this deck
63
Let C = 120 + 0.8y. Assume no government or foreign sectors. At the equilibrium level of income, y* = 200, the level of saving is
A) -80.
B) -30.
C) 96.
D) 160.
A) -80.
B) -30.
C) 96.
D) 160.
Unlock Deck
Unlock for access to all 193 flashcards in this deck.
Unlock Deck
k this deck
64
Let S =y - (100 + 0.5y). Assume no government or foreign sectors. At the equilibrium level of income, y* = 800, the level of saving is
A) 0.
B) 50.
C) 100.
D) 300.
A) 0.
B) 50.
C) 100.
D) 300.
Unlock Deck
Unlock for access to all 193 flashcards in this deck.
Unlock Deck
k this deck
65
Refer to Figure 11.2. Suppose that Ca = 40, MPC = 0.8, I = 10. Equilibrium income is
A) 40.
B) 50.
C) 250.
D) 400.
Unlock Deck
Unlock for access to all 193 flashcards in this deck.
Unlock Deck
k this deck
66
In the savings function S = -725 + 0.25y, 0.25 is the
A) MPC.
B) MPS.
C) slope of the consumption function.
D) vertical intercept of the savings function.
A) MPC.
B) MPS.
C) slope of the consumption function.
D) vertical intercept of the savings function.
Unlock Deck
Unlock for access to all 193 flashcards in this deck.
Unlock Deck
k this deck
67
Refer to Figure 11.2. Suppose that Ca = 40, MPC = 0.8, I = 10. What is the value of consumption in equilibrium?
A) 32
B) 80
C) 240
D) 320
Unlock Deck
Unlock for access to all 193 flashcards in this deck.
Unlock Deck
k this deck
68
Refer to Figure 11.2. Suppose that Ca = 40, MPC = 0.8, I = 10. The value of autonomous consumption is
A) 10.
B) 40.
C) 50.
D) 80.
Unlock Deck
Unlock for access to all 193 flashcards in this deck.
Unlock Deck
k this deck
69
Let C = 150 + 0.5y and I = 45. At the equilibrium level of income, y*, the level of saving is
A) 45.
B) 75.
C) 105.
D) 150.
A) 45.
B) 75.
C) 105.
D) 150.
Unlock Deck
Unlock for access to all 193 flashcards in this deck.
Unlock Deck
k this deck
70
At the equilibrium level of income, the value of consumption is equal to
A) (consumption - savings).
B) (income - investment).
C) (income + investment).
D) (savings + investment).
A) (consumption - savings).
B) (income - investment).
C) (income + investment).
D) (savings + investment).
Unlock Deck
Unlock for access to all 193 flashcards in this deck.
Unlock Deck
k this deck
71
In the simple Keynesian cross model with no government or foreign sectors, at the equilibrium level of output
A) saving is equal to zero.
B) saving is less than investment.
C) saving is equal to investment.
D) saving is greater than investment.
A) saving is equal to zero.
B) saving is less than investment.
C) saving is equal to investment.
D) saving is greater than investment.
Unlock Deck
Unlock for access to all 193 flashcards in this deck.
Unlock Deck
k this deck
72
Let C = 40 + 0.8y and I = 10. Autonomous consumption is
A) 10.
B) 32.
C) 40.
D) 50.
A) 10.
B) 32.
C) 40.
D) 50.
Unlock Deck
Unlock for access to all 193 flashcards in this deck.
Unlock Deck
k this deck
73
Suppose autonomous consumption increases. Explain how this event will lead to a rise in equilibrium output, and illustrate using a graph of the income-expenditure model.
Unlock Deck
Unlock for access to all 193 flashcards in this deck.
Unlock Deck
k this deck
74
Let S =y - (100 + 0.75y). Assume no government or foreign sectors. At the equilibrium level of income, y* = 400, the level of investment is
A) 0.
B) 75.
C) 300.
D) 400.
A) 0.
B) 75.
C) 300.
D) 400.
Unlock Deck
Unlock for access to all 193 flashcards in this deck.
Unlock Deck
k this deck
75
Let C = 800 + 0.6y and I = 100. Assume no government or foreign sectors. If investment decreases by 40, the equilibrium output decreases by a total of
A) 800.
B) 480.
C) 100.
D) 25.
A) 800.
B) 480.
C) 100.
D) 25.
Unlock Deck
Unlock for access to all 193 flashcards in this deck.
Unlock Deck
k this deck
76
What is the difference between income and wealth?
Unlock Deck
Unlock for access to all 193 flashcards in this deck.
Unlock Deck
k this deck
77
Let C = 550 + 0.8y and I = 75. Assume no government or foreign sectors. If investment increases by 100, the equilibrium output increases by a total of
A) 60.
B) 175.
C) 500.
D) 800.
A) 60.
B) 175.
C) 500.
D) 800.
Unlock Deck
Unlock for access to all 193 flashcards in this deck.
Unlock Deck
k this deck
78
Let C = 300 + 0.75y and I = 200. Assume no government or foreign sectors. Investment needs to decrease by ________ to decrease equilibrium output by a total of $750.
A) $75
B) $100
C) $150
D) $187.50
A) $75
B) $100
C) $150
D) $187.50
Unlock Deck
Unlock for access to all 193 flashcards in this deck.
Unlock Deck
k this deck
79
Let C = 70 + 0.75y and I = 40. Assume no government or foreign sectors. Investment needs to increase by ________ to increase equilibrium output by a total of $600.
A) $30
B) $150
C) $560
D) $600
A) $30
B) $150
C) $560
D) $600
Unlock Deck
Unlock for access to all 193 flashcards in this deck.
Unlock Deck
k this deck
80
In the simple Keynesian cross model with no government or foreign sectors, the value of the multiplier is defined as
A) 1/MPC.
B) 1/(1-MPC).
C) 1/(MPC-1).
D) 1/(MPC+1).
A) 1/MPC.
B) 1/(1-MPC).
C) 1/(MPC-1).
D) 1/(MPC+1).
Unlock Deck
Unlock for access to all 193 flashcards in this deck.
Unlock Deck
k this deck
Unlock Deck
Unlock for access to all 193 flashcards in this deck.


