Deck 7: Statistics and Probability
Full screen (f)
Question
The bar graph shows the expenditures of one city government in a recent year. 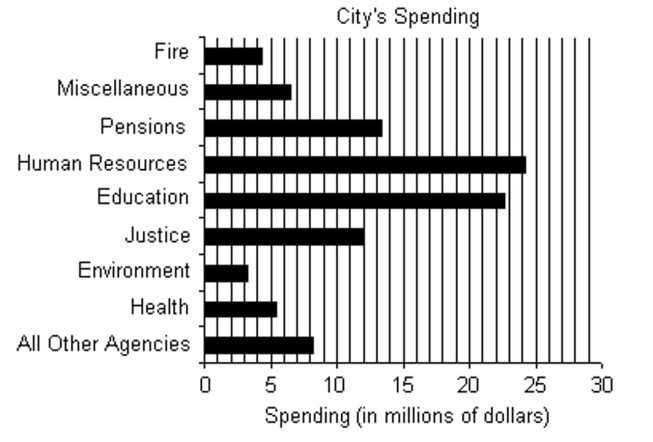
How much more is spent on Health than on Fire?
A)$4.3 million
B)$2.6 million
C)$1.1 million
D)$2.4 million
How much more is spent on Health than on Fire?
A)$4.3 million
B)$2.6 million
C)$1.1 million
D)$2.4 million
Question
The following pictograph shows the number of bicyclists who participated in the Labor Day weekend bicycle race for the
years 2003-2009. Use the graph to answer the question.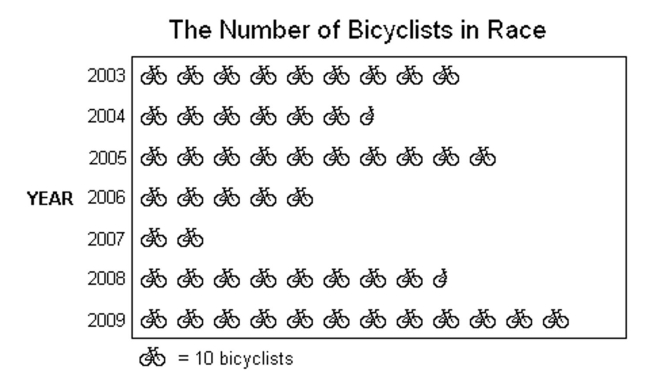
How many cyclists participated in 2003?
A)100 cyclists
B)90 cyclists
C)50 cyclists
D)65 cyclists
years 2003-2009. Use the graph to answer the question.
How many cyclists participated in 2003?
A)100 cyclists
B)90 cyclists
C)50 cyclists
D)65 cyclists
Question
The bar graph shows the number of tickets sold each week by the garden club for their annual flower show. 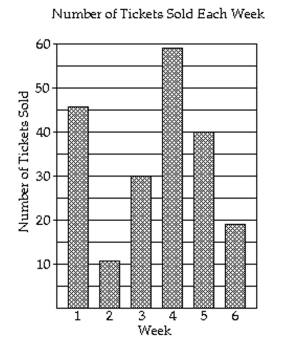
During which week were 19 tickets sold?
A)week 1
B)week 2
C)week 6
D)week 3
During which week were 19 tickets sold?
A)week 1
B)week 2
C)week 6
D)week 3
Question
The bar graph shows the number of tickets sold each week by the garden club for their annual flower show.
How many tickets were sold in all?
A)205 tickets
B)215 tickets
C)105 tickets
D)195 tickets
How many tickets were sold in all?
A)205 tickets
B)215 tickets
C)105 tickets
D)195 tickets
Question
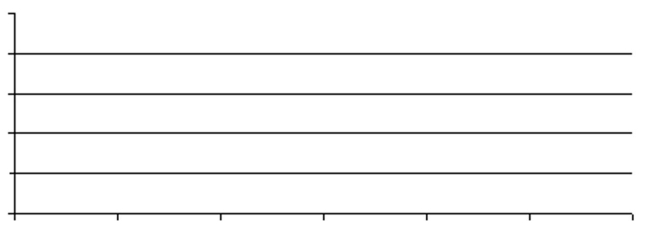
Use the information given to draw a vertical bar graph. Clearly label the bars on the graph shown below.
Visitors of Jazz Festival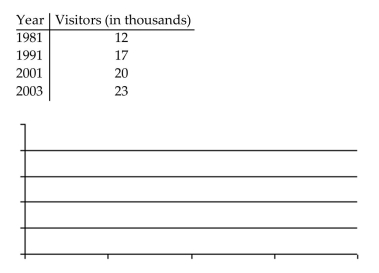
Visitors of Jazz Festival
Question
The following pictograph shows the number of bicyclists who participated in the Labor Day weekend bicycle race for the
years 2003-2009. Use the graph to answer the question.
In what year did the greatest number of cyclists participate?
A)1997
B)2009
C)2007
D)1996
years 2003-2009. Use the graph to answer the question.
In what year did the greatest number of cyclists participate?
A)1997
B)2009
C)2007
D)1996
Question
The following pictograph shows the number of bicyclists who participated in the Labor Day weekend bicycle race for the
years 2003-2009. Use the graph to answer the question.
Approximate the total number of cyclists who participated in 2005 and 2006.
A)150 cyclists
B)130 cyclists
C)160 cyclists
D)140 cyclists
years 2003-2009. Use the graph to answer the question.
Approximate the total number of cyclists who participated in 2005 and 2006.
A)150 cyclists
B)130 cyclists
C)160 cyclists
D)140 cyclists
Question
The following pictograph shows the number of bicyclists who participated in the Labor Day weekend bicycle race for the
years 2003-2009. Use the graph to answer the question.
In what years was there an increase in the number of cyclists who participated in the race?
A)2003, 2005, 2009
B)2004, 2005, 2009
C)2004, 2006, 2007
D)2005, 2008, 2009
years 2003-2009. Use the graph to answer the question.
In what years was there an increase in the number of cyclists who participated in the race?
A)2003, 2005, 2009
B)2004, 2005, 2009
C)2004, 2006, 2007
D)2005, 2008, 2009
Question
The bar graph shows the expenditures of one city government in a recent year.
Name the agency whose spending is between $3 million and $4 million and estimate its value.
A)Fire; $3.2 million
B)Fire; $4.3 million
C)Environment; $3.2 million
D)Environment; $4.3 million
Name the agency whose spending is between $3 million and $4 million and estimate its value.
A)Fire; $3.2 million
B)Fire; $4.3 million
C)Environment; $3.2 million
D)Environment; $4.3 million
Question
The bar graph shows the number of tickets sold each week by the garden club for their annual flower show.
During which week was the fewest number of tickets sold?
A)week 6
B)week 5
C)week 2
D)week 4
During which week was the fewest number of tickets sold?
A)week 6
B)week 5
C)week 2
D)week 4
Question
The following pictograph shows the number of bicyclists who participated in the Labor Day weekend bicycle race for the
years 2003-2009. Use the graph to answer the question.
What was the greatest number of cyclists to participate in any one year?
A)20 cyclists
B)50 cyclists
C)100 cyclists
D)120 cyclists
years 2003-2009. Use the graph to answer the question.
What was the greatest number of cyclists to participate in any one year?
A)20 cyclists
B)50 cyclists
C)100 cyclists
D)120 cyclists
Question
The bar graph shows the expenditures of one city government in a recent year.
Name the agency with the smallest spending and estimate this value.
A)Environment; $3.2 million
B)All Other Agencies; $8.2 million
C)Human Resources; $24.2 million
D)Health; $5.4 million
Name the agency with the smallest spending and estimate this value.
A)Environment; $3.2 million
B)All Other Agencies; $8.2 million
C)Human Resources; $24.2 million
D)Health; $5.4 million
Question
The histogram shows the scores of each participant in a game from a total of 100 participants. 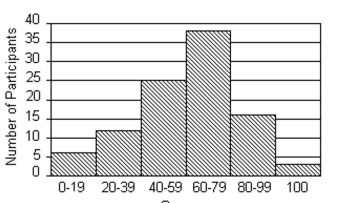
How many participants scored 40-59?
A)38 participants
B)16 participants
C)3 participants
D)25 participants
How many participants scored 40-59?
A)38 participants
B)16 participants
C)3 participants
D)25 participants
Question
The following pictograph shows the number of bicyclists who participated in the Labor Day weekend bicycle race for the
years 2003-2009. Use the graph to answer the question.
What was the increase in the number of participants from 2004 to 2005?
A)45 cyclists
B)30 cyclists
C)40 cyclists
D)35 cyclists
years 2003-2009. Use the graph to answer the question.
What was the increase in the number of participants from 2004 to 2005?
A)45 cyclists
B)30 cyclists
C)40 cyclists
D)35 cyclists
Question
The bar graph shows the number of tickets sold each week by the garden club for their annual flower show.
How many more tickets were sold during week 6 than week 2?
A)30 tickets
B)13 tickets
C)8 tickets
D)18 tickets
How many more tickets were sold during week 6 than week 2?
A)30 tickets
B)13 tickets
C)8 tickets
D)18 tickets
Question
The bar graph shows the number of tickets sold each week by the garden club for their annual flower show.
During which week was the most number of tickets sold?
A)week 5
B)week 2
C)week 1
D)week 4
During which week was the most number of tickets sold?
A)week 5
B)week 2
C)week 1
D)week 4
Question
The following pictograph shows the number of bicyclists who participated in the Labor Day weekend bicycle race for the
years 2003-2009. Use the graph to answer the question.
In what years was there a decline in the number of cyclists who participated in the race?
A)2004, 2006
B)2004, 2006, 2007
C)2004, 2006, 2007, 2008
D)2005, 2008, 2009
years 2003-2009. Use the graph to answer the question.
In what years was there a decline in the number of cyclists who participated in the race?
A)2004, 2006
B)2004, 2006, 2007
C)2004, 2006, 2007, 2008
D)2005, 2008, 2009
Question
The bar graph shows the number of tickets sold each week by the garden club for their annual flower show.
How many tickets were sold during week 5?
A)40 tickets
B)46 tickets
C)19 tickets
D)11 tickets
How many tickets were sold during week 5?
A)40 tickets
B)46 tickets
C)19 tickets
D)11 tickets
Question
The following pictograph shows the number of bicyclists who participated in the Labor Day weekend bicycle race for the
years 2003-2009. Use the graph to answer the question.
In what year did 85 cyclists participate?
A)2004
B)2008
C)2009
D)2003
years 2003-2009. Use the graph to answer the question.
In what year did 85 cyclists participate?
A)2004
B)2008
C)2009
D)2003
Question
Use the information given to draw a vertical bar graph. Clearly label the bars on the graph shown below.
Entree Choices of Customers During One Week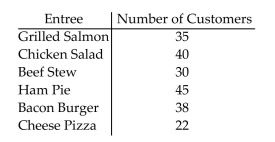
Entree Choices of Customers During One Week
Question
The histogram shows the scores of each participant in a game from a total of 100 participants.
How many more participants scored 80-99 than 20-39?
A)16 participants
B)4 participants
C)32 participants
D)13 participants
How many more participants scored 80-99 than 20-39?
A)16 participants
B)4 participants
C)32 participants
D)13 participants
Question
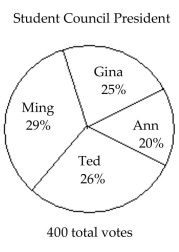
The circle graph shows the results of the student council presidential election. The complete circular area represents 100%
of the votes.
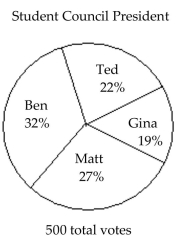 The circle graph shows what percent of the vote each person received. Who got the fewest votes?
A)Ben
B)Matt
C)Gina
D)Ted
of the votes.
The circle graph shows what percent of the vote each person received. Who got the fewest votes?A)Ben
B)Matt
C)Gina
D)Ted
Question
The line graph shows the recorded hourly temperatures in degrees Fahrenheit at an airport. 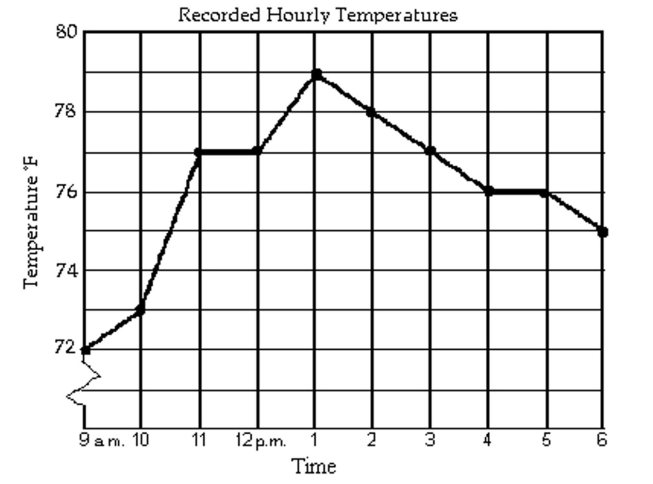
At what time was the temperature its lowest?
A)9 a.m.
B)1 p.m.
C)6 p.m.
D)4 p.m.
At what time was the temperature its lowest?
A)9 a.m.
B)1 p.m.
C)6 p.m.
D)4 p.m.
Question
The line graph shows the recorded hourly temperatures in degrees Fahrenheit at an airport.
During which hour did the temperature increase the most?
A)10 a.m. to 11 a.m.
B)9 a.m. to 10 a.m.
C)1 p.m. to 2 p.m.
D)12 p.m. to 1 p.m.
During which hour did the temperature increase the most?
A)10 a.m. to 11 a.m.
B)9 a.m. to 10 a.m.
C)1 p.m. to 2 p.m.
D)12 p.m. to 1 p.m.
Question
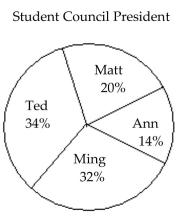
The circle graph shows the results of the student council presidential election. The complete circular area represents 100%
of the votes.
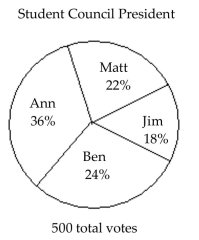 The circle graph shows what percent of the vote each person received. Who got the most votes?
A)Jim
B)Ben
C)Ann
D)Matt
of the votes.
The circle graph shows what percent of the vote each person received. Who got the most votes?A)Jim
B)Ben
C)Ann
D)Matt
Question
The line graph shows the recorded hourly temperatures in degrees Fahrenheit at an airport.
At what time was the temperature the highest?
A)11 a.m.
B)2 p.m.
C)1 p.m.
D)5 p.m.
At what time was the temperature the highest?
A)11 a.m.
B)2 p.m.
C)1 p.m.
D)5 p.m.
Question
The circle graph shows the results of the student council presidential election. The complete circular area represents 100%
of the votes.
Student Council President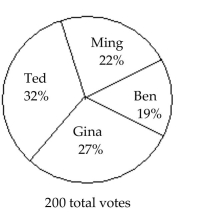 The circle graph shows what percent of the vote each person received. Who received the second most number of votes?
A)Ben
B)Gina
C)Ming
D)Ted
of the votes.
Student Council President
The circle graph shows what percent of the vote each person received. Who received the second most number of votes?A)Ben
B)Gina
C)Ming
D)Ted
Question
Question
The histogram shows the scores of each participant in a game from a total of 100 participants.
How many participants scored fewer than 40?
A)18 participants
B)97 participants
C)81 participants
D)43 participants
How many participants scored fewer than 40?
A)18 participants
B)97 participants
C)81 participants
D)43 participants
Question
Twenty teenagers were asked to give their current savings account balances. Use the balances shown in the list to
complete the frequency distribution table and construct a histogram.
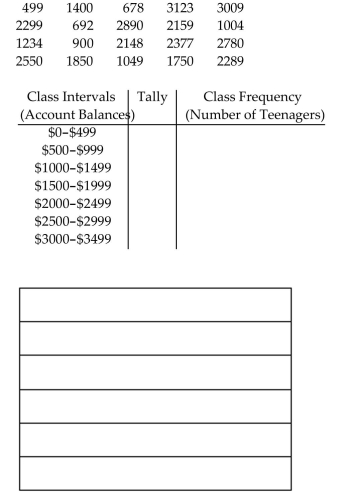
complete the frequency distribution table and construct a histogram.
Question
The circle graph shows the results of the student council presidential election. The complete circular area represents 100%
of the votes.
- The circle graph shows what percent of the vote each person received. Find the ratio of Ann's votes to Gina's votes.
A)
B)
C)
D)
of the votes.
-
The circle graph shows what percent of the vote each person received. Find the ratio of Ann's votes to Gina's votes.A)
B)
C)
D)
Question
The histogram shows the scores of each participant in a game from a total of 100 participants.
-What is the ratio of participants who score 20-39 to the total number of participants?
A)
B)
C)
D)
-What is the ratio of participants who score 20-39 to the total number of participants?
A)
B)
C)
D)
Question
The circle graph shows the results of the student council presidential election. The complete circular area represents 100%
of the votes.
- 300 total votes The circle graph shows what percent of the vote each person received.How many votes did Ted get?
A)60
B)42
C)96
D)102
of the votes.
-
300 total votes The circle graph shows what percent of the vote each person received.How many votes did Ted get?A)60
B)42
C)96
D)102
Question
The circle graph shows the results of the student council presidential election. The complete circular area represents 100%
of the votes.
-Student Council President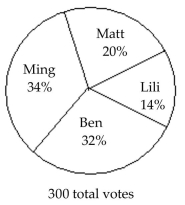 The circle graph shows what percent of the vote each person received. Find the ratio of Ming's votes to total votes cast.
A)
B)
C)
D)
of the votes.
-Student Council President
The circle graph shows what percent of the vote each person received. Find the ratio of Ming's votes to total votes cast.A)
B)
C)
D)
Question
The double-line graph shows temperature highs and lows for a week. 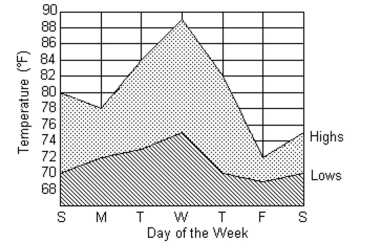
What was the high temperature reading on Wednesday?
What was the high temperature reading on Wednesday?
Question
The line graph shows the recorded hourly temperatures in degrees Fahrenheit at an airport.
During which two hour period did the temperature increase the most?
A)9 a.m. to 11 a.m.
B)10 a.m. to 11 a.m.
C)10 a.m. to 12 p.m.
D)12 p.m. to 2 p.m.
During which two hour period did the temperature increase the most?
A)9 a.m. to 11 a.m.
B)10 a.m. to 11 a.m.
C)10 a.m. to 12 p.m.
D)12 p.m. to 2 p.m.
Question
The line graph shows the recorded hourly temperatures in degrees Fahrenheit at an airport.
What temperature was recorded at 1 p.m.?
A)77 ° F
B)80 ° F
C)79 ° F
D)81 ° F
What temperature was recorded at 1 p.m.?
A)77 ° F
B)80 ° F
C)79 ° F
D)81 ° F
Question
The line graph shows the recorded hourly temperatures in degrees Fahrenheit at an airport.
At what time was the temperature 73°?
A)5 p.m.
B)9 a.m.
C)10 a.m.
D)10 a.m. and 11 a.m.
At what time was the temperature 73°?
A)5 p.m.
B)9 a.m.
C)10 a.m.
D)10 a.m. and 11 a.m.
Question
The double-line graph shows temperature highs and lows for a week.
-On what day of the week was the difference between the high temperature and the low temperature the least? What was this difference in temperature?
-On what day of the week was the difference between the high temperature and the low temperature the least? What was this difference in temperature?
Question
The circle graph shows the results of the student council presidential election. The complete circular area represents 100%
of the votes.
Student Council President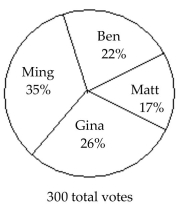 The circle graph shows what percent of the vote each person received. What percent of the votes did Matt and Ben receive together?
A)22%
B)39%
C)61%
D)17%
of the votes.
Student Council President
The circle graph shows what percent of the vote each person received. What percent of the votes did Matt and Ben receive together?A)22%
B)39%
C)61%
D)17%
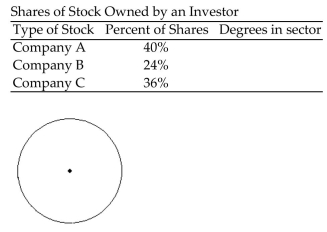
Question
Fill in the table. Round to the nearest degree. Then draw a circle graph to represent the information given in the table.

Question
Question
The circle graph summarizes the results of a survey of the favorite movie category chosen by a group of adults. 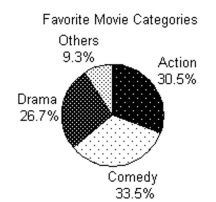
-2400 adults answer the survey. Find the ratio of number of respondents who favor others to those who favor comedies. Write the ratio as a
Fraction with integers in the numerator and denominator.
A)
B)
C)
D)
-2400 adults answer the survey. Find the ratio of number of respondents who favor others to those who favor comedies. Write the ratio as a
Fraction with integers in the numerator and denominator.
A)
B)
C)
D)
Question
Question
The circle graph shows the results of the student council presidential election. The complete circular area represents 100%
of the votes.
Student Council President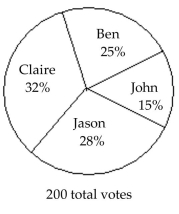 The circle graph shows what percent of the vote each person received. What percent of the votes did Ben NOT get?
A)72%
B)25%
C)75%
D)68%
of the votes.
Student Council President
The circle graph shows what percent of the vote each person received. What percent of the votes did Ben NOT get?A)72%
B)25%
C)75%
D)68%
Question
The circle graph summarizes the results of a survey of the favorite movie category chosen by a group of adults.
1800 adults answer the survey. How many of the survey respondents said that they favor comedies? Round to the nearest whole.
A)3350 respondents
B)481 respondents
C)603 respondents
D)167 respondents
1800 adults answer the survey. How many of the survey respondents said that they favor comedies? Round to the nearest whole.
A)3350 respondents
B)481 respondents
C)603 respondents
D)167 respondents
Question
Question
Question
Question
Question
Question
The circle graph shows the results of the student council presidential election. The complete circular area represents 100%
of the votes.
Student Council President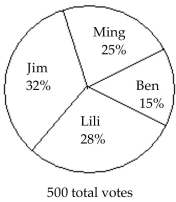 The circle graph shows what percent of the vote each person received. What percent of the votes did Ben NOT get?
A)85%
B)15%
C)72%
D)68%
of the votes.
Student Council President
The circle graph shows what percent of the vote each person received. What percent of the votes did Ben NOT get?A)85%
B)15%
C)72%
D)68%
Question
Question
Question
Question
Question
Fill in the table. Round to the nearest degree. Then draw a circle graph to represent the information given in the table.
Question
Question
The circle graph shows the results of the student council presidential election. The complete circular area represents 100%
of the votes.
Student Council President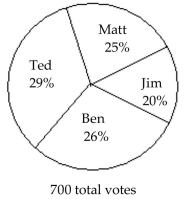 The circle graph shows what percent of the vote each person received. How many people voted for someone other than Ben?
A)182
B)518
C)560
D)525
of the votes.
Student Council President
The circle graph shows what percent of the vote each person received. How many people voted for someone other than Ben?A)182
B)518
C)560
D)525
Question
Question
Question
Question
Question
Question
Question
Question
Question
Question
Question
Question
Question
Question
Question
Question
Question
Question
Question
Question
Question

Unlock Deck
Sign up to unlock the cards in this deck!
Unlock Deck
Unlock Deck
1/133
Play
Full screen (f)
Deck 7: Statistics and Probability
1
The bar graph shows the expenditures of one city government in a recent year.
How much more is spent on Health than on Fire?
A)$4.3 million
B)$2.6 million
C)$1.1 million
D)$2.4 million
How much more is spent on Health than on Fire?
A)$4.3 million
B)$2.6 million
C)$1.1 million
D)$2.4 million
$1.1 million
2
The following pictograph shows the number of bicyclists who participated in the Labor Day weekend bicycle race for the
years 2003-2009. Use the graph to answer the question.
How many cyclists participated in 2003?
A)100 cyclists
B)90 cyclists
C)50 cyclists
D)65 cyclists
years 2003-2009. Use the graph to answer the question.
How many cyclists participated in 2003?
A)100 cyclists
B)90 cyclists
C)50 cyclists
D)65 cyclists
90 cyclists
3
The bar graph shows the number of tickets sold each week by the garden club for their annual flower show.
During which week were 19 tickets sold?
A)week 1
B)week 2
C)week 6
D)week 3
During which week were 19 tickets sold?
A)week 1
B)week 2
C)week 6
D)week 3
week 6
4
The bar graph shows the number of tickets sold each week by the garden club for their annual flower show.
How many tickets were sold in all?
A)205 tickets
B)215 tickets
C)105 tickets
D)195 tickets
How many tickets were sold in all?
A)205 tickets
B)215 tickets
C)105 tickets
D)195 tickets
Unlock Deck
Unlock for access to all 133 flashcards in this deck.
Unlock Deck
k this deck
5
Use the information given to draw a vertical bar graph. Clearly label the bars on the graph shown below.
Visitors of Jazz Festival
Visitors of Jazz Festival
Unlock Deck
Unlock for access to all 133 flashcards in this deck.
Unlock Deck
k this deck
6
The following pictograph shows the number of bicyclists who participated in the Labor Day weekend bicycle race for the
years 2003-2009. Use the graph to answer the question.
In what year did the greatest number of cyclists participate?
A)1997
B)2009
C)2007
D)1996
years 2003-2009. Use the graph to answer the question.
In what year did the greatest number of cyclists participate?
A)1997
B)2009
C)2007
D)1996
Unlock Deck
Unlock for access to all 133 flashcards in this deck.
Unlock Deck
k this deck
7
The following pictograph shows the number of bicyclists who participated in the Labor Day weekend bicycle race for the
years 2003-2009. Use the graph to answer the question.
Approximate the total number of cyclists who participated in 2005 and 2006.
A)150 cyclists
B)130 cyclists
C)160 cyclists
D)140 cyclists
years 2003-2009. Use the graph to answer the question.
Approximate the total number of cyclists who participated in 2005 and 2006.
A)150 cyclists
B)130 cyclists
C)160 cyclists
D)140 cyclists
Unlock Deck
Unlock for access to all 133 flashcards in this deck.
Unlock Deck
k this deck
8
The following pictograph shows the number of bicyclists who participated in the Labor Day weekend bicycle race for the
years 2003-2009. Use the graph to answer the question.
In what years was there an increase in the number of cyclists who participated in the race?
A)2003, 2005, 2009
B)2004, 2005, 2009
C)2004, 2006, 2007
D)2005, 2008, 2009
years 2003-2009. Use the graph to answer the question.
In what years was there an increase in the number of cyclists who participated in the race?
A)2003, 2005, 2009
B)2004, 2005, 2009
C)2004, 2006, 2007
D)2005, 2008, 2009
Unlock Deck
Unlock for access to all 133 flashcards in this deck.
Unlock Deck
k this deck
9
The bar graph shows the expenditures of one city government in a recent year.
Name the agency whose spending is between $3 million and $4 million and estimate its value.
A)Fire; $3.2 million
B)Fire; $4.3 million
C)Environment; $3.2 million
D)Environment; $4.3 million
Name the agency whose spending is between $3 million and $4 million and estimate its value.
A)Fire; $3.2 million
B)Fire; $4.3 million
C)Environment; $3.2 million
D)Environment; $4.3 million
Unlock Deck
Unlock for access to all 133 flashcards in this deck.
Unlock Deck
k this deck
10
The bar graph shows the number of tickets sold each week by the garden club for their annual flower show.
During which week was the fewest number of tickets sold?
A)week 6
B)week 5
C)week 2
D)week 4
During which week was the fewest number of tickets sold?
A)week 6
B)week 5
C)week 2
D)week 4
Unlock Deck
Unlock for access to all 133 flashcards in this deck.
Unlock Deck
k this deck
11
The following pictograph shows the number of bicyclists who participated in the Labor Day weekend bicycle race for the
years 2003-2009. Use the graph to answer the question.
What was the greatest number of cyclists to participate in any one year?
A)20 cyclists
B)50 cyclists
C)100 cyclists
D)120 cyclists
years 2003-2009. Use the graph to answer the question.
What was the greatest number of cyclists to participate in any one year?
A)20 cyclists
B)50 cyclists
C)100 cyclists
D)120 cyclists
Unlock Deck
Unlock for access to all 133 flashcards in this deck.
Unlock Deck
k this deck
12
The bar graph shows the expenditures of one city government in a recent year.
Name the agency with the smallest spending and estimate this value.
A)Environment; $3.2 million
B)All Other Agencies; $8.2 million
C)Human Resources; $24.2 million
D)Health; $5.4 million
Name the agency with the smallest spending and estimate this value.
A)Environment; $3.2 million
B)All Other Agencies; $8.2 million
C)Human Resources; $24.2 million
D)Health; $5.4 million
Unlock Deck
Unlock for access to all 133 flashcards in this deck.
Unlock Deck
k this deck
13
The histogram shows the scores of each participant in a game from a total of 100 participants.
How many participants scored 40-59?
A)38 participants
B)16 participants
C)3 participants
D)25 participants
How many participants scored 40-59?
A)38 participants
B)16 participants
C)3 participants
D)25 participants
Unlock Deck
Unlock for access to all 133 flashcards in this deck.
Unlock Deck
k this deck
14
The following pictograph shows the number of bicyclists who participated in the Labor Day weekend bicycle race for the
years 2003-2009. Use the graph to answer the question.
What was the increase in the number of participants from 2004 to 2005?
A)45 cyclists
B)30 cyclists
C)40 cyclists
D)35 cyclists
years 2003-2009. Use the graph to answer the question.
What was the increase in the number of participants from 2004 to 2005?
A)45 cyclists
B)30 cyclists
C)40 cyclists
D)35 cyclists
Unlock Deck
Unlock for access to all 133 flashcards in this deck.
Unlock Deck
k this deck
15
The bar graph shows the number of tickets sold each week by the garden club for their annual flower show.
How many more tickets were sold during week 6 than week 2?
A)30 tickets
B)13 tickets
C)8 tickets
D)18 tickets
How many more tickets were sold during week 6 than week 2?
A)30 tickets
B)13 tickets
C)8 tickets
D)18 tickets
Unlock Deck
Unlock for access to all 133 flashcards in this deck.
Unlock Deck
k this deck
16
The bar graph shows the number of tickets sold each week by the garden club for their annual flower show.
During which week was the most number of tickets sold?
A)week 5
B)week 2
C)week 1
D)week 4
During which week was the most number of tickets sold?
A)week 5
B)week 2
C)week 1
D)week 4
Unlock Deck
Unlock for access to all 133 flashcards in this deck.
Unlock Deck
k this deck
17
The following pictograph shows the number of bicyclists who participated in the Labor Day weekend bicycle race for the
years 2003-2009. Use the graph to answer the question.
In what years was there a decline in the number of cyclists who participated in the race?
A)2004, 2006
B)2004, 2006, 2007
C)2004, 2006, 2007, 2008
D)2005, 2008, 2009
years 2003-2009. Use the graph to answer the question.
In what years was there a decline in the number of cyclists who participated in the race?
A)2004, 2006
B)2004, 2006, 2007
C)2004, 2006, 2007, 2008
D)2005, 2008, 2009
Unlock Deck
Unlock for access to all 133 flashcards in this deck.
Unlock Deck
k this deck
18
The bar graph shows the number of tickets sold each week by the garden club for their annual flower show.
How many tickets were sold during week 5?
A)40 tickets
B)46 tickets
C)19 tickets
D)11 tickets
How many tickets were sold during week 5?
A)40 tickets
B)46 tickets
C)19 tickets
D)11 tickets
Unlock Deck
Unlock for access to all 133 flashcards in this deck.
Unlock Deck
k this deck
19
The following pictograph shows the number of bicyclists who participated in the Labor Day weekend bicycle race for the
years 2003-2009. Use the graph to answer the question.
In what year did 85 cyclists participate?
A)2004
B)2008
C)2009
D)2003
years 2003-2009. Use the graph to answer the question.
In what year did 85 cyclists participate?
A)2004
B)2008
C)2009
D)2003
Unlock Deck
Unlock for access to all 133 flashcards in this deck.
Unlock Deck
k this deck
20
Use the information given to draw a vertical bar graph. Clearly label the bars on the graph shown below.
Entree Choices of Customers During One Week
Entree Choices of Customers During One Week
Unlock Deck
Unlock for access to all 133 flashcards in this deck.
Unlock Deck
k this deck
21
The histogram shows the scores of each participant in a game from a total of 100 participants.
How many more participants scored 80-99 than 20-39?
A)16 participants
B)4 participants
C)32 participants
D)13 participants
How many more participants scored 80-99 than 20-39?
A)16 participants
B)4 participants
C)32 participants
D)13 participants
Unlock Deck
Unlock for access to all 133 flashcards in this deck.
Unlock Deck
k this deck
22
The circle graph shows the results of the student council presidential election. The complete circular area represents 100%
of the votes.
The circle graph shows what percent of the vote each person received. Who got the fewest votes?
A)Ben
B)Matt
C)Gina
D)Ted
of the votes.
The circle graph shows what percent of the vote each person received. Who got the fewest votes?A)Ben
B)Matt
C)Gina
D)Ted
Unlock Deck
Unlock for access to all 133 flashcards in this deck.
Unlock Deck
k this deck
23
The line graph shows the recorded hourly temperatures in degrees Fahrenheit at an airport.
At what time was the temperature its lowest?
A)9 a.m.
B)1 p.m.
C)6 p.m.
D)4 p.m.
At what time was the temperature its lowest?
A)9 a.m.
B)1 p.m.
C)6 p.m.
D)4 p.m.
Unlock Deck
Unlock for access to all 133 flashcards in this deck.
Unlock Deck
k this deck
24
The line graph shows the recorded hourly temperatures in degrees Fahrenheit at an airport.
During which hour did the temperature increase the most?
A)10 a.m. to 11 a.m.
B)9 a.m. to 10 a.m.
C)1 p.m. to 2 p.m.
D)12 p.m. to 1 p.m.
During which hour did the temperature increase the most?
A)10 a.m. to 11 a.m.
B)9 a.m. to 10 a.m.
C)1 p.m. to 2 p.m.
D)12 p.m. to 1 p.m.
Unlock Deck
Unlock for access to all 133 flashcards in this deck.
Unlock Deck
k this deck
25
The circle graph shows the results of the student council presidential election. The complete circular area represents 100%
of the votes.
The circle graph shows what percent of the vote each person received. Who got the most votes?
A)Jim
B)Ben
C)Ann
D)Matt
of the votes.
The circle graph shows what percent of the vote each person received. Who got the most votes?A)Jim
B)Ben
C)Ann
D)Matt
Unlock Deck
Unlock for access to all 133 flashcards in this deck.
Unlock Deck
k this deck
26
The line graph shows the recorded hourly temperatures in degrees Fahrenheit at an airport.
At what time was the temperature the highest?
A)11 a.m.
B)2 p.m.
C)1 p.m.
D)5 p.m.
At what time was the temperature the highest?
A)11 a.m.
B)2 p.m.
C)1 p.m.
D)5 p.m.
Unlock Deck
Unlock for access to all 133 flashcards in this deck.
Unlock Deck
k this deck
27
The circle graph shows the results of the student council presidential election. The complete circular area represents 100%
of the votes.
Student Council President The circle graph shows what percent of the vote each person received. Who received the second most number of votes?
A)Ben
B)Gina
C)Ming
D)Ted
of the votes.
Student Council President
The circle graph shows what percent of the vote each person received. Who received the second most number of votes?A)Ben
B)Gina
C)Ming
D)Ted
Unlock Deck
Unlock for access to all 133 flashcards in this deck.
Unlock Deck
k this deck
28
The list shows the scores for a basketball team. Use the list to complete the frequency distribution table and construct a histogram.
-
-
Unlock Deck
Unlock for access to all 133 flashcards in this deck.
Unlock Deck
k this deck
29
The histogram shows the scores of each participant in a game from a total of 100 participants.
How many participants scored fewer than 40?
A)18 participants
B)97 participants
C)81 participants
D)43 participants
How many participants scored fewer than 40?
A)18 participants
B)97 participants
C)81 participants
D)43 participants
Unlock Deck
Unlock for access to all 133 flashcards in this deck.
Unlock Deck
k this deck
30
Twenty teenagers were asked to give their current savings account balances. Use the balances shown in the list to
complete the frequency distribution table and construct a histogram.
complete the frequency distribution table and construct a histogram.
Unlock Deck
Unlock for access to all 133 flashcards in this deck.
Unlock Deck
k this deck
31
The circle graph shows the results of the student council presidential election. The complete circular area represents 100%
of the votes.
- The circle graph shows what percent of the vote each person received. Find the ratio of Ann's votes to Gina's votes.
A)
B)
C)
D)
of the votes.
-
The circle graph shows what percent of the vote each person received. Find the ratio of Ann's votes to Gina's votes.A)
B)
C)
D)
Unlock Deck
Unlock for access to all 133 flashcards in this deck.
Unlock Deck
k this deck
32
The histogram shows the scores of each participant in a game from a total of 100 participants.
-What is the ratio of participants who score 20-39 to the total number of participants?
A)
B)
C)
D)
-What is the ratio of participants who score 20-39 to the total number of participants?
A)
B)
C)
D)
Unlock Deck
Unlock for access to all 133 flashcards in this deck.
Unlock Deck
k this deck
33
The circle graph shows the results of the student council presidential election. The complete circular area represents 100%
of the votes.
- 300 total votes The circle graph shows what percent of the vote each person received.How many votes did Ted get?
A)60
B)42
C)96
D)102
of the votes.
-
300 total votes The circle graph shows what percent of the vote each person received.How many votes did Ted get?A)60
B)42
C)96
D)102
Unlock Deck
Unlock for access to all 133 flashcards in this deck.
Unlock Deck
k this deck
34
The circle graph shows the results of the student council presidential election. The complete circular area represents 100%
of the votes.
-Student Council President The circle graph shows what percent of the vote each person received. Find the ratio of Ming's votes to total votes cast.
A)
B)
C)
D)
of the votes.
-Student Council President
The circle graph shows what percent of the vote each person received. Find the ratio of Ming's votes to total votes cast.A)
B)
C)
D)
Unlock Deck
Unlock for access to all 133 flashcards in this deck.
Unlock Deck
k this deck
35
The double-line graph shows temperature highs and lows for a week.
What was the high temperature reading on Wednesday?
What was the high temperature reading on Wednesday?
Unlock Deck
Unlock for access to all 133 flashcards in this deck.
Unlock Deck
k this deck
36
The line graph shows the recorded hourly temperatures in degrees Fahrenheit at an airport.
During which two hour period did the temperature increase the most?
A)9 a.m. to 11 a.m.
B)10 a.m. to 11 a.m.
C)10 a.m. to 12 p.m.
D)12 p.m. to 2 p.m.
During which two hour period did the temperature increase the most?
A)9 a.m. to 11 a.m.
B)10 a.m. to 11 a.m.
C)10 a.m. to 12 p.m.
D)12 p.m. to 2 p.m.
Unlock Deck
Unlock for access to all 133 flashcards in this deck.
Unlock Deck
k this deck
37
The line graph shows the recorded hourly temperatures in degrees Fahrenheit at an airport.
What temperature was recorded at 1 p.m.?
A)77 ° F
B)80 ° F
C)79 ° F
D)81 ° F
What temperature was recorded at 1 p.m.?
A)77 ° F
B)80 ° F
C)79 ° F
D)81 ° F
Unlock Deck
Unlock for access to all 133 flashcards in this deck.
Unlock Deck
k this deck
38
The line graph shows the recorded hourly temperatures in degrees Fahrenheit at an airport.
At what time was the temperature 73°?
A)5 p.m.
B)9 a.m.
C)10 a.m.
D)10 a.m. and 11 a.m.
At what time was the temperature 73°?
A)5 p.m.
B)9 a.m.
C)10 a.m.
D)10 a.m. and 11 a.m.
Unlock Deck
Unlock for access to all 133 flashcards in this deck.
Unlock Deck
k this deck
39
The double-line graph shows temperature highs and lows for a week.
-On what day of the week was the difference between the high temperature and the low temperature the least? What was this difference in temperature?
-On what day of the week was the difference between the high temperature and the low temperature the least? What was this difference in temperature?
Unlock Deck
Unlock for access to all 133 flashcards in this deck.
Unlock Deck
k this deck
40
The circle graph shows the results of the student council presidential election. The complete circular area represents 100%
of the votes.
Student Council President The circle graph shows what percent of the vote each person received. What percent of the votes did Matt and Ben receive together?
A)22%
B)39%
C)61%
D)17%
of the votes.
Student Council President
The circle graph shows what percent of the vote each person received. What percent of the votes did Matt and Ben receive together?A)22%
B)39%
C)61%
D)17%
Unlock Deck
Unlock for access to all 133 flashcards in this deck.
Unlock Deck
k this deck
41
Fill in the table. Round to the nearest degree. Then draw a circle graph to represent the information given in the table.
Unlock Deck
Unlock for access to all 133 flashcards in this deck.
Unlock Deck
k this deck
42
Find the mean. If necessary, round to one decimal place.
5, 4, 10, 6, 12, 9
A)9.2
B)8.2
C)7.7
D)6.2
5, 4, 10, 6, 12, 9
A)9.2
B)8.2
C)7.7
D)6.2
Unlock Deck
Unlock for access to all 133 flashcards in this deck.
Unlock Deck
k this deck
43
The circle graph summarizes the results of a survey of the favorite movie category chosen by a group of adults.
-2400 adults answer the survey. Find the ratio of number of respondents who favor others to those who favor comedies. Write the ratio as a
Fraction with integers in the numerator and denominator.
A)
B)
C)
D)
-2400 adults answer the survey. Find the ratio of number of respondents who favor others to those who favor comedies. Write the ratio as a
Fraction with integers in the numerator and denominator.
A)
B)
C)
D)
Unlock Deck
Unlock for access to all 133 flashcards in this deck.
Unlock Deck
k this deck
44
Find the mean. If necessary, round to one decimal place.
18, 14, 8, 14, 8, 4, 4
A)11.5
B)10
C)11.7
D)9.5
18, 14, 8, 14, 8, 4, 4
A)11.5
B)10
C)11.7
D)9.5
Unlock Deck
Unlock for access to all 133 flashcards in this deck.
Unlock Deck
k this deck
45
The circle graph shows the results of the student council presidential election. The complete circular area represents 100%
of the votes.
Student Council President The circle graph shows what percent of the vote each person received. What percent of the votes did Ben NOT get?
A)72%
B)25%
C)75%
D)68%
of the votes.
Student Council President
The circle graph shows what percent of the vote each person received. What percent of the votes did Ben NOT get?A)72%
B)25%
C)75%
D)68%
Unlock Deck
Unlock for access to all 133 flashcards in this deck.
Unlock Deck
k this deck
46
The circle graph summarizes the results of a survey of the favorite movie category chosen by a group of adults.
1800 adults answer the survey. How many of the survey respondents said that they favor comedies? Round to the nearest whole.
A)3350 respondents
B)481 respondents
C)603 respondents
D)167 respondents
1800 adults answer the survey. How many of the survey respondents said that they favor comedies? Round to the nearest whole.
A)3350 respondents
B)481 respondents
C)603 respondents
D)167 respondents
Unlock Deck
Unlock for access to all 133 flashcards in this deck.
Unlock Deck
k this deck
47
Find the mean. If necessary, round to one decimal place.
5, 15, 13, 6, 15, 3, 9, 6
A)9
B)11
C)8
D)10.3
5, 15, 13, 6, 15, 3, 9, 6
A)9
B)11
C)8
D)10.3
Unlock Deck
Unlock for access to all 133 flashcards in this deck.
Unlock Deck
k this deck
48
Find the median. If necessary, round to one decimal place.
1, 8, 17, 21, 32, 33, 50
A)23.6
B)32
C)21
D)17
1, 8, 17, 21, 32, 33, 50
A)23.6
B)32
C)21
D)17
Unlock Deck
Unlock for access to all 133 flashcards in this deck.
Unlock Deck
k this deck
49
Find the mean. If necessary, round to one decimal place.
1.3, 0.7, 0.9, 1.3, 0.5, 1.5, 0.5, 1.6, 2
A)1.1
B)10.3
C)1
D)1.2
1.3, 0.7, 0.9, 1.3, 0.5, 1.5, 0.5, 1.6, 2
A)1.1
B)10.3
C)1
D)1.2
Unlock Deck
Unlock for access to all 133 flashcards in this deck.
Unlock Deck
k this deck
50
Find the mean. If necessary, round to one decimal place.
20, 7, 23, 20
A)18
B)17.5
C)25.7
D)16
20, 7, 23, 20
A)18
B)17.5
C)25.7
D)16
Unlock Deck
Unlock for access to all 133 flashcards in this deck.
Unlock Deck
k this deck
51
Find the median. If necessary, round to one decimal place.
2, 2, 22, 13, 28, 42, 39, 32
A)22.5
B)28
C)25
D)22
2, 2, 22, 13, 28, 42, 39, 32
A)22.5
B)28
C)25
D)22
Unlock Deck
Unlock for access to all 133 flashcards in this deck.
Unlock Deck
k this deck
52
The circle graph shows the results of the student council presidential election. The complete circular area represents 100%
of the votes.
Student Council President The circle graph shows what percent of the vote each person received. What percent of the votes did Ben NOT get?
A)85%
B)15%
C)72%
D)68%
of the votes.
Student Council President
The circle graph shows what percent of the vote each person received. What percent of the votes did Ben NOT get?A)85%
B)15%
C)72%
D)68%
Unlock Deck
Unlock for access to all 133 flashcards in this deck.
Unlock Deck
k this deck
53
Find the median. If necessary, round to one decimal place.
8, 12, 25, 23, 41, 49
A)22.5
B)25
C)23
D)24
8, 12, 25, 23, 41, 49
A)22.5
B)25
C)23
D)24
Unlock Deck
Unlock for access to all 133 flashcards in this deck.
Unlock Deck
k this deck
54
Find the mean. If necessary, round to one decimal place.
19, 41, 83, 20, 115, 63
A)56.8
B)68.2
C)57.3
D)56.3
19, 41, 83, 20, 115, 63
A)56.8
B)68.2
C)57.3
D)56.3
Unlock Deck
Unlock for access to all 133 flashcards in this deck.
Unlock Deck
k this deck
55
Find the mean. If necessary, round to one decimal place.
76, 46, 76, 99, 46
A)69.1
B)85.8
C)68.6
D)68.1
76, 46, 76, 99, 46
A)69.1
B)85.8
C)68.6
D)68.1
Unlock Deck
Unlock for access to all 133 flashcards in this deck.
Unlock Deck
k this deck
56
Find the mean. If necessary, round to one decimal place.
154, 117, 245, 150
A)222
B)166
C)166.5
D)167
154, 117, 245, 150
A)222
B)166
C)166.5
D)167
Unlock Deck
Unlock for access to all 133 flashcards in this deck.
Unlock Deck
k this deck
57
Fill in the table. Round to the nearest degree. Then draw a circle graph to represent the information given in the table.
Unlock Deck
Unlock for access to all 133 flashcards in this deck.
Unlock Deck
k this deck
58
Find the median. If necessary, round to one decimal place.
9, 4, 21, 13, 47, 42, 37
A)37
B)21
C)13
D)25.2
9, 4, 21, 13, 47, 42, 37
A)37
B)21
C)13
D)25.2
Unlock Deck
Unlock for access to all 133 flashcards in this deck.
Unlock Deck
k this deck
59
The circle graph shows the results of the student council presidential election. The complete circular area represents 100%
of the votes.
Student Council President The circle graph shows what percent of the vote each person received. How many people voted for someone other than Ben?
A)182
B)518
C)560
D)525
of the votes.
Student Council President
The circle graph shows what percent of the vote each person received. How many people voted for someone other than Ben?A)182
B)518
C)560
D)525
Unlock Deck
Unlock for access to all 133 flashcards in this deck.
Unlock Deck
k this deck
60
Find the median. If necessary, round to one decimal place.
14, 14, 31, 50, 66, 75, 77
A)31
B)47.2
C)50
D)66
14, 14, 31, 50, 66, 75, 77
A)31
B)47.2
C)50
D)66
Unlock Deck
Unlock for access to all 133 flashcards in this deck.
Unlock Deck
k this deck
61
Draw a tree diagram to find the number of possible outcomes.
Pick a number from 1, 2, 3 or 4, and then toss a coin.
A)8 outcomes
B)2 outcomes
C)6 outcomes
D)1 outcome
Pick a number from 1, 2, 3 or 4, and then toss a coin.
A)8 outcomes
B)2 outcomes
C)6 outcomes
D)1 outcome
Unlock Deck
Unlock for access to all 133 flashcards in this deck.
Unlock Deck
k this deck
62
Find the mode or modes (if any).
91, 34, 32, 34, 29, 91
A)91
B)51.8
C)34
D)91, 34
91, 34, 32, 34, 29, 91
A)91
B)51.8
C)34
D)91, 34
Unlock Deck
Unlock for access to all 133 flashcards in this deck.
Unlock Deck
k this deck
63
Find the mode or modes (if any).
7.05, 7.41, 7.56, 7.05, 7.88, 7.99, 7.62
A)7.56
B)7.509
C)7.05
D)7.41
7.05, 7.41, 7.56, 7.05, 7.88, 7.99, 7.62
A)7.56
B)7.509
C)7.05
D)7.41
Unlock Deck
Unlock for access to all 133 flashcards in this deck.
Unlock Deck
k this deck
64
Find the probability of the event.
-If a single die is tossed once, find the probability of the following event. A 4
A)
B)0
C)4
D)
-If a single die is tossed once, find the probability of the following event. A 4
A)
B)0
C)4
D)
Unlock Deck
Unlock for access to all 133 flashcards in this deck.
Unlock Deck
k this deck
65
Solve. If necessary, round answers to the nearest hundredth.
-The grades are given for a student for a particular semester. Find the grade point average. The point values of grades are given below.
A)1.8
B)8
C)1.75
D)1.6
-The grades are given for a student for a particular semester. Find the grade point average. The point values of grades are given below.
A)1.8
B)8
C)1.75
D)1.6
Unlock Deck
Unlock for access to all 133 flashcards in this deck.
Unlock Deck
k this deck
66
Find the mode or modes (if any).
20, 38, 46, 38, 49, 38, 49
A)38
B)49
C)46
D)39.7
20, 38, 46, 38, 49, 38, 49
A)38
B)49
C)46
D)39.7
Unlock Deck
Unlock for access to all 133 flashcards in this deck.
Unlock Deck
k this deck
67
Draw a tree diagram to find the number of possible outcomes.
Toss two coins.
A)2 outcomes
B)1 outcome
C)4 outcomes
D)3 outcomes
Toss two coins.
A)2 outcomes
B)1 outcome
C)4 outcomes
D)3 outcomes
Unlock Deck
Unlock for access to all 133 flashcards in this deck.
Unlock Deck
k this deck
68
Draw a tree diagram to find the number of possible outcomes.
Toss two six-sided dice.
A)36 outcomes
B)2 outcomes
C)12 outcomes
D)1 outcome
Toss two six-sided dice.
A)36 outcomes
B)2 outcomes
C)12 outcomes
D)1 outcome
Unlock Deck
Unlock for access to all 133 flashcards in this deck.
Unlock Deck
k this deck
69
Draw a tree diagram to find the number of possible outcomes.
Toss three coins.
A)1 outcome
B)3 outcomes
C)8 outcomes
D)6 outcomes
Toss three coins.
A)1 outcome
B)3 outcomes
C)8 outcomes
D)6 outcomes
Unlock Deck
Unlock for access to all 133 flashcards in this deck.
Unlock Deck
k this deck
70
Solve. If necessary, round answers to the nearest hundredth.
The following test scores were recorded for a student: 80, 72, 68, 68, 80, 82. Find the mean, median, and mode.
A)mean: 76 median: 76 mode: 68
B)mean: 76 median: 75 mode: 80
C)mean: 75 median: 76 mode: 68 and 80
D)mean: 75 median: 68 mode: 82
The following test scores were recorded for a student: 80, 72, 68, 68, 80, 82. Find the mean, median, and mode.
A)mean: 76 median: 76 mode: 68
B)mean: 76 median: 75 mode: 80
C)mean: 75 median: 76 mode: 68 and 80
D)mean: 75 median: 68 mode: 82
Unlock Deck
Unlock for access to all 133 flashcards in this deck.
Unlock Deck
k this deck
71
Solve. If necessary, round answers to the nearest hundredth.
The following test scores were recorded for a student: 98, 55, 96, 55, 81. Find the mean, median, and mode.
A)mean: 77 median: 81 mode: 98
B)mean: 77 median: 81 mode: 55
C)mean: 82.5 median: 96 mode: 98
D)mean: 96.3 median: 88.5 mode: 55
The following test scores were recorded for a student: 98, 55, 96, 55, 81. Find the mean, median, and mode.
A)mean: 77 median: 81 mode: 98
B)mean: 77 median: 81 mode: 55
C)mean: 82.5 median: 96 mode: 98
D)mean: 96.3 median: 88.5 mode: 55
Unlock Deck
Unlock for access to all 133 flashcards in this deck.
Unlock Deck
k this deck
72
Find the median. If necessary, round to one decimal place.
48, 19, 6, 5, 24, 16, 23, 47, 40, 33
A)24
B)23
C)26.1
D)23.5
48, 19, 6, 5, 24, 16, 23, 47, 40, 33
A)24
B)23
C)26.1
D)23.5
Unlock Deck
Unlock for access to all 133 flashcards in this deck.
Unlock Deck
k this deck
73
Draw a tree diagram to find the number of possible outcomes.
Toss a single die, and then toss a coin.
A)12 outcomes
B)8 outcomes
C)6 outcomes
D)2 outcomes
Toss a single die, and then toss a coin.
A)12 outcomes
B)8 outcomes
C)6 outcomes
D)2 outcomes
Unlock Deck
Unlock for access to all 133 flashcards in this deck.
Unlock Deck
k this deck
74
Find the mode or modes (if any).
1.5, 0.5, 0.7, 1.5, 0.3, 1.7, 0.3, 1.8, 2.2
A)0.3 and 1.5
B)1.2
C)1.5
D)0.3
1.5, 0.5, 0.7, 1.5, 0.3, 1.7, 0.3, 1.8, 2.2
A)0.3 and 1.5
B)1.2
C)1.5
D)0.3
Unlock Deck
Unlock for access to all 133 flashcards in this deck.
Unlock Deck
k this deck
75
Find the median. If necessary, round to one decimal place.
1.5, 0.5, 0.7, 1.5, 0.3, 1.7, 0.3, 1.8, 2.2
A)1.2
B)1.5
C)1.1
D)0.8
1.5, 0.5, 0.7, 1.5, 0.3, 1.7, 0.3, 1.8, 2.2
A)1.2
B)1.5
C)1.1
D)0.8
Unlock Deck
Unlock for access to all 133 flashcards in this deck.
Unlock Deck
k this deck
76
Solve. If necessary, round answers to the nearest hundredth.
The following test scores were recorded for a student: 100, 95, 93, 89, 95, 81, 91. Find the mean, median, and mode.
A)mean: 92 median: 93 mode: 95
B)mean: 93 median: 89 mode: 95
C)mean: 92 median: 89 mode: 100
D)mean: 93 median: 92 mode: 100
The following test scores were recorded for a student: 100, 95, 93, 89, 95, 81, 91. Find the mean, median, and mode.
A)mean: 92 median: 93 mode: 95
B)mean: 93 median: 89 mode: 95
C)mean: 92 median: 89 mode: 100
D)mean: 93 median: 92 mode: 100
Unlock Deck
Unlock for access to all 133 flashcards in this deck.
Unlock Deck
k this deck
77
Find the mode or modes (if any).
86, 25, 86, 13, 25, 29, 56, 86
A)42.5
B)50.8
C)86
D)no mode
86, 25, 86, 13, 25, 29, 56, 86
A)42.5
B)50.8
C)86
D)no mode
Unlock Deck
Unlock for access to all 133 flashcards in this deck.
Unlock Deck
k this deck
78
Solve. If necessary, round answers to the nearest hundredth.
The following test scores were recorded for a student: 71, 68, 66, 65, 74, 70. Find the mean, median, and mode.
A)mean: 68 median: none mode: none
B)mean: 70 median: none mode: 74
C)mean: 69 median: 65 mode: 74
D)mean: 69 median: 69 mode: none
The following test scores were recorded for a student: 71, 68, 66, 65, 74, 70. Find the mean, median, and mode.
A)mean: 68 median: none mode: none
B)mean: 70 median: none mode: 74
C)mean: 69 median: 65 mode: 74
D)mean: 69 median: 69 mode: none
Unlock Deck
Unlock for access to all 133 flashcards in this deck.
Unlock Deck
k this deck
79
Draw a tree diagram to find the number of possible outcomes.
Choose a number, 1, 2, 3, 4, and then a vowel, a,e,i,o,u.
A)16 outcomes
B)9 outcomes
C)20 outcomes
D)5 outcomes
Choose a number, 1, 2, 3, 4, and then a vowel, a,e,i,o,u.
A)16 outcomes
B)9 outcomes
C)20 outcomes
D)5 outcomes
Unlock Deck
Unlock for access to all 133 flashcards in this deck.
Unlock Deck
k this deck
80
Find the mode or modes (if any).
5, 9, 18, 3, 2, 8, 96, 1, 4, 16
A)8
B)15.6
C)9
D)no mode
5, 9, 18, 3, 2, 8, 96, 1, 4, 16
A)8
B)15.6
C)9
D)no mode
Unlock Deck
Unlock for access to all 133 flashcards in this deck.
Unlock Deck
k this deck
Unlock Deck
Unlock for access to all 133 flashcards in this deck.


