Exam 7: Statistics and Probability
Exam 1: The Whole Numbers360 Questions
Exam 2: Multiplying and Dividing Fractions234 Questions
Exam 3: Adding and Subtracting Fractions157 Questions
Exam 4: Decimals271 Questions
Exam 5: Ratio, Proportion, and Percent297 Questions
Exam 6: Geometry280 Questions
Exam 7: Statistics and Probability133 Questions
Exam 8: Real Numbers and Introduction to Algebra483 Questions
Exam 9: Equations, Inequalities, and Problem Solving224 Questions
Exam 10: Graphing Equations and Inequalities312 Questions
Exam 11: Systems of Equations111 Questions
Exam 12: Exponents and Polynomials386 Questions
Exam 13: Factoring Polynomials233 Questions
Exam 14: Rational Expressions249 Questions
Exam 15: Roots and Radicals220 Questions
Exam 16: Quadratic Equations and Nonlinear Graphs198 Questions
Exam 17: Algebraic Equations and Inequalities199 Questions
Select questions type
The circle graph shows the results of the student council presidential election. The complete circular area represents 100%
of the votes.
-Student Council President 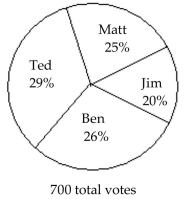 The circle graph shows what percent of the vote each person received. How many people voted for someone other than Ben?
Free
(Multiple Choice)
4.9/5  (37)
(37)
Correct Answer: Verified
B
The bar graph shows the number of tickets sold each week by the garden club for their annual flower show. 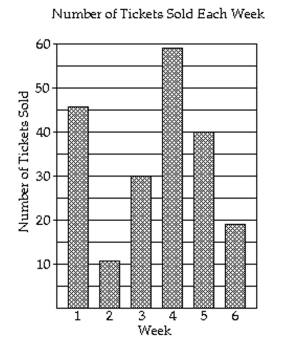 -During which week was the most number of tickets sold?
Free
(Multiple Choice)
4.9/5 (35)
Correct Answer:Verified
D
Draw a tree diagram to find the number of possible outcomes.
-Toss two coins.
Free
(Multiple Choice)
4.7/5 (26)
Correct Answer:Verified
C
The line graph shows the recorded hourly temperatures in degrees Fahrenheit at an airport. 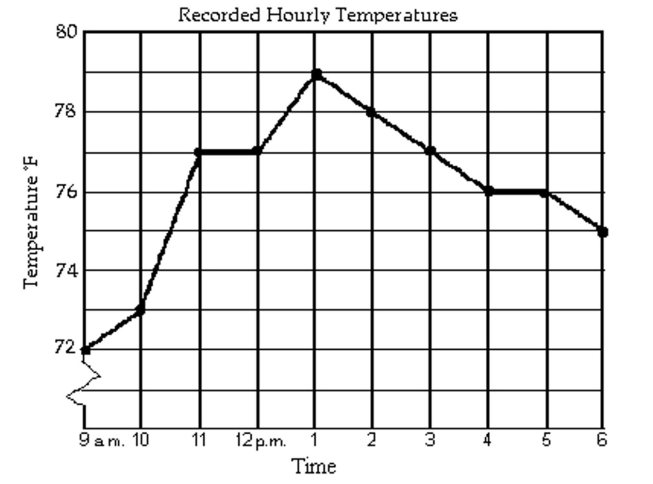 -During which hour did the temperature increase the most?
(Multiple Choice)
4.9/5 (39)
Find the probability of the event.
-Two dice are rolled. What is the probability that the sum of the two numbers on the dice will be greater than 9?
(Multiple Choice)
4.8/5 (41)
The circle graph shows the results of the student council presidential election. The complete circular area represents 100%
of the votes.
-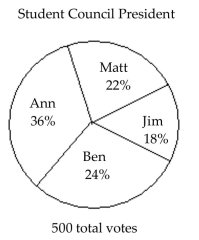 The circle graph shows what percent of the vote each person received. Who got the most votes?
(Multiple Choice)
4.9/5 (31)
The line graph shows the recorded hourly temperatures in degrees Fahrenheit at an airport. 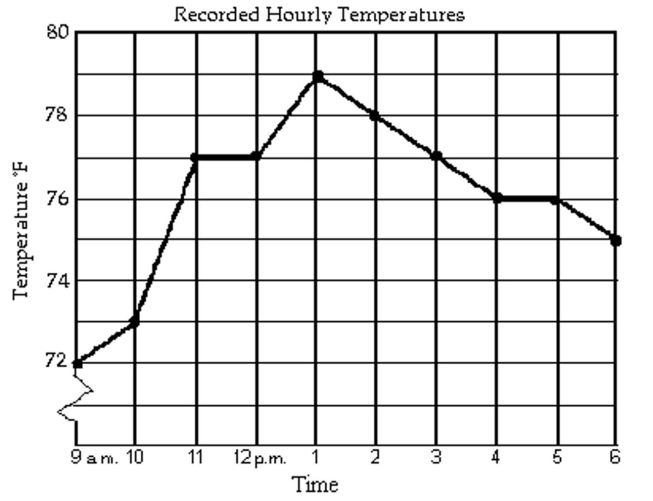 -What temperature was recorded at 4 p.m.?
(Multiple Choice)
4.9/5 (36)
The line graph shows the recorded hourly temperatures in degrees Fahrenheit at an airport.
-At what time was the temperature its lowest?
(Multiple Choice)
4.8/5 (36)
The circle graph shows the results of the student council presidential election. The complete circular area represents 100%
of the votes.
-Student Council President 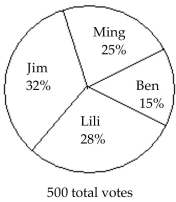 The circle graph shows what percent of the vote each person received. What percent of the votes did Ben NOT get?
(Multiple Choice)
4.8/5 (41)
The circle graph summarizes the results of a survey of the favorite movie category chosen by a group of adults. 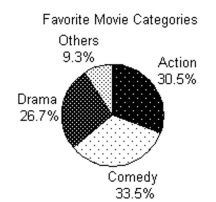 -2400 adults answer the survey. Find the ratio of number of respondents who favor others to those who favor comedies. Write the ratio as a
Fraction with integers in the numerator and denominator.
-2400 adults answer the survey. Find the ratio of number of respondents who favor others to those who favor comedies. Write the ratio as a
Fraction with integers in the numerator and denominator.
(Multiple Choice)
4.8/5 (45)
Find the probability of the event if a single choice is made from a bag.
-A bag contains 27 balls numbered 1 through 27. What is the probability of choosing a ball numbered 28?
(Multiple Choice)
5.0/5 (38)
The following circle graph displays Chris and Mary Smith's monthly $2900 family budget. Use the circle graph to answer
the question. 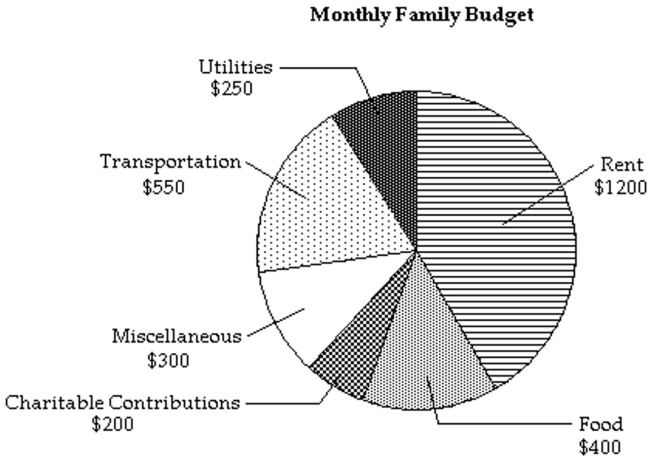 -What is the ratio of money spent on food to money spent on utilities?
(Multiple Choice)
4.7/5 (47)
The bar graph shows the number of students who flunk Dr. Jones' class each year. 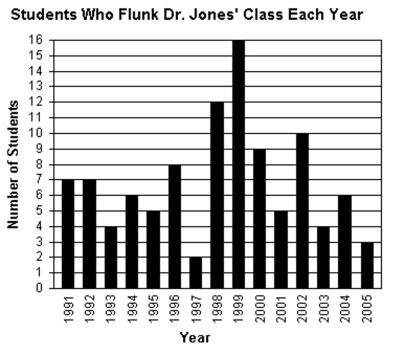 -During which year did Dr. Jones' have the fewest number of students flunk his class? How many students flunked during that year?
(Multiple Choice)
4.8/5 (35)
Fill in the blank with one of the words or phrases listed below. outcomes bar experiment mean tree diagram pictograph line class interval median probability histogram circle class frequency mode
-The _______of an event isvent is
(Multiple Choice)
4.8/5 (37)
The pictograph shows the number of bicycles sold at Mountain Biking Mania for a 7-week period. Number of Bicycles Sold at Mountain Biking Mania
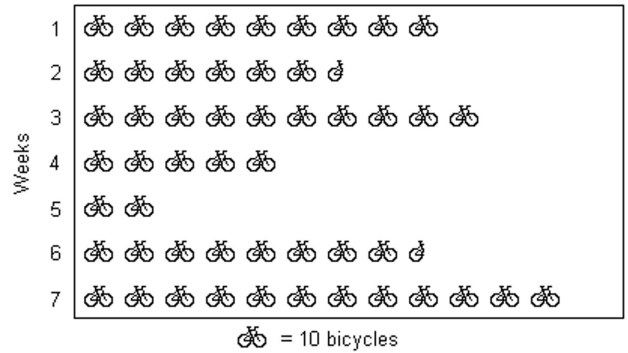 -During which week was the least number of bicycles sold? How many bicycles were sold that week?
(Multiple Choice)
4.8/5 (41)
The circle graph shows the results of the student council presidential election. The complete circular area represents 100%
of the votes.
-Student Council President 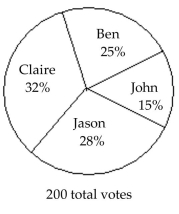 The circle graph shows what percent of the vote each person received. What percent of the votes did Ben NOT get?
(Multiple Choice)
5.0/5 (42)
The bar graph shows the number of students who flunk Dr. Jones' class each year.
-During which year(s)did Dr. Jones' have more than 8 students flunk his class?
(Multiple Choice)
4.9/5 (39)
Find the median. If necessary, round to one decimal place.
-1, 8, 17, 21, 32, 33, 50
(Multiple Choice)
4.9/5 (44)
The bar graph shows the expenditures of one city government in a recent year. 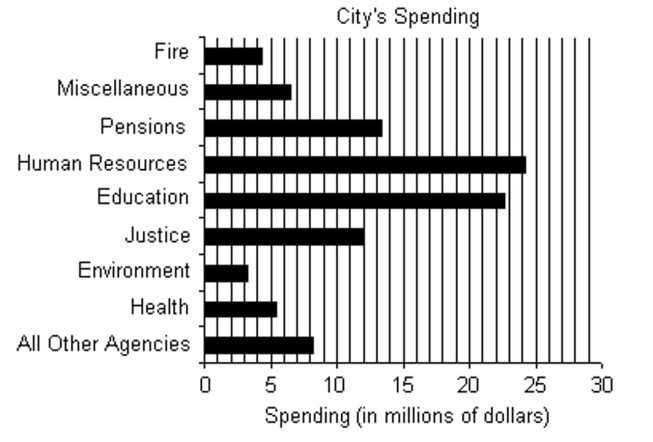 -Name the agency with the smallest spending and estimate this value.
(Multiple Choice)
4.7/5 (35)
Solve. If necessary, round answers to the nearest hundredth.
-The following test scores were recorded for a student: 98, 55, 96, 55, 81. Find the mean, median, and mode.
(Multiple Choice)
4.8/5 (37)
Filters
- Essay(0)
- Multiple Choice(0)
- Short Answer(0)
- True False(0)
- Matching(0)