Deck 8: Functions and Their Graphs
Full screen (f)
Question
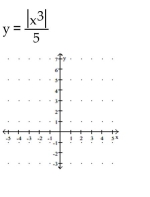
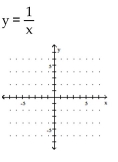
Use a calculator to obtain at least eight points that are solutions to the equation. Then graph the equation by plotting
points.
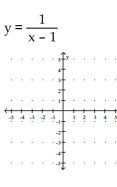
points.
Question
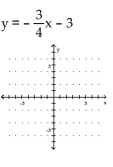
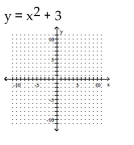
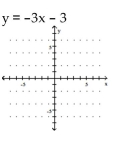
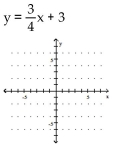
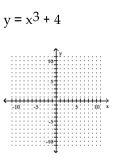
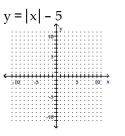
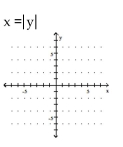
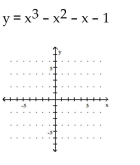
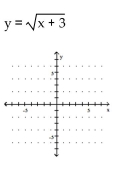
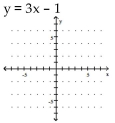
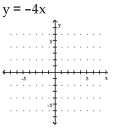
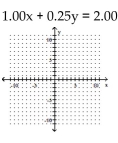
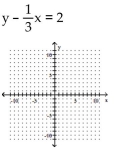
Graph the equation.
A)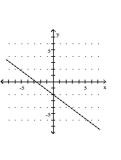
B)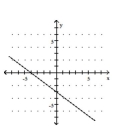
C)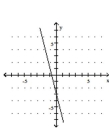
D)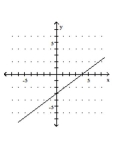
A)
B)
C)
D)
Question
Question
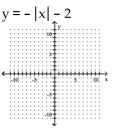
Graph the equation.
A)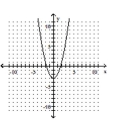
B)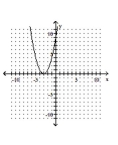
C)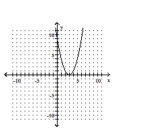
D)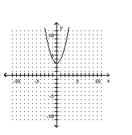
A)
B)
C)
D)
Question
Solve the problem.
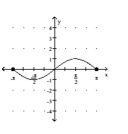
Mark started out by walking up a hill for 5 minutes. For the next 5 minutes he walked down a steep hill to an elevation lower than his starting point. For the next 10 minutes he walked on level ground. For the next 10
Minutes he walked uphill. Determine which graph of elevation above sea level versus time matches the given
Situation.
A)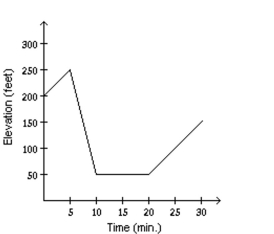
B)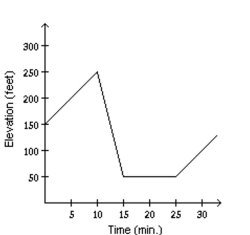
C)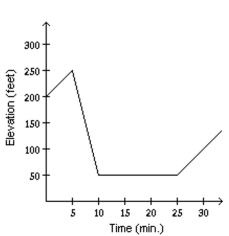
D)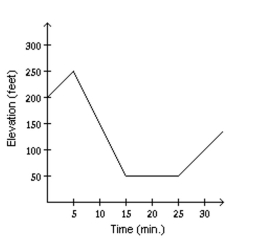
Question
The graph below shows the percentage of students enrolled in the College of Engineering at State University. Use the
graph to answer the question.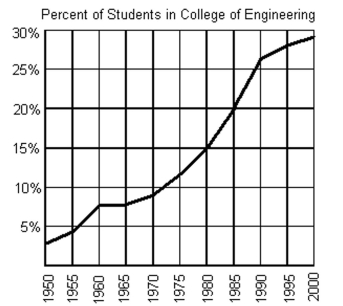
In what year were 20% of the students at State University enrolled in the College of Engineering?
A) 1990
B) 1975
C) 1980
D) 1985
graph to answer the question.
In what year were 20% of the students at State University enrolled in the College of Engineering?
A) 1990
B) 1975
C) 1980
D) 1985
Question
Graph the equation.
A)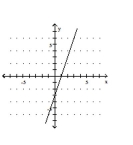
B)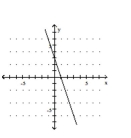
C)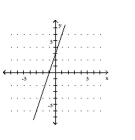
D)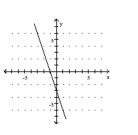
A)
B)
C)
D)
Question
Graph the equation.
A)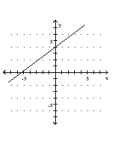
B)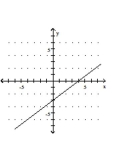
C)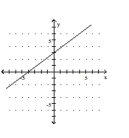
D)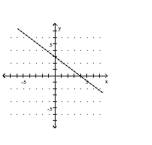
A)
B)
C)
D)
Question
Graph the equation.
A)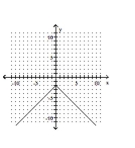
B)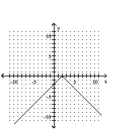
C)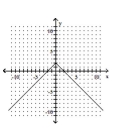
D)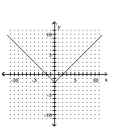
A)
B)
C)
D)
Question
Graph the equation.
A)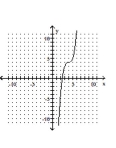
B)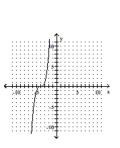
C)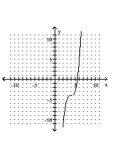
D)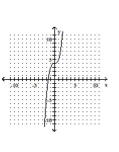
A)
B)
C)
D)
Question
Use a calculator to obtain at least eight points that are solutions to the equation. Then graph the equation by plotting
points.
points.
Question
The graph below shows the percentage of students enrolled in the College of Engineering at State University. Use the
graph to answer the question.
What percentage of the students at State University were enrolled in the College of Engineering in 1965?
A) approximately 4%
B) approximately 7.5%
C) approximately 9.5%
D) approximately 2.5%
graph to answer the question.
What percentage of the students at State University were enrolled in the College of Engineering in 1965?
A) approximately 4%
B) approximately 7.5%
C) approximately 9.5%
D) approximately 2.5%
Question
Graph the equation.
A)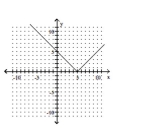
B)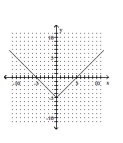
C)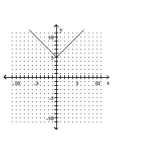
D)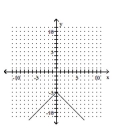
A)
B)
C)
D)
Question
Graph the equation.
A)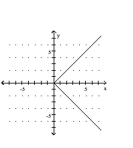
B)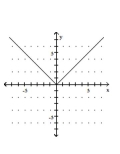
C)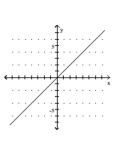
D)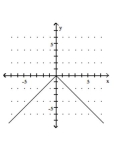
A)
B)
C)
D)
Question
List the set in roster form.

A)
B) {1, 2, 3, 4}
C) {2, 3}
D) { }
A)
B) {1, 2, 3, 4}
C) {2, 3}
D) { }
Question
Use a calculator to obtain at least eight points that are solutions to the equation. Then graph the equation by plotting
points.
points.
Question
Graph the equation.
A)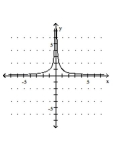
B)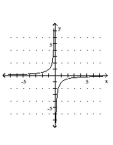
C)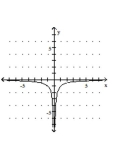
D)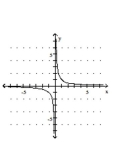
A)
B)
C)
D)
Question
Use a calculator to obtain at least eight points that are solutions to the equation. Then graph the equation by plotting
points.
points.
Question
Solve the problem.
A freight train traveled at a speed of 50 mph for 3 hours, then stayed in a station for 1 hour, and then traveled 30 mph for 2 hours. Make a graph of distance traveled versus time to match the given situation.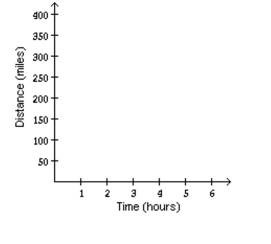
A)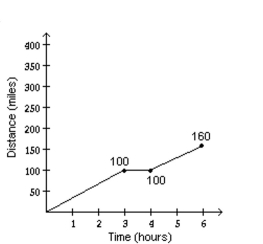
B)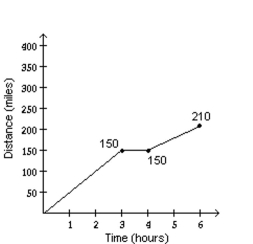
C)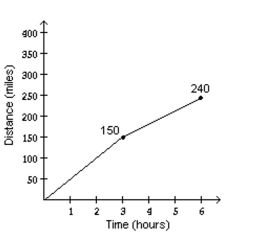
D)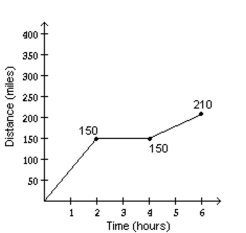
A freight train traveled at a speed of 50 mph for 3 hours, then stayed in a station for 1 hour, and then traveled 30 mph for 2 hours. Make a graph of distance traveled versus time to match the given situation.
A)
B)
C)
D)
Question
Graph the equation.
A)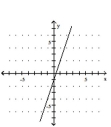
B)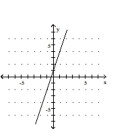
C)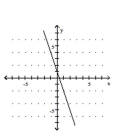
D)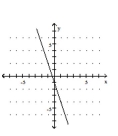
A)
B)
C)
D)
Question
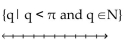
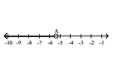
Express in set builder notation the set of numbers indicated on the number line.
A)
B)
C)
D)
A)
B)
C)
D)
Question
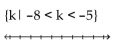
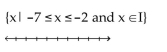
Illustrate the set on a number line.
A)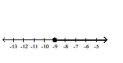
B)
C)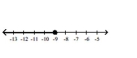
D)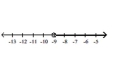
A)
B)
C)
D)
Question
Question
Illustrate the set on a number line.
A)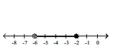
B)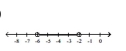
C)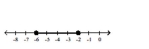
D)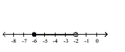
A)
B)
C)
D)
Question
Question
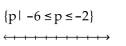
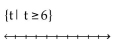
Illustrate the set on a number line.
A)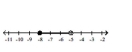
B)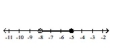
C)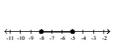
D)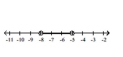
A)
B)
C)
D)
Question
Illustrate the set on a number line.
A)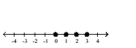
B)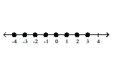
C)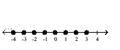
D)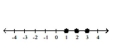
A)
B)
C)
D)
Question
Illustrate the set on a number line.
A)
B)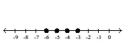
C)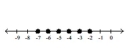
D)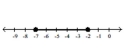
A)
B)
C)
D)
Question
Question
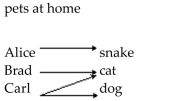
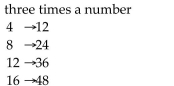
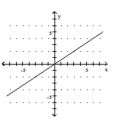
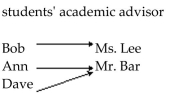
Determine if the relation illustrated is a function. Give the domain and range of the function or relation.
A)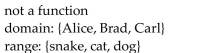
B)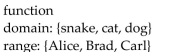
C)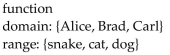
D)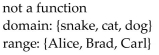
A)
B)
C)
D)
Question
List the set in roster form.
S = {x| x is and integer between 4 and 5}
A) {4}
B) {4, 5}
C)
D) { }
S = {x| x is and integer between 4 and 5}
A) {4}
B) {4, 5}
C)
D) { }
Question
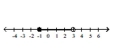
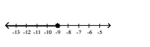
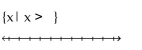
Express in set builder notation the set of numbers indicated on the number line.
 A = -5.4
A)
B) {x| x > -5.4}
C) {x| x < -5.4}
D)
A = -5.4A)
B) {x| x > -5.4}
C) {x| x < -5.4}
D)
Question
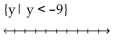
Express in set builder notation the set of numbers indicated on the number line.
A) {x| x > -9}
B) {x| x < -9}
C)
D)
A) {x| x > -9}
B) {x| x < -9}
C)
D)
Question
Question
Illustrate the set on a number line.
A)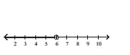
B)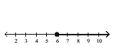
C)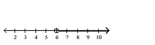
D)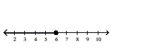
A)
B)
C)
D)
Question
Question
Question
Illustrate the set on a number line.
A)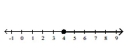
B)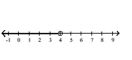
C)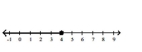
D)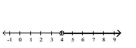
A)
B)
C)
D)
Question
Determine if the relation illustrated is a function. Give the domain and range of the function or relation.
A)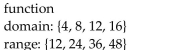
B)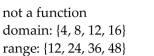
C)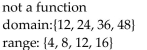
D)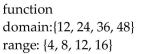
A)
B)
C)
D)
Question
Question
Question
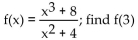
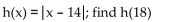
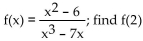
Evaluate the function for the indicated value.
A)
B)
C)
D)
A)
B)
C)
D)
Question
Solve the problem.
The formula for the volume of a right circular cylinder is . If the height is 19 m, then the volume is a function of the radius, r. Write the function using function notation, where the height is 19. Determine the
Volume if the radius is 11 m.
A)
B)
C)
D)
The formula for the volume of a right circular cylinder is
. If the height is 19 m, then the volume is a function of the radius, r. Write the function using function notation, where the height is 19. Determine theVolume if the radius is 11 m.
A)
B)
C)
D)
Question
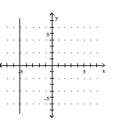
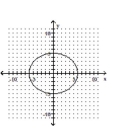
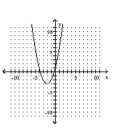
Determine whether the graph illustrated represents a function. Give the domain and range of the relation or function.
A)
B)
C)
D)
A)
B)
C)
D)
Question
Evaluate the function for the indicated value.
A) -32
B) 4
C) 32
D) -4
A) -32
B) 4
C) 32
D) -4
Question
Determine if the relation illustrated is a function. Give the domain and range of the function or relation.
{(-1, -3), (-1, -2), (-1, 0), (3, 2), (15, 4)}
A)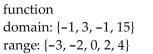
B)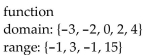
C)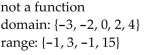
D)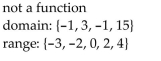
{(-1, -3), (-1, -2), (-1, 0), (3, 2), (15, 4)}
A)
B)
C)
D)
Question
The graph below shows the percentage of students enrolled in the College of Engineering at State University. Use the
graph to answer the question.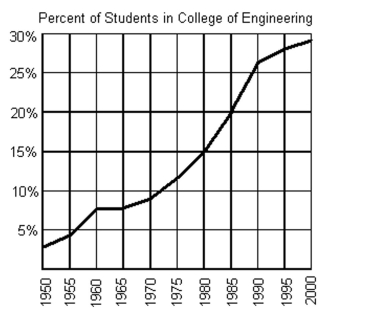
Does the graph represent a function?
A) no
B) yes
graph to answer the question.
Does the graph represent a function?
A) no
B) yes
Question
Determine if the relation illustrated is a function. Give the domain and range of the function or relation.
A)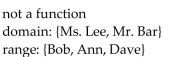
B)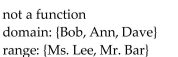
C)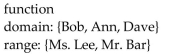
D)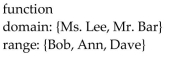
A)
B)
C)
D)
Question
Determine whether the graph illustrated represents a function. Give the domain and range of the relation or function.
A)
B)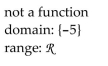
C)
D)
A)
B)
C)
D)
Question
Determine if the relation illustrated is a function. Give the domain and range of the function or relation.
{(-4, 11), (-3, 4), (0, -5), (3, 4), (5, 20)}
A)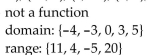
B)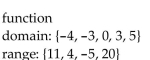
C)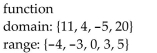
D)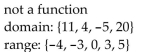
{(-4, 11), (-3, 4), (0, -5), (3, 4), (5, 20)}
A)
B)
C)
D)
Question
Determine whether the graph illustrated represents a function. Give the domain and range of the relation or function.
A)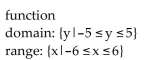
B)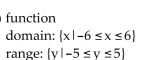
C)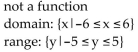
D)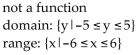
A)
B)
C)
D)
Question
Evaluate the function for the indicated value.
A)
B)
C)
D) - 2
A)
B)
C)
D) - 2
Question
Solve the problem.
The formula for the circumference of a circle is The circumference is a function of the radius. Write the function using function notation. Determine the circumference when the radius is 4 mi.
A)
B)
C)
D)
The formula for the circumference of a circle is
The circumference is a function of the radius. Write the function using function notation. Determine the circumference when the radius is 4 mi.A)
B)
C)
D)
Question
Solve the problem.
The formula for changing Celsius temperature to Fahrenheit temperature is The Fahrenheit temperature is a function of the Celsius temperature. Write the function in function notation. Find the
Fahrenheit temperature that corresponds to 20° C.
A)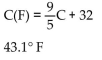
B)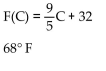
C)
D)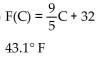
The formula for changing Celsius temperature to Fahrenheit temperature is
The Fahrenheit temperature is a function of the Celsius temperature. Write the function in function notation. Find theFahrenheit temperature that corresponds to 20° C.
A)
B)
C)
D)
Question
Determine whether the graph illustrated represents a function. Give the domain and range of the relation or function.
A)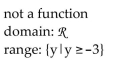
B)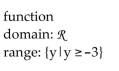
C)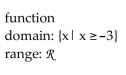
D)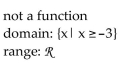
A)
B)
C)
D)
Question
Solve the problem.
The formula for the area of a parallelogram is A = bh. If the base measures 29 inches, the area is a function of the altitude, h. Write the function in function notation where the base is 29. Determine the area of the parallelogram
When the altitude is 30 inches.
A)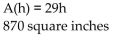
B)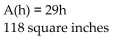
C)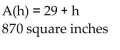
D)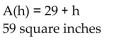
The formula for the area of a parallelogram is A = bh. If the base measures 29 inches, the area is a function of the altitude, h. Write the function in function notation where the base is 29. Determine the area of the parallelogram
When the altitude is 30 inches.
A)
B)
C)
D)
Question
Determine whether the graph illustrated represents a function. Give the domain and range of the relation or function.
A)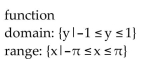
B)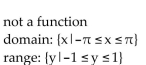
C)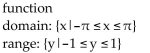
D)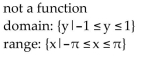
A)
B)
C)
D)
Question
Evaluate the function for the indicated value.
A) -57
B) 4
C) 2
D) -4
A) -57
B) 4
C) 2
D) -4
Question
The graph below shows the percentage of students enrolled in the College of Engineering at State University. Use the
graph to answer the question.
If f represents the function, find f(2000).
A) approximately 24%
B) approximately 25.5%
C) approximately 29%
D) approximately 31%
graph to answer the question.
If f represents the function, find f(2000).
A) approximately 24%
B) approximately 25.5%
C) approximately 29%
D) approximately 31%
Question
Determine whether the graph illustrated represents a function. Give the domain and range of the relation or function.
A)
B)
C)
D)
A)
B)
C)
D)
Question
The graph below shows the percentage of students enrolled in the College of Engineering at State University. Use the
graph to answer the question.
Between what two years is the difference in function values equal to 5%?
A) between 1985 and 1990
B) between 1960 and 1965
C) between 1970 and 1975
D) between 1980 and 1985
graph to answer the question.
Between what two years is the difference in function values equal to 5%?
A) between 1985 and 1990
B) between 1960 and 1965
C) between 1970 and 1975
D) between 1980 and 1985
Question
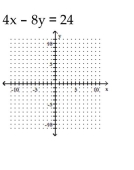
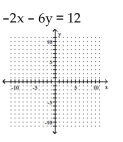
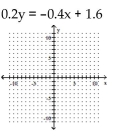
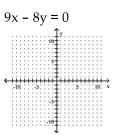
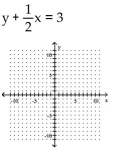
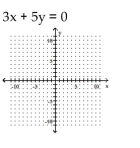
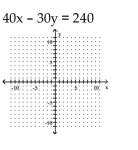
Graph the linear function by plotting the x- and y-intercepts.
A)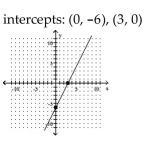
B)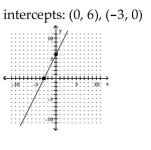
C)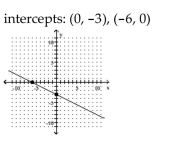
D)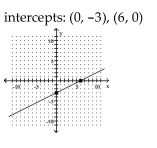
A)
B)
C)
D)
Question
Graph the linear function by plotting the x- and y-intercepts.
A)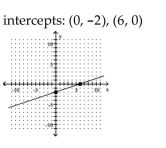
B)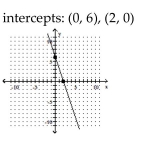
C)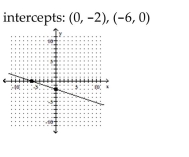
D)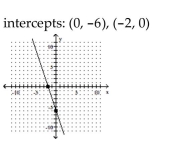
A)
B)
C)
D)
Question
Graph the linear function by plotting the x- and y-intercepts.
A)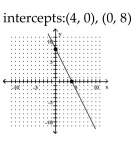
B)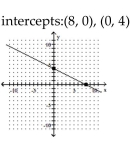
C)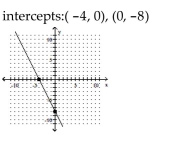
D)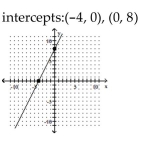
A)
B)
C)
D)
Question
Graph the equation.
A)
B)
C)
D)
A)
B)
C)
D)
Question
The graph below shows the percentage of students enrolled in the College of Engineering at State University. Use the
graph to answer the question.
If f(x) = 15%, what year is represented by x?
A) 1975
B) 1985
C) 1970
D) 1980
graph to answer the question.
If f(x) = 15%, what year is represented by x?
A) 1975
B) 1985
C) 1970
D) 1980
Question
Question
Solve the problem.
The price of commodities, like pork bellies, is determined by supply and demand. Thus, the price of pork bellies is a function of the number of pounds of pork bellies produced. The price of a pound of pork bellies can be estimated by the
Function where f(Q) is the price of a pound of pork bellies and Q is the annual number of pounds of pork bellies produced.
i. Construct a graph showing the relationship between the number of pounds of pork bellies produced and the price
Of a pound of pork bellies.
ii. Estimate the cost of a pound of pork bellies if 70,000 pounds of pork bellies are produced in a given year.
A)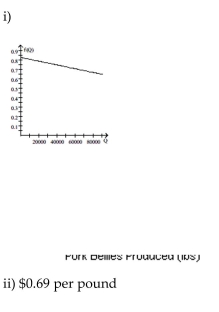
B)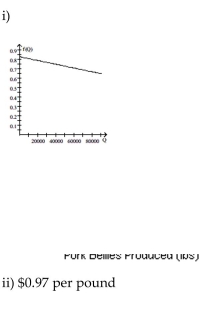
C)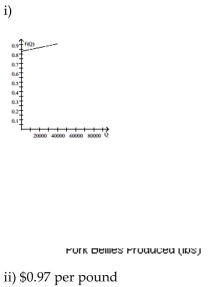
D)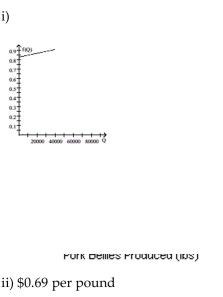
The price of commodities, like pork bellies, is determined by supply and demand. Thus, the price of pork bellies is a function of the number of pounds of pork bellies produced. The price of a pound of pork bellies can be estimated by the
Function
where f(Q) is the price of a pound of pork bellies and Q is the annual number of pounds of pork bellies produced.i. Construct a graph showing the relationship between the number of pounds of pork bellies produced and the price
Of a pound of pork bellies.
ii. Estimate the cost of a pound of pork bellies if 70,000 pounds of pork bellies are produced in a given year.
A)
B)
C)
D)
Question
Graph the equation.
A)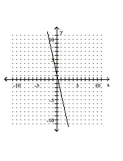
B)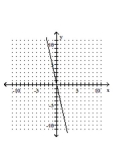
C)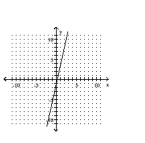
D)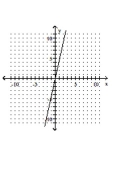
A)
B)
C)
D)
Question
Solve the problem.
The population of fruit flies, p, after n days from the first mating of ten flies is given by the function
A)
B)
C)
D)
The population of fruit flies, p, after n days from the first mating of ten flies is given by the function
A)
B)
C)
D)
Question
Question
Graph the linear function by plotting the x- and y-intercepts.
A)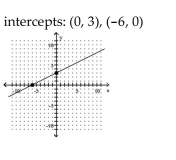
B)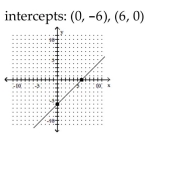
C)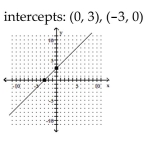
D)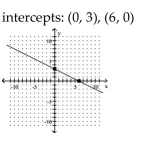
A)
B)
C)
D)
Question
Graph the equation.
A)
B)
C)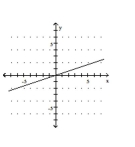
D)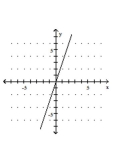
A)
B)
C)
D)
Question
Graph the equation.
A)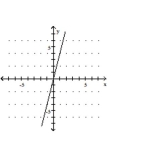
B)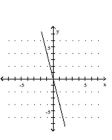
C)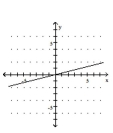
D)
A)
B)
C)
D)
Question
Question
Graph the linear function by plotting the x- and y-intercepts.
A)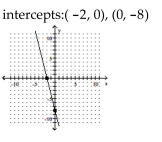
B)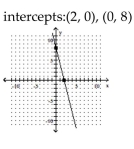
C)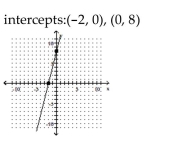
D)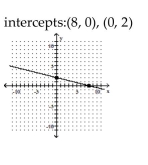
A)
B)
C)
D)
Question
Graph the equation.
A)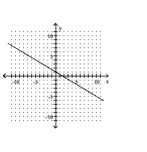
B)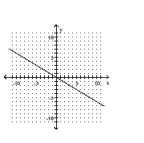
C)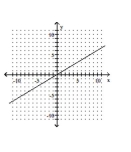
D)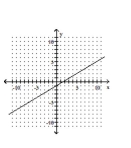
A)
B)
C)
D)
Question
Graph the linear function by plotting the x- and y-intercepts.
A)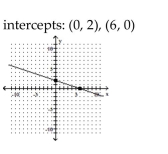
B)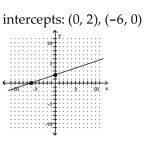
C)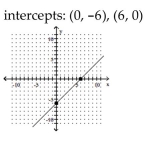
D)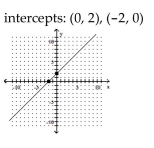
A)
B)
C)
D)
Question
Graph the linear function by plotting the x- and y-intercepts.
A)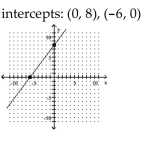
B)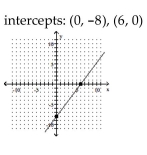
C)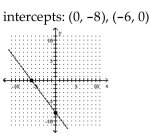
D)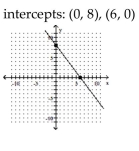
A)
B)
C)
D)
Question

Unlock Deck
Sign up to unlock the cards in this deck!
Unlock Deck
Unlock Deck
1/125
Play
Full screen (f)
Deck 8: Functions and Their Graphs
1
Use a calculator to obtain at least eight points that are solutions to the equation. Then graph the equation by plotting
points.
points.
 Points plotted:
  Other points could be used.
 2
Graph the equation.
A)
B)
C)
D)
A)
B)
C)
D)
3
List the set in roster form.
S = {x| x is an odd integer greater than 33 and less than or equal to 39}
A) {34, 35, 36, 37, 38, 39}
B) {33, 34, 35, 36, 37, 38, 39}
C) {35, 37, 39}
D) {33, 35, 37, 39}
S = {x| x is an odd integer greater than 33 and less than or equal to 39}
A) {34, 35, 36, 37, 38, 39}
B) {33, 34, 35, 36, 37, 38, 39}
C) {35, 37, 39}
D) {33, 35, 37, 39}
{35, 37, 39}
4
Graph the equation.
A)
B)
C)
D)
A)
B)
C)
D)
Unlock Deck
Unlock for access to all 125 flashcards in this deck.
Unlock Deck
k this deck
5
Solve the problem.
Mark started out by walking up a hill for 5 minutes. For the next 5 minutes he walked down a steep hill to an elevation lower than his starting point. For the next 10 minutes he walked on level ground. For the next 10
Minutes he walked uphill. Determine which graph of elevation above sea level versus time matches the given
Situation.
A)
B)
C)
D)
Unlock Deck
Unlock for access to all 125 flashcards in this deck.
Unlock Deck
k this deck
6
The graph below shows the percentage of students enrolled in the College of Engineering at State University. Use the
graph to answer the question.
In what year were 20% of the students at State University enrolled in the College of Engineering?
A) 1990
B) 1975
C) 1980
D) 1985
graph to answer the question.
In what year were 20% of the students at State University enrolled in the College of Engineering?
A) 1990
B) 1975
C) 1980
D) 1985
Unlock Deck
Unlock for access to all 125 flashcards in this deck.
Unlock Deck
k this deck
7
Graph the equation.
A)
B)
C)
D)
A)
B)
C)
D)
Unlock Deck
Unlock for access to all 125 flashcards in this deck.
Unlock Deck
k this deck
8
Graph the equation.
A)
B)
C)
D)
A)
B)
C)
D)
Unlock Deck
Unlock for access to all 125 flashcards in this deck.
Unlock Deck
k this deck
9
Graph the equation.
A)
B)
C)
D)
A)
B)
C)
D)
Unlock Deck
Unlock for access to all 125 flashcards in this deck.
Unlock Deck
k this deck
10
Graph the equation.
A)
B)
C)
D)
A)
B)
C)
D)
Unlock Deck
Unlock for access to all 125 flashcards in this deck.
Unlock Deck
k this deck
11
Use a calculator to obtain at least eight points that are solutions to the equation. Then graph the equation by plotting
points.
points.
Unlock Deck
Unlock for access to all 125 flashcards in this deck.
Unlock Deck
k this deck
12
The graph below shows the percentage of students enrolled in the College of Engineering at State University. Use the
graph to answer the question.
What percentage of the students at State University were enrolled in the College of Engineering in 1965?
A) approximately 4%
B) approximately 7.5%
C) approximately 9.5%
D) approximately 2.5%
graph to answer the question.
What percentage of the students at State University were enrolled in the College of Engineering in 1965?
A) approximately 4%
B) approximately 7.5%
C) approximately 9.5%
D) approximately 2.5%
Unlock Deck
Unlock for access to all 125 flashcards in this deck.
Unlock Deck
k this deck
13
Graph the equation.
A)
B)
C)
D)
A)
B)
C)
D)
Unlock Deck
Unlock for access to all 125 flashcards in this deck.
Unlock Deck
k this deck
14
Graph the equation.
A)
B)
C)
D)
A)
B)
C)
D)
Unlock Deck
Unlock for access to all 125 flashcards in this deck.
Unlock Deck
k this deck
15
List the set in roster form.
A)
B) {1, 2, 3, 4}
C) {2, 3}
D) { }
A)
B) {1, 2, 3, 4}
C) {2, 3}
D) { }
Unlock Deck
Unlock for access to all 125 flashcards in this deck.
Unlock Deck
k this deck
16
Use a calculator to obtain at least eight points that are solutions to the equation. Then graph the equation by plotting
points.
points.
Unlock Deck
Unlock for access to all 125 flashcards in this deck.
Unlock Deck
k this deck
17
Graph the equation.
A)
B)
C)
D)
A)
B)
C)
D)
Unlock Deck
Unlock for access to all 125 flashcards in this deck.
Unlock Deck
k this deck
18
Use a calculator to obtain at least eight points that are solutions to the equation. Then graph the equation by plotting
points.
points.
Unlock Deck
Unlock for access to all 125 flashcards in this deck.
Unlock Deck
k this deck
19
Solve the problem.
A freight train traveled at a speed of 50 mph for 3 hours, then stayed in a station for 1 hour, and then traveled 30 mph for 2 hours. Make a graph of distance traveled versus time to match the given situation.
A)
B)
C)
D)
A freight train traveled at a speed of 50 mph for 3 hours, then stayed in a station for 1 hour, and then traveled 30 mph for 2 hours. Make a graph of distance traveled versus time to match the given situation.
A)
B)
C)
D)
Unlock Deck
Unlock for access to all 125 flashcards in this deck.
Unlock Deck
k this deck
20
Graph the equation.
A)
B)
C)
D)
A)
B)
C)
D)
Unlock Deck
Unlock for access to all 125 flashcards in this deck.
Unlock Deck
k this deck
21
Express in set builder notation the set of numbers indicated on the number line.
A)
B)
C)
D)
A)
B)
C)
D)
Unlock Deck
Unlock for access to all 125 flashcards in this deck.
Unlock Deck
k this deck
22
Illustrate the set on a number line.
A)
B)
C)
D)
A)
B)
C)
D)
Unlock Deck
Unlock for access to all 125 flashcards in this deck.
Unlock Deck
k this deck
23
List the set in roster form.
S = {x| x is a whole number less than 6}
A) {1, 2, 3, 4, 5, 6}
B) {1, 2, 3, 4, 5}
C) {0, 1, 2, 3, 4, 5}
D) {0, 1, 2, 3, 4, 5, 6}
S = {x| x is a whole number less than 6}
A) {1, 2, 3, 4, 5, 6}
B) {1, 2, 3, 4, 5}
C) {0, 1, 2, 3, 4, 5}
D) {0, 1, 2, 3, 4, 5, 6}
Unlock Deck
Unlock for access to all 125 flashcards in this deck.
Unlock Deck
k this deck
24
Illustrate the set on a number line.
A)
B)
C)
D)
A)
B)
C)
D)
Unlock Deck
Unlock for access to all 125 flashcards in this deck.
Unlock Deck
k this deck
25
Provide an appropriate response.
A relation is any set of .
A) domains
B) x-coordinates
C) y-coordinates
D) ordered pairs
A relation is any set of .
A) domains
B) x-coordinates
C) y-coordinates
D) ordered pairs
Unlock Deck
Unlock for access to all 125 flashcards in this deck.
Unlock Deck
k this deck
26
Illustrate the set on a number line.
A)
B)
C)
D)
A)
B)
C)
D)
Unlock Deck
Unlock for access to all 125 flashcards in this deck.
Unlock Deck
k this deck
27
Illustrate the set on a number line.
A)
B)
C)
D)
A)
B)
C)
D)
Unlock Deck
Unlock for access to all 125 flashcards in this deck.
Unlock Deck
k this deck
28
Illustrate the set on a number line.
A)
B)
C)
D)
A)
B)
C)
D)
Unlock Deck
Unlock for access to all 125 flashcards in this deck.
Unlock Deck
k this deck
29
Provide an appropriate response.
In the notation y = f(x), y is the variable.
A) independent
B) dependent
C) y-coordinates
D) range
In the notation y = f(x), y is the variable.
A) independent
B) dependent
C) y-coordinates
D) range
Unlock Deck
Unlock for access to all 125 flashcards in this deck.
Unlock Deck
k this deck
30
Determine if the relation illustrated is a function. Give the domain and range of the function or relation.
A)
B)
C)
D)
A)
B)
C)
D)
Unlock Deck
Unlock for access to all 125 flashcards in this deck.
Unlock Deck
k this deck
31
List the set in roster form.
S = {x| x is and integer between 4 and 5}
A) {4}
B) {4, 5}
C)
D) { }
S = {x| x is and integer between 4 and 5}
A) {4}
B) {4, 5}
C)
D) { }
Unlock Deck
Unlock for access to all 125 flashcards in this deck.
Unlock Deck
k this deck
32
Express in set builder notation the set of numbers indicated on the number line.
A = -5.4
A)
B) {x| x > -5.4}
C) {x| x < -5.4}
D)
A = -5.4A)
B) {x| x > -5.4}
C) {x| x < -5.4}
D)
Unlock Deck
Unlock for access to all 125 flashcards in this deck.
Unlock Deck
k this deck
33
Express in set builder notation the set of numbers indicated on the number line.
A) {x| x > -9}
B) {x| x < -9}
C)
D)
A) {x| x > -9}
B) {x| x < -9}
C)
D)
Unlock Deck
Unlock for access to all 125 flashcards in this deck.
Unlock Deck
k this deck
34
List the set in roster form.
S = {x| x is a whole number multiple of 2}
A) {4, 6, 8, 10, 12, . . . }
B) {1, 2, 4, 6, 8, . . . }
C) {0, 2, 4, 6, 8, . . . }
D) {2, 4, 6, 8, 10, . . . }
S = {x| x is a whole number multiple of 2}
A) {4, 6, 8, 10, 12, . . . }
B) {1, 2, 4, 6, 8, . . . }
C) {0, 2, 4, 6, 8, . . . }
D) {2, 4, 6, 8, 10, . . . }
Unlock Deck
Unlock for access to all 125 flashcards in this deck.
Unlock Deck
k this deck
35
Illustrate the set on a number line.
A)
B)
C)
D)
A)
B)
C)
D)
Unlock Deck
Unlock for access to all 125 flashcards in this deck.
Unlock Deck
k this deck
36
Provide an appropriate response.
In the notation y = f(x), x is the variable.
A) x-coordinates
B) dependent
C) domain
D) independent
In the notation y = f(x), x is the variable.
A) x-coordinates
B) dependent
C) domain
D) independent
Unlock Deck
Unlock for access to all 125 flashcards in this deck.
Unlock Deck
k this deck
37
Provide an appropriate response.
The set of y-coordinates of a relation is called the of the relation.
A) ordered pairs
B) range
C) dependent
D) domain
The set of y-coordinates of a relation is called the of the relation.
A) ordered pairs
B) range
C) dependent
D) domain
Unlock Deck
Unlock for access to all 125 flashcards in this deck.
Unlock Deck
k this deck
38
Illustrate the set on a number line.
A)
B)
C)
D)
A)
B)
C)
D)
Unlock Deck
Unlock for access to all 125 flashcards in this deck.
Unlock Deck
k this deck
39
Determine if the relation illustrated is a function. Give the domain and range of the function or relation.
A)
B)
C)
D)
A)
B)
C)
D)
Unlock Deck
Unlock for access to all 125 flashcards in this deck.
Unlock Deck
k this deck
40
Provide an appropriate response.
The set of of a relation is called the domain of the relation.
A) independent
B) ordered pairs
C) x-coordinates
D) y-coordinates
The set of of a relation is called the domain of the relation.
A) independent
B) ordered pairs
C) x-coordinates
D) y-coordinates
Unlock Deck
Unlock for access to all 125 flashcards in this deck.
Unlock Deck
k this deck
41
Evaluate the function for the indicated value.
f(x) = -3x + 1; find f(3)
A) -6
B) -10
C) -8
D) -2
f(x) = -3x + 1; find f(3)
A) -6
B) -10
C) -8
D) -2
Unlock Deck
Unlock for access to all 125 flashcards in this deck.
Unlock Deck
k this deck
42
Evaluate the function for the indicated value.
A)
B)
C)
D)
A)
B)
C)
D)
Unlock Deck
Unlock for access to all 125 flashcards in this deck.
Unlock Deck
k this deck
43
Solve the problem.
The formula for the volume of a right circular cylinder is . If the height is 19 m, then the volume is a function of the radius, r. Write the function using function notation, where the height is 19. Determine the
Volume if the radius is 11 m.
A)
B)
C)
D)
The formula for the volume of a right circular cylinder is
. If the height is 19 m, then the volume is a function of the radius, r. Write the function using function notation, where the height is 19. Determine theVolume if the radius is 11 m.
A)
B)
C)
D)
Unlock Deck
Unlock for access to all 125 flashcards in this deck.
Unlock Deck
k this deck
44
Determine whether the graph illustrated represents a function. Give the domain and range of the relation or function.
A)
B)
C)
D)
A)
B)
C)
D)
Unlock Deck
Unlock for access to all 125 flashcards in this deck.
Unlock Deck
k this deck
45
Evaluate the function for the indicated value.
A) -32
B) 4
C) 32
D) -4
A) -32
B) 4
C) 32
D) -4
Unlock Deck
Unlock for access to all 125 flashcards in this deck.
Unlock Deck
k this deck
46
Determine if the relation illustrated is a function. Give the domain and range of the function or relation.
{(-1, -3), (-1, -2), (-1, 0), (3, 2), (15, 4)}
A)
B)
C)
D)
{(-1, -3), (-1, -2), (-1, 0), (3, 2), (15, 4)}
A)
B)
C)
D)
Unlock Deck
Unlock for access to all 125 flashcards in this deck.
Unlock Deck
k this deck
47
The graph below shows the percentage of students enrolled in the College of Engineering at State University. Use the
graph to answer the question.
Does the graph represent a function?
A) no
B) yes
graph to answer the question.
Does the graph represent a function?
A) no
B) yes
Unlock Deck
Unlock for access to all 125 flashcards in this deck.
Unlock Deck
k this deck
48
Determine if the relation illustrated is a function. Give the domain and range of the function or relation.
A)
B)
C)
D)
A)
B)
C)
D)
Unlock Deck
Unlock for access to all 125 flashcards in this deck.
Unlock Deck
k this deck
49
Determine whether the graph illustrated represents a function. Give the domain and range of the relation or function.
A)
B)
C)
D)
A)
B)
C)
D)
Unlock Deck
Unlock for access to all 125 flashcards in this deck.
Unlock Deck
k this deck
50
Determine if the relation illustrated is a function. Give the domain and range of the function or relation.
{(-4, 11), (-3, 4), (0, -5), (3, 4), (5, 20)}
A)
B)
C)
D)
{(-4, 11), (-3, 4), (0, -5), (3, 4), (5, 20)}
A)
B)
C)
D)
Unlock Deck
Unlock for access to all 125 flashcards in this deck.
Unlock Deck
k this deck
51
Determine whether the graph illustrated represents a function. Give the domain and range of the relation or function.
A)
B)
C)
D)
A)
B)
C)
D)
Unlock Deck
Unlock for access to all 125 flashcards in this deck.
Unlock Deck
k this deck
52
Evaluate the function for the indicated value.
A)
B)
C)
D) - 2
A)
B)
C)
D) - 2
Unlock Deck
Unlock for access to all 125 flashcards in this deck.
Unlock Deck
k this deck
53
Solve the problem.
The formula for the circumference of a circle is The circumference is a function of the radius. Write the function using function notation. Determine the circumference when the radius is 4 mi.
A)
B)
C)
D)
The formula for the circumference of a circle is
The circumference is a function of the radius. Write the function using function notation. Determine the circumference when the radius is 4 mi.A)
B)
C)
D)
Unlock Deck
Unlock for access to all 125 flashcards in this deck.
Unlock Deck
k this deck
54
Solve the problem.
The formula for changing Celsius temperature to Fahrenheit temperature is The Fahrenheit temperature is a function of the Celsius temperature. Write the function in function notation. Find the
Fahrenheit temperature that corresponds to 20° C.
A)
B)
C)
D)
The formula for changing Celsius temperature to Fahrenheit temperature is
The Fahrenheit temperature is a function of the Celsius temperature. Write the function in function notation. Find theFahrenheit temperature that corresponds to 20° C.
A)
B)
C)
D)
Unlock Deck
Unlock for access to all 125 flashcards in this deck.
Unlock Deck
k this deck
55
Determine whether the graph illustrated represents a function. Give the domain and range of the relation or function.
A)
B)
C)
D)
A)
B)
C)
D)
Unlock Deck
Unlock for access to all 125 flashcards in this deck.
Unlock Deck
k this deck
56
Solve the problem.
The formula for the area of a parallelogram is A = bh. If the base measures 29 inches, the area is a function of the altitude, h. Write the function in function notation where the base is 29. Determine the area of the parallelogram
When the altitude is 30 inches.
A)
B)
C)
D)
The formula for the area of a parallelogram is A = bh. If the base measures 29 inches, the area is a function of the altitude, h. Write the function in function notation where the base is 29. Determine the area of the parallelogram
When the altitude is 30 inches.
A)
B)
C)
D)
Unlock Deck
Unlock for access to all 125 flashcards in this deck.
Unlock Deck
k this deck
57
Determine whether the graph illustrated represents a function. Give the domain and range of the relation or function.
A)
B)
C)
D)
A)
B)
C)
D)
Unlock Deck
Unlock for access to all 125 flashcards in this deck.
Unlock Deck
k this deck
58
Evaluate the function for the indicated value.
A) -57
B) 4
C) 2
D) -4
A) -57
B) 4
C) 2
D) -4
Unlock Deck
Unlock for access to all 125 flashcards in this deck.
Unlock Deck
k this deck
59
The graph below shows the percentage of students enrolled in the College of Engineering at State University. Use the
graph to answer the question.
If f represents the function, find f(2000).
A) approximately 24%
B) approximately 25.5%
C) approximately 29%
D) approximately 31%
graph to answer the question.
If f represents the function, find f(2000).
A) approximately 24%
B) approximately 25.5%
C) approximately 29%
D) approximately 31%
Unlock Deck
Unlock for access to all 125 flashcards in this deck.
Unlock Deck
k this deck
60
Determine whether the graph illustrated represents a function. Give the domain and range of the relation or function.
A)
B)
C)
D)
A)
B)
C)
D)
Unlock Deck
Unlock for access to all 125 flashcards in this deck.
Unlock Deck
k this deck
61
The graph below shows the percentage of students enrolled in the College of Engineering at State University. Use the
graph to answer the question.
Between what two years is the difference in function values equal to 5%?
A) between 1985 and 1990
B) between 1960 and 1965
C) between 1970 and 1975
D) between 1980 and 1985
graph to answer the question.
Between what two years is the difference in function values equal to 5%?
A) between 1985 and 1990
B) between 1960 and 1965
C) between 1970 and 1975
D) between 1980 and 1985
Unlock Deck
Unlock for access to all 125 flashcards in this deck.
Unlock Deck
k this deck
62
Graph the linear function by plotting the x- and y-intercepts.
A)
B)
C)
D)
A)
B)
C)
D)
Unlock Deck
Unlock for access to all 125 flashcards in this deck.
Unlock Deck
k this deck
63
Graph the linear function by plotting the x- and y-intercepts.
A)
B)
C)
D)
A)
B)
C)
D)
Unlock Deck
Unlock for access to all 125 flashcards in this deck.
Unlock Deck
k this deck
64
Graph the linear function by plotting the x- and y-intercepts.
A)
B)
C)
D)
A)
B)
C)
D)
Unlock Deck
Unlock for access to all 125 flashcards in this deck.
Unlock Deck
k this deck
65
Graph the equation.
A)
B)
C)
D)
A)
B)
C)
D)
Unlock Deck
Unlock for access to all 125 flashcards in this deck.
Unlock Deck
k this deck
66
The graph below shows the percentage of students enrolled in the College of Engineering at State University. Use the
graph to answer the question.
If f(x) = 15%, what year is represented by x?
A) 1975
B) 1985
C) 1970
D) 1980
graph to answer the question.
If f(x) = 15%, what year is represented by x?
A) 1975
B) 1985
C) 1970
D) 1980
Unlock Deck
Unlock for access to all 125 flashcards in this deck.
Unlock Deck
k this deck
67
Write the equation in standard form.
y = -3x - 9
A) 3x + y = 9
B) -3x - 9y = 0
C) 3x + y = -9
D) -3x + y = -9
y = -3x - 9
A) 3x + y = 9
B) -3x - 9y = 0
C) 3x + y = -9
D) -3x + y = -9
Unlock Deck
Unlock for access to all 125 flashcards in this deck.
Unlock Deck
k this deck
68
Solve the problem.
The price of commodities, like pork bellies, is determined by supply and demand. Thus, the price of pork bellies is a function of the number of pounds of pork bellies produced. The price of a pound of pork bellies can be estimated by the
Function where f(Q) is the price of a pound of pork bellies and Q is the annual number of pounds of pork bellies produced.
i. Construct a graph showing the relationship between the number of pounds of pork bellies produced and the price
Of a pound of pork bellies.
ii. Estimate the cost of a pound of pork bellies if 70,000 pounds of pork bellies are produced in a given year.
A)
B)
C)
D)
The price of commodities, like pork bellies, is determined by supply and demand. Thus, the price of pork bellies is a function of the number of pounds of pork bellies produced. The price of a pound of pork bellies can be estimated by the
Function
where f(Q) is the price of a pound of pork bellies and Q is the annual number of pounds of pork bellies produced.i. Construct a graph showing the relationship between the number of pounds of pork bellies produced and the price
Of a pound of pork bellies.
ii. Estimate the cost of a pound of pork bellies if 70,000 pounds of pork bellies are produced in a given year.
A)
B)
C)
D)
Unlock Deck
Unlock for access to all 125 flashcards in this deck.
Unlock Deck
k this deck
69
Graph the equation.
A)
B)
C)
D)
A)
B)
C)
D)
Unlock Deck
Unlock for access to all 125 flashcards in this deck.
Unlock Deck
k this deck
70
Solve the problem.
The population of fruit flies, p, after n days from the first mating of ten flies is given by the function
A)
B)
C)
D)
The population of fruit flies, p, after n days from the first mating of ten flies is given by the function
A)
B)
C)
D)
Unlock Deck
Unlock for access to all 125 flashcards in this deck.
Unlock Deck
k this deck
71
Write the equation in standard form.
8x = -3y - 9
A) 8x - 3y = -9
B) 8x - 3y = 9
C) 8x + 3y = 9
D) 8x + 3y = -9
8x = -3y - 9
A) 8x - 3y = -9
B) 8x - 3y = 9
C) 8x + 3y = 9
D) 8x + 3y = -9
Unlock Deck
Unlock for access to all 125 flashcards in this deck.
Unlock Deck
k this deck
72
Graph the linear function by plotting the x- and y-intercepts.
A)
B)
C)
D)
A)
B)
C)
D)
Unlock Deck
Unlock for access to all 125 flashcards in this deck.
Unlock Deck
k this deck
73
Graph the equation.
A)
B)
C)
D)
A)
B)
C)
D)
Unlock Deck
Unlock for access to all 125 flashcards in this deck.
Unlock Deck
k this deck
74
Graph the equation.
A)
B)
C)
D)
A)
B)
C)
D)
Unlock Deck
Unlock for access to all 125 flashcards in this deck.
Unlock Deck
k this deck
75
Find the x- and y-intercepts of the graph of the equation using a graphing calculator. Round to three decimal places, if
necessary.
12x - 24y = 8
A) (-0.333, 0), (0, 0.667)
B) (0.667, 0), (0, -0.667)
C) (0.667, 0), (0, -0.333)
D) (-0.667, 0), (0, -0.333)
necessary.
12x - 24y = 8
A) (-0.333, 0), (0, 0.667)
B) (0.667, 0), (0, -0.667)
C) (0.667, 0), (0, -0.333)
D) (-0.667, 0), (0, -0.333)
Unlock Deck
Unlock for access to all 125 flashcards in this deck.
Unlock Deck
k this deck
76
Graph the linear function by plotting the x- and y-intercepts.
A)
B)
C)
D)
A)
B)
C)
D)
Unlock Deck
Unlock for access to all 125 flashcards in this deck.
Unlock Deck
k this deck
77
Graph the equation.
A)
B)
C)
D)
A)
B)
C)
D)
Unlock Deck
Unlock for access to all 125 flashcards in this deck.
Unlock Deck
k this deck
78
Graph the linear function by plotting the x- and y-intercepts.
A)
B)
C)
D)
A)
B)
C)
D)
Unlock Deck
Unlock for access to all 125 flashcards in this deck.
Unlock Deck
k this deck
79
Graph the linear function by plotting the x- and y-intercepts.
A)
B)
C)
D)
A)
B)
C)
D)
Unlock Deck
Unlock for access to all 125 flashcards in this deck.
Unlock Deck
k this deck
80
Write the equation in standard form.
y - 5 = - 53 (x - 1)
A) 5x - 3y = 20
B) 5x - 3y = -10
C) 5x + 3y = 20
D) 5x + 3y = -10
y - 5 = - 53 (x - 1)
A) 5x - 3y = 20
B) 5x - 3y = -10
C) 5x + 3y = 20
D) 5x + 3y = -10
Unlock Deck
Unlock for access to all 125 flashcards in this deck.
Unlock Deck
k this deck
Unlock Deck
Unlock for access to all 125 flashcards in this deck.


