Exam 8: Functions and Their Graphs
Exam 1: Real Numbers603 Questions
Exam 2: Solving Linear Equations and Inequalities193 Questions
Exam 3: Applications of Algebra93 Questions
Exam 4: Graphing Linear Equations125 Questions
Exam 5: Exponents and Polynomials355 Questions
Exam 6: Factoring196 Questions
Exam 7: Rational Expressions and Equations250 Questions
Exam 8: Functions and Their Graphs125 Questions
Exam 9: Systems of Linear Equations139 Questions
Exam 10: Inequalities in One and Two Variables111 Questions
Exam 11: Roots, Radicals, and Complex Numbers288 Questions
Exam 12: Quadratic Functions219 Questions
Exam 13: Exponential and Logarithmic Functions229 Questions
Exam 14: Conic Sections104 Questions
Exam 15: Sequences, Series, and the Binomial Theorem140 Questions
Exam 16: Appendix Review of Decimals and Percent82 Questions
Select questions type
Solve the problem.
-The average value , V, of a certain type of car is a linear function of the year, x. The average value was $14,460 in 1995 and depreciated to $6900 in 1998. Let x = 0 represent 1995. Write the value, V, as function of the year, x.
Free
(Multiple Choice)
4.9/5  (33)
(33)
Correct Answer: Verified
A
Solve the problem.
-The price of commodities, like pork bellies, is determined by supply and demand. Thus, the price of pork bellies is a function of the number of pounds of pork bellies produced. The price of a pound of pork bellies can be estimated by the
Function  where f(Q) is the price of a pound of pork bellies and Q is the annual number of pounds of pork bellies produced.
i. Construct a graph showing the relationship between the number of pounds of pork bellies produced and the price
Of a pound of pork bellies.
ii. Estimate the cost of a pound of pork bellies if 70,000 pounds of pork bellies are produced in a given year.
where f(Q) is the price of a pound of pork bellies and Q is the annual number of pounds of pork bellies produced.
i. Construct a graph showing the relationship between the number of pounds of pork bellies produced and the price
Of a pound of pork bellies.
ii. Estimate the cost of a pound of pork bellies if 70,000 pounds of pork bellies are produced in a given year. 
Free
(Multiple Choice)
4.9/5 (34)
Correct Answer:Verified
A
Evaluate the function for the indicated value.
-
Free
(Multiple Choice)
4.8/5 (42)
Correct Answer:Verified
B
Solve the problem.
-The formula for the area of a parallelogram is A = bh. If the base measures 29 inches, the area is a function of the altitude, h. Write the function in function notation where the base is 29. Determine the area of the parallelogram
When the altitude is 30 inches.
(Multiple Choice)
4.8/5 (36)
Solve the problem.
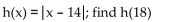
-Sue and Bob have each saved money during every year from 2000 to 2005. The following bar graph shows the amounts saved each of those years. 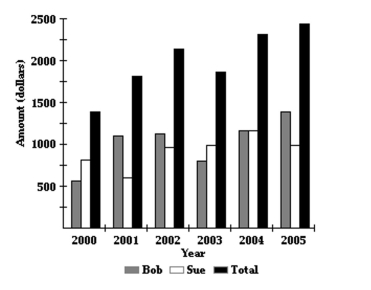 In what years did Bob save more than the previous year, but Sue save less than the previous year?
(Multiple Choice)
4.8/5 (41)
Two points on L1 and two points on L2 are given. Determine whether L1 is parallel to L2, L1 is perpendicular to L2, or
neither.
-L1: (2, 3), (4, 7); L2: (1, -3), (-1, 1)
(Multiple Choice)
4.9/5 (38)
Solve the problem.
-The graph shows the projected radio sales (in millions) for a particular company.  Determine the slope of the line segment from 2004 to 2005.
(Multiple Choice)
4.7/5 (29)
Express in set builder notation the set of numbers indicated on the number line.
-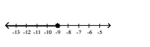
(Multiple Choice)
4.8/5 (32)
Graph the linear function by plotting the x- and y-intercepts.
-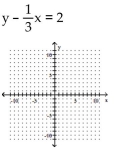
(Multiple Choice)
4.8/5 (35)
The graph below shows the percentage of students enrolled in the College of Engineering at State University. Use the
graph to answer the question. 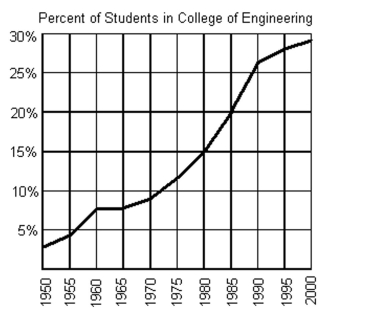 -If f(x) = 15%, what year is represented by x?
(Multiple Choice)
4.8/5 (33)
The graph below shows the percentage of students enrolled in the College of Engineering at State University. Use the
graph to answer the question.
-Between what two years is the difference in function values equal to 5%?
(Multiple Choice)
4.8/5 (36)
Find the equation of a line with the properties given. Write the equation in the form indicated.
-Through (3, -5) and parallel to the line whose equation is y = -8x + 2; slope-intercept form
(Multiple Choice)
4.9/5 (40)
Provide an appropriate response.
-The set of y-coordinates of a relation is called the of the relation.
(Multiple Choice)
4.9/5 (34)
Solve the problem.
-Linda needs to have her car towed. Little Town Auto charges a flat fee of $70 plus $2 per mile towed. Write a function expressing Linda's towing cost, c, in terms of miles towed, x. Find the cost of having a car towed 5
Miles.
(Multiple Choice)
4.7/5 (30)
Graph the linear function by plotting the x- and y-intercepts.
-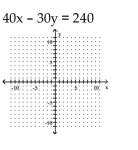
(Multiple Choice)
5.0/5 (31)
Determine if the relation illustrated is a function. Give the domain and range of the function or relation.
-{(-1, -3), (-1, -2), (-1, 0), (3, 2), (15, 4)}
(Multiple Choice)
4.8/5 (42)
Filters
- Essay(0)
- Multiple Choice(0)
- Short Answer(0)
- True False(0)
- Matching(0)