Deck 11: Simulation and Risk Analysis
Full screen (f)
Question
Use the information below to answer the following question(s).
Below is a spreadsheet for Trance Electronics.
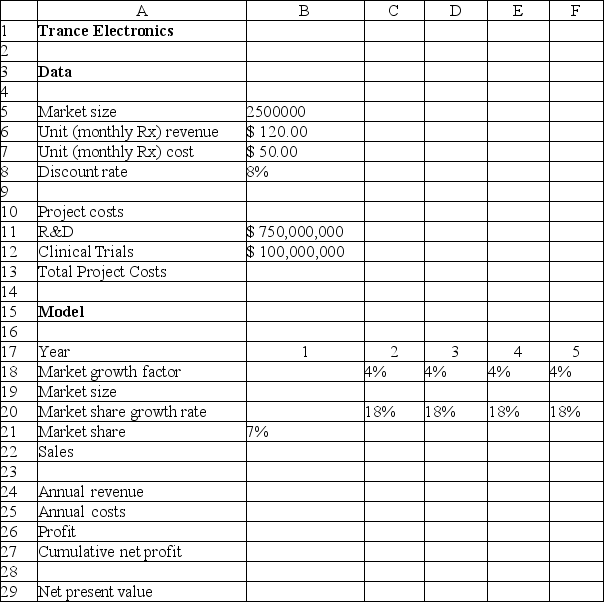
Suppose that the project manager of Trance Electronics has identified the following uncertain variables in the model and the distributions and parameters that describe them, as follows:
Market size: normal with mean of 2,000,000 units and standard deviation of 400,000 units.
R&D costs: uniform between $600,000,000 and $800,000,000.
Clinical trial costs: lognormal with mean of $150,000,000 and standard deviation $30,000,000.
Annual market growth factor: triangular with minimum = 2%, maximum = 6%, and most likely = 3%.
Annual market share growth rate: triangular with minimum = 15%, maximum = 25%, and most likely = 20%.
The number of trials per simulation is equal to 10,000 at a Sim.Random Seed of 2.Run the simulation and answer the following questions using the Risk Solver Platform.
What is the expected loss ratio obtained from the simulation results of the net present value?
A)93.50%
B)72.45%
C)67.32%
D)85.42%
Below is a spreadsheet for Trance Electronics.
Suppose that the project manager of Trance Electronics has identified the following uncertain variables in the model and the distributions and parameters that describe them, as follows:
Market size: normal with mean of 2,000,000 units and standard deviation of 400,000 units.
R&D costs: uniform between $600,000,000 and $800,000,000.
Clinical trial costs: lognormal with mean of $150,000,000 and standard deviation $30,000,000.
Annual market growth factor: triangular with minimum = 2%, maximum = 6%, and most likely = 3%.
Annual market share growth rate: triangular with minimum = 15%, maximum = 25%, and most likely = 20%.
The number of trials per simulation is equal to 10,000 at a Sim.Random Seed of 2.Run the simulation and answer the following questions using the Risk Solver Platform.
What is the expected loss ratio obtained from the simulation results of the net present value?
A)93.50%
B)72.45%
C)67.32%
D)85.42%
Question
Question
Use the information below to answer the following question(s).
Consider the following spreadsheet for an outsourcing decision model.
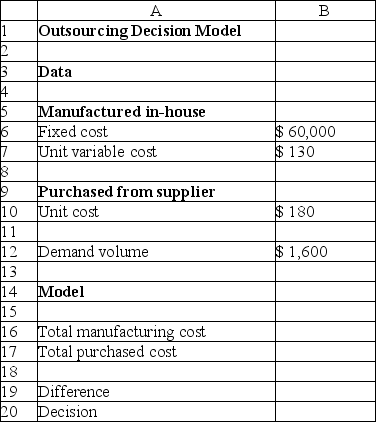
We assume that the production (demand)volume is normally distributed with a mean of 1,000 and a standard deviation of 100.For the unit cost, select the triangular distribution.It has a minimum value of $150, most likely value of $165, and a maximum value of $190.The number of trials per simulation is equal to 5,000 at a Sim.Random Seed of 1.Run the simulation and answer the following question(s)using the Risk Solver Platform.
What is the expected loss determined from the simulation results?
A)$(78)
B)$(120)
C)$(60)
D)$(39)
Consider the following spreadsheet for an outsourcing decision model.
We assume that the production (demand)volume is normally distributed with a mean of 1,000 and a standard deviation of 100.For the unit cost, select the triangular distribution.It has a minimum value of $150, most likely value of $165, and a maximum value of $190.The number of trials per simulation is equal to 5,000 at a Sim.Random Seed of 1.Run the simulation and answer the following question(s)using the Risk Solver Platform.
What is the expected loss determined from the simulation results?
A)$(78)
B)$(120)
C)$(60)
D)$(39)
Question
Use the information below to answer the following question(s).
Below is a spreadsheet for Trance Electronics.
Suppose that the project manager of Trance Electronics has identified the following uncertain variables in the model and the distributions and parameters that describe them, as follows:
Market size: normal with mean of 2,000,000 units and standard deviation of 400,000 units.
R&D costs: uniform between $600,000,000 and $800,000,000.
Clinical trial costs: lognormal with mean of $150,000,000 and standard deviation $30,000,000.
Annual market growth factor: triangular with minimum = 2%, maximum = 6%, and most likely = 3%.
Annual market share growth rate: triangular with minimum = 15%, maximum = 25%, and most likely = 20%.
The number of trials per simulation is equal to 10,000 at a Sim.Random Seed of 2.Run the simulation and answer the following questions using the Risk Solver Platform.
What is the standard deviation obtained from the simulation results of the net present value? [Hint: Choose the approximate value.]
A)$204,868,924
B)$162,135,408
C)$182,992,245
D)$148,384,456
Question
Use the information below to answer the following question(s).
Consider the following spreadsheet for an outsourcing decision model.
We assume that the production (demand)volume is normally distributed with a mean of 1,000 and a standard deviation of 100.For the unit cost, select the triangular distribution.It has a minimum value of $150, most likely value of $165, and a maximum value of $190.The number of trials per simulation is equal to 5,000 at a Sim.Random Seed of 1.Run the simulation and answer the following question(s)using the Risk Solver Platform.
What is the value of standard deviation obtained from the simulation results?
A)$9,135
B)$7,884
C)$3,860
D)$12,870
Question
Question
Question
Question
Use the information below to answer the following question(s).
Below is a spreadsheet for Trance Electronics.
Suppose that the project manager of Trance Electronics has identified the following uncertain variables in the model and the distributions and parameters that describe them, as follows:
Market size: normal with mean of 2,000,000 units and standard deviation of 400,000 units.
R&D costs: uniform between $600,000,000 and $800,000,000.
Clinical trial costs: lognormal with mean of $150,000,000 and standard deviation $30,000,000.
Annual market growth factor: triangular with minimum = 2%, maximum = 6%, and most likely = 3%.
Annual market share growth rate: triangular with minimum = 15%, maximum = 25%, and most likely = 20%.
The number of trials per simulation is equal to 10,000 at a Sim.Random Seed of 2.Run the simulation and answer the following questions using the Risk Solver Platform.
What is the coefficient of variation obtained from the simulation results of the net present value?
A)1)78392
B)-2.23958
C)-1.43288
D)2)87645
Question
Question
Question
Use the information below to answer the following question(s).
Below is a spreadsheet for Trance Electronics.
Suppose that the project manager of Trance Electronics has identified the following uncertain variables in the model and the distributions and parameters that describe them, as follows:
Market size: normal with mean of 2,000,000 units and standard deviation of 400,000 units.
R&D costs: uniform between $600,000,000 and $800,000,000.
Clinical trial costs: lognormal with mean of $150,000,000 and standard deviation $30,000,000.
Annual market growth factor: triangular with minimum = 2%, maximum = 6%, and most likely = 3%.
Annual market share growth rate: triangular with minimum = 15%, maximum = 25%, and most likely = 20%.
The number of trials per simulation is equal to 10,000 at a Sim.Random Seed of 2.Run the simulation and answer the following questions using the Risk Solver Platform.
What is the expected value margin obtained from the simulation results of the net present value?
A)0)864
B)-0.708
C)0)343
D)-0.467
Question
Use the information below to answer the following question(s).
Consider the following spreadsheet for an outsourcing decision model.
We assume that the production (demand)volume is normally distributed with a mean of 1,000 and a standard deviation of 100.For the unit cost, select the triangular distribution.It has a minimum value of $150, most likely value of $165, and a maximum value of $190.The number of trials per simulation is equal to 5,000 at a Sim.Random Seed of 1.Run the simulation and answer the following question(s)using the Risk Solver Platform.
What is the value of mean absolute deviation obtained from the simulation results?
A)$10,893
B)$3,476
C)$7,412
D)$5,885
Question
Question
Use the information below to answer the following question(s).
Consider the following spreadsheet for an outsourcing decision model.
We assume that the production (demand)volume is normally distributed with a mean of 1,000 and a standard deviation of 100.For the unit cost, select the triangular distribution.It has a minimum value of $150, most likely value of $165, and a maximum value of $190.The number of trials per simulation is equal to 5,000 at a Sim.Random Seed of 1.Run the simulation and answer the following question(s)using the Risk Solver Platform.
What is the value of mode obtained from the simulation results?
A)$28,435
B)$26,287
C)$27,198
D)$25,394
Question
Question
Use the information below to answer the following question(s).
Consider the following spreadsheet for an outsourcing decision model.
We assume that the production (demand)volume is normally distributed with a mean of 1,000 and a standard deviation of 100.For the unit cost, select the triangular distribution.It has a minimum value of $150, most likely value of $165, and a maximum value of $190.The number of trials per simulation is equal to 5,000 at a Sim.Random Seed of 1.Run the simulation and answer the following question(s)using the Risk Solver Platform.
What is the cost difference lower cutoff if the likelihood is 60%?
A)approximately 13.63
B)approximately 22.45
C)approximately 29.67
D)approximately 38.97
Question
Use the information below to answer the following question(s).
Below is a spreadsheet for Trance Electronics.
Suppose that the project manager of Trance Electronics has identified the following uncertain variables in the model and the distributions and parameters that describe them, as follows:
Market size: normal with mean of 2,000,000 units and standard deviation of 400,000 units.
R&D costs: uniform between $600,000,000 and $800,000,000.
Clinical trial costs: lognormal with mean of $150,000,000 and standard deviation $30,000,000.
Annual market growth factor: triangular with minimum = 2%, maximum = 6%, and most likely = 3%.
Annual market share growth rate: triangular with minimum = 15%, maximum = 25%, and most likely = 20%.
The number of trials per simulation is equal to 10,000 at a Sim.Random Seed of 2.Run the simulation and answer the following questions using the Risk Solver Platform.
What is the risk that the net present value over the 5 years will not be positive?
A)approximately 40%
B)approximately 57%
C)approximately 24%
D)approximately 76%
Question
Use the information below to answer the following question(s).
Consider the following spreadsheet for an outsourcing decision model.
We assume that the production (demand)volume is normally distributed with a mean of 1,000 and a standard deviation of 100.For the unit cost, select the triangular distribution.It has a minimum value of $150, most likely value of $165, and a maximum value of $190.The number of trials per simulation is equal to 5,000 at a Sim.Random Seed of 1.Run the simulation and answer the following question(s)using the Risk Solver Platform.
What is the value of mean obtained from the simulation results? [Hint: Choose the nearest answer]
A)$18,385
B)$21,663
C)$14,894
D)$23,946
Question
Use the information below to answer the following question(s).
Consider the following spreadsheet for an outsourcing decision model.
We assume that the production (demand)volume is normally distributed with a mean of 1,000 and a standard deviation of 100.For the unit cost, select the triangular distribution.It has a minimum value of $150, most likely value of $165, and a maximum value of $190.The number of trials per simulation is equal to 5,000 at a Sim.Random Seed of 1.Run the simulation and answer the following question(s)using the Risk Solver Platform.
What is the cost difference upper cutoff if the likelihood is 75%?
A)approximately 46
B)approximately 28
C)approximately 32
D)approximately 59
Question
Question
Use the information below to answer the following question(s).
Below is a spreadsheet for Trance Electronics.
Suppose that the project manager of Trance Electronics has identified the following uncertain variables in the model and the distributions and parameters that describe them, as follows:
Market size: normal with mean of 2,000,000 units and standard deviation of 400,000 units.
R&D costs: uniform between $600,000,000 and $800,000,000.
Clinical trial costs: lognormal with mean of $150,000,000 and standard deviation $30,000,000.
Annual market growth factor: triangular with minimum = 2%, maximum = 6%, and most likely = 3%.
Annual market share growth rate: triangular with minimum = 15%, maximum = 25%, and most likely = 20%.
The number of trials per simulation is equal to 10,000 at a Sim.Random Seed of 2.Run the simulation and answer the following questions using the Risk Solver Platform.
What is the correlation of the R&D cost with the NPV with reference to the sensitivity chart?
A)-0.361
B)0)028
C)0)908
D)-0.194
Question
Question
Answer the following question(s)using the Risk Solver Platform (5000 trials per simulation).
Consider the spreadsheet for a Newsvendor Model.
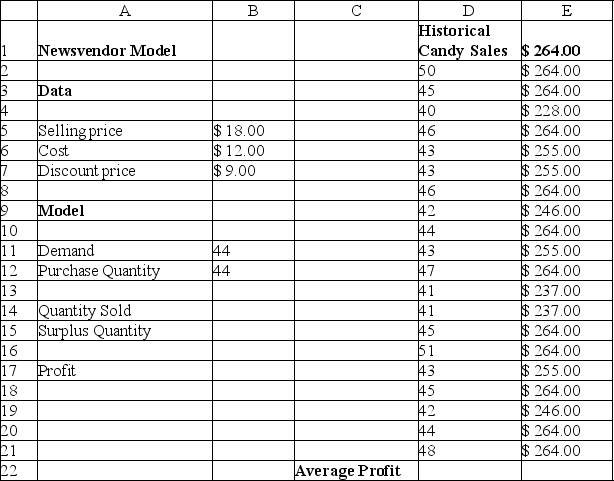
What is the value of mean profit?
A)$255.90
B)$251.45
C)$245.98
D)$264.00
Consider the spreadsheet for a Newsvendor Model.
What is the value of mean profit?
A)$255.90
B)$251.45
C)$245.98
D)$264.00
Question
Question
Use the information below to answer the following question(s).
Below is a spreadsheet for a hotel overbooking model.
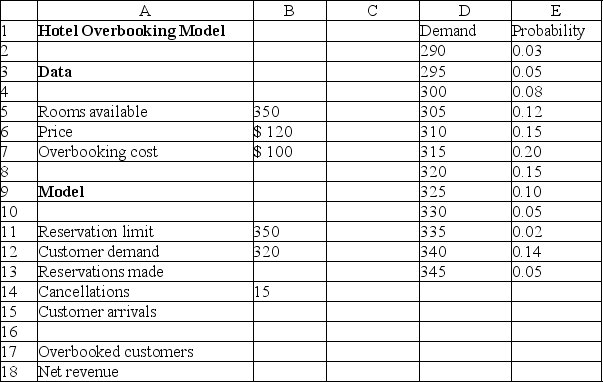
Assume that each reservation has a constant probability p = 0.04 of being cancelled.Answer the question(s)using the Risk Solver Platform.
With respect to B14, what should the number of trials correspond to in the Parameters section of the Binomial dialog?
A)reservation limit
B)customer demand
C)reservations made
D)customer arrivals
Below is a spreadsheet for a hotel overbooking model.
Assume that each reservation has a constant probability p = 0.04 of being cancelled.Answer the question(s)using the Risk Solver Platform.
With respect to B14, what should the number of trials correspond to in the Parameters section of the Binomial dialog?
A)reservation limit
B)customer demand
C)reservations made
D)customer arrivals
Question
Use the information below to answer the following question(s).
Below is a spreadsheet for a hotel overbooking model.
Assume that each reservation has a constant probability p = 0.04 of being cancelled.Answer the question(s)using the Risk Solver Platform.
With respect to B12, what is the range of weights given in the Parameters section in the Discrete dialog?
A)$E$2:$E$13
B)$D$2:$D$8
C)$D$2:$D$13
D)$E$2:$E$8
Question
Use the information below to answer the following question(s).
Below is a spreadsheet for a hotel overbooking model.
Assume that each reservation has a constant probability p = 0.04 of being cancelled.Answer the question(s)using the Risk Solver Platform.
Which of the following cells is defined as an output cell?
A)B13
B)B14
C)B15
D)B17
Below is a spreadsheet for a hotel overbooking model.
Assume that each reservation has a constant probability p = 0.04 of being cancelled.Answer the question(s)using the Risk Solver Platform.
Which of the following cells is defined as an output cell?
A)B13
B)B14
C)B15
D)B17
Question
Answer the following question(s)using the Risk Solver Platform (5000 trials per simulation).
Consider the spreadsheet for a Newsvendor Model.
What is the value of mode?
A)$228
B)$245
C)$255
D)$264
Consider the spreadsheet for a Newsvendor Model.
What is the value of mode?
A)$228
B)$245
C)$255
D)$264
Question
Answer the following question(s)using the Risk Solver Platform (5000 trials per simulation).
Consider the spreadsheet for a Newsvendor Model.
Which of the following cells is defined as the uncertain function cell?
A)B12
B)B14
C)B15
D)B17
Consider the spreadsheet for a Newsvendor Model.
Which of the following cells is defined as the uncertain function cell?
A)B12
B)B14
C)B15
D)B17
Question
Answer the following question(s)using the Risk Solver Platform (5000 trials per simulation).
Consider the spreadsheet for a Newsvendor Model.
What is the purchase quantity lower cutoff if the likelihood is 75%?
A)264
B)255
C)246
D)228
Consider the spreadsheet for a Newsvendor Model.
What is the purchase quantity lower cutoff if the likelihood is 75%?
A)264
B)255
C)246
D)228
Question
Use the information below to answer the following question(s).
Below is a spreadsheet for Trance Electronics.
Suppose that the project manager of Trance Electronics has identified the following uncertain variables in the model and the distributions and parameters that describe them, as follows:
Market size: normal with mean of 2,000,000 units and standard deviation of 400,000 units.
R&D costs: uniform between $600,000,000 and $800,000,000.
Clinical trial costs: lognormal with mean of $150,000,000 and standard deviation $30,000,000.
Annual market growth factor: triangular with minimum = 2%, maximum = 6%, and most likely = 3%.
Annual market share growth rate: triangular with minimum = 15%, maximum = 25%, and most likely = 20%.
The number of trials per simulation is equal to 10,000 at a Sim.Random Seed of 2.Run the simulation and answer the following questions using the Risk Solver Platform.
With reference to the trend chart, which year shows the highest mean net cumulative profit?
A)Year 1
B)Year 2
C)Year 4
D)Year 5
Question
Use the information below to answer the following question(s).
Below is a spreadsheet for Trance Electronics.
Suppose that the project manager of Trance Electronics has identified the following uncertain variables in the model and the distributions and parameters that describe them, as follows:
Market size: normal with mean of 2,000,000 units and standard deviation of 400,000 units.
R&D costs: uniform between $600,000,000 and $800,000,000.
Clinical trial costs: lognormal with mean of $150,000,000 and standard deviation $30,000,000.
Annual market growth factor: triangular with minimum = 2%, maximum = 6%, and most likely = 3%.
Annual market share growth rate: triangular with minimum = 15%, maximum = 25%, and most likely = 20%.
The number of trials per simulation is equal to 10,000 at a Sim.Random Seed of 2.Run the simulation and answer the following questions using the Risk Solver Platform.
What are the chances that the product will show a cumulative net profit in the fourth year?
A)approximately 25%
B)approximately 18%
C)approximately 11%
D)approximately 32%
Question
Question
Answer the following question(s)using the Risk Solver Platform (5000 trials per simulation).
Consider the spreadsheet for a Newsvendor Model.
What is the value of standard deviation?
A)$12.50
B)$10.99
C)$15.86
D)$20.25
Consider the spreadsheet for a Newsvendor Model.
What is the value of standard deviation?
A)$12.50
B)$10.99
C)$15.86
D)$20.25
Question
Use the information below to answer the following question(s).
Below is a spreadsheet for Trance Electronics.
Suppose that the project manager of Trance Electronics has identified the following uncertain variables in the model and the distributions and parameters that describe them, as follows:
Market size: normal with mean of 2,000,000 units and standard deviation of 400,000 units.
R&D costs: uniform between $600,000,000 and $800,000,000.
Clinical trial costs: lognormal with mean of $150,000,000 and standard deviation $30,000,000.
Annual market growth factor: triangular with minimum = 2%, maximum = 6%, and most likely = 3%.
Annual market share growth rate: triangular with minimum = 15%, maximum = 25%, and most likely = 20%.
The number of trials per simulation is equal to 10,000 at a Sim.Random Seed of 2.Run the simulation and answer the following questions using the Risk Solver Platform.
What cumulative profit in the fifth year is likely to be realized with a probability of 0.50?
A)$78,244,098
B)$102,573,415
C)$144,058,696
D)$203,676,827
Question
Use the information below to answer the following question(s).
Below is a spreadsheet for Trance Electronics.
Suppose that the project manager of Trance Electronics has identified the following uncertain variables in the model and the distributions and parameters that describe them, as follows:
Market size: normal with mean of 2,000,000 units and standard deviation of 400,000 units.
R&D costs: uniform between $600,000,000 and $800,000,000.
Clinical trial costs: lognormal with mean of $150,000,000 and standard deviation $30,000,000.
Annual market growth factor: triangular with minimum = 2%, maximum = 6%, and most likely = 3%.
Annual market share growth rate: triangular with minimum = 15%, maximum = 25%, and most likely = 20%.
The number of trials per simulation is equal to 10,000 at a Sim.Random Seed of 2.Run the simulation and answer the following questions using the Risk Solver Platform.
What is the correlation of the market size with the NPV with reference to the sensitivity chart?
A)0)043
B)0)910
C)-0.341
D)-0.026
Question
Answer the following question(s)using the Risk Solver Platform (5000 trials per simulation).
Consider the spreadsheet for a Newsvendor Model.
What is the value of mean absolute deviation?
A)$8.91
B)$5.45
C)$12.35
D)$15.64
Consider the spreadsheet for a Newsvendor Model.
What is the value of mean absolute deviation?
A)$8.91
B)$5.45
C)$12.35
D)$15.64
Question
Use the information below to answer the following question(s).
Below is a spreadsheet for Trance Electronics.
Suppose that the project manager of Trance Electronics has identified the following uncertain variables in the model and the distributions and parameters that describe them, as follows:
Market size: normal with mean of 2,000,000 units and standard deviation of 400,000 units.
R&D costs: uniform between $600,000,000 and $800,000,000.
Clinical trial costs: lognormal with mean of $150,000,000 and standard deviation $30,000,000.
Annual market growth factor: triangular with minimum = 2%, maximum = 6%, and most likely = 3%.
Annual market share growth rate: triangular with minimum = 15%, maximum = 25%, and most likely = 20%.
The number of trials per simulation is equal to 10,000 at a Sim.Random Seed of 2.Run the simulation and answer the following questions using the Risk Solver Platform.
With reference to the trend chart, which year shows the highest uncertainty in forecasting the future?
A)Year 1
B)Year 3
C)Year 4
D)Year 5
Question
Use the information below to answer the following question(s).
Below is a spreadsheet for a hotel overbooking model.
Assume that each reservation has a constant probability p = 0.04 of being cancelled.Answer the question(s)using the Risk Solver Platform.
With respect to B12, what is the range for values given in the Parameters section in the Discrete dialog?
A)$E$2:$E$13
B)$D$2:$D$8
C)$D$2:$D$13
D)$E$2:$E$8
Question
Question
Question
Question
Question
Question
Question
Question
Question
Question

Unlock Deck
Sign up to unlock the cards in this deck!
Unlock Deck
Unlock Deck
1/50
Play
Full screen (f)
Deck 11: Simulation and Risk Analysis
1
Use the information below to answer the following question(s).
Below is a spreadsheet for Trance Electronics.
Suppose that the project manager of Trance Electronics has identified the following uncertain variables in the model and the distributions and parameters that describe them, as follows:
Market size: normal with mean of 2,000,000 units and standard deviation of 400,000 units.
R&D costs: uniform between $600,000,000 and $800,000,000.
Clinical trial costs: lognormal with mean of $150,000,000 and standard deviation $30,000,000.
Annual market growth factor: triangular with minimum = 2%, maximum = 6%, and most likely = 3%.
Annual market share growth rate: triangular with minimum = 15%, maximum = 25%, and most likely = 20%.
The number of trials per simulation is equal to 10,000 at a Sim.Random Seed of 2.Run the simulation and answer the following questions using the Risk Solver Platform.
What is the expected loss ratio obtained from the simulation results of the net present value?
A)93.50%
B)72.45%
C)67.32%
D)85.42%
D
2
Which option in Risk Solver Platform allows you to choose the number of times random values can be generated for the uncertain cells in the model?
A)Trials per Simulation
B)Simulations to Run
C)Only Run
D)Sim.Random Seed
A)Trials per Simulation
B)Simulations to Run
C)Only Run
D)Sim.Random Seed
A
3
Use the information below to answer the following question(s).
Consider the following spreadsheet for an outsourcing decision model.
We assume that the production (demand)volume is normally distributed with a mean of 1,000 and a standard deviation of 100.For the unit cost, select the triangular distribution.It has a minimum value of $150, most likely value of $165, and a maximum value of $190.The number of trials per simulation is equal to 5,000 at a Sim.Random Seed of 1.Run the simulation and answer the following question(s)using the Risk Solver Platform.
What is the expected loss determined from the simulation results?
A)$(78)
B)$(120)
C)$(60)
D)$(39)
D
4
Use the information below to answer the following question(s).
Below is a spreadsheet for Trance Electronics.
Suppose that the project manager of Trance Electronics has identified the following uncertain variables in the model and the distributions and parameters that describe them, as follows:
Market size: normal with mean of 2,000,000 units and standard deviation of 400,000 units.
R&D costs: uniform between $600,000,000 and $800,000,000.
Clinical trial costs: lognormal with mean of $150,000,000 and standard deviation $30,000,000.
Annual market growth factor: triangular with minimum = 2%, maximum = 6%, and most likely = 3%.
Annual market share growth rate: triangular with minimum = 15%, maximum = 25%, and most likely = 20%.
The number of trials per simulation is equal to 10,000 at a Sim.Random Seed of 2.Run the simulation and answer the following questions using the Risk Solver Platform.
What is the standard deviation obtained from the simulation results of the net present value? [Hint: Choose the approximate value.]
A)$204,868,924
B)$162,135,408
C)$182,992,245
D)$148,384,456
Unlock Deck
Unlock for access to all 50 flashcards in this deck.
Unlock Deck
k this deck
5
Use the information below to answer the following question(s).
Consider the following spreadsheet for an outsourcing decision model.
We assume that the production (demand)volume is normally distributed with a mean of 1,000 and a standard deviation of 100.For the unit cost, select the triangular distribution.It has a minimum value of $150, most likely value of $165, and a maximum value of $190.The number of trials per simulation is equal to 5,000 at a Sim.Random Seed of 1.Run the simulation and answer the following question(s)using the Risk Solver Platform.
What is the value of standard deviation obtained from the simulation results?
A)$9,135
B)$7,884
C)$3,860
D)$12,870
Unlock Deck
Unlock for access to all 50 flashcards in this deck.
Unlock Deck
k this deck
6
Monte Carlo sampling differs from Latin Hypercube sampling in that the Monte Carlo sampling ________.
A)results in a more even distribution of output values
B)uses the entire range of the distribution in a more consistent manner
C)selects random variates independently over the entire range of possible values of the distribution
D)uses an uncertain variable whose probability distribution is divided into intervals of equal probability
Unlock Deck
Unlock for access to all 50 flashcards in this deck.
Unlock Deck
k this deck
7
Which of the following best defines Monte Carlo simulation?
A)It is a tool for building statistical models that characterize relationships among a dependent variable and one or more independent variables.
B)It is a collection of techniques that seek to group or segment a collection of objects into subsets.
C)It is the process of selecting values of decision variables that minimize or maximize some quantity of interest.
D)It is the process of generating random values for uncertain inputs in a model and computing the output variables of interest.
Unlock Deck
Unlock for access to all 50 flashcards in this deck.
Unlock Deck
k this deck
8
How does the Risk Solver Platform define an uncertain function cell?
A)It is a cell that contains a triangular distribution function.
B)It is a cell in which a distribution of output values is created from the model.
C)It is a cell in which an uncertain variable is used to define a distribution.
D)It is a cell that can only be defined by discrete distributions.
A)It is a cell that contains a triangular distribution function.
B)It is a cell in which a distribution of output values is created from the model.
C)It is a cell in which an uncertain variable is used to define a distribution.
D)It is a cell that can only be defined by discrete distributions.
Unlock Deck
Unlock for access to all 50 flashcards in this deck.
Unlock Deck
k this deck
9
Use the information below to answer the following question(s).
Below is a spreadsheet for Trance Electronics.
Suppose that the project manager of Trance Electronics has identified the following uncertain variables in the model and the distributions and parameters that describe them, as follows:
Market size: normal with mean of 2,000,000 units and standard deviation of 400,000 units.
R&D costs: uniform between $600,000,000 and $800,000,000.
Clinical trial costs: lognormal with mean of $150,000,000 and standard deviation $30,000,000.
Annual market growth factor: triangular with minimum = 2%, maximum = 6%, and most likely = 3%.
Annual market share growth rate: triangular with minimum = 15%, maximum = 25%, and most likely = 20%.
The number of trials per simulation is equal to 10,000 at a Sim.Random Seed of 2.Run the simulation and answer the following questions using the Risk Solver Platform.
What is the coefficient of variation obtained from the simulation results of the net present value?
A)1)78392
B)-2.23958
C)-1.43288
D)2)87645
Unlock Deck
Unlock for access to all 50 flashcards in this deck.
Unlock Deck
k this deck
10
Why is the ROUND function used in Excel?
A)to ensure that the values generated are whole numbers
B)to ensure that the values generated are multiples of ten
C)to ensure that the values generated are always positive
D)to ensure that the values are even numbers
A)to ensure that the values generated are whole numbers
B)to ensure that the values generated are multiples of ten
C)to ensure that the values generated are always positive
D)to ensure that the values are even numbers
Unlock Deck
Unlock for access to all 50 flashcards in this deck.
Unlock Deck
k this deck
11
Latin Hypercube sampling differs from Monte Carlo sampling in that the Latin Hypercube sampling ________.
A)selects random variates independently over the entire range of possible values of the distribution
B)uses an uncertain variable whose probability distribution is divided into intervals of equal probability
C)is used for evaluating the model performance under various what-if scenarios
D)achieves less accurate forecast statistics for a fixed number of trials
Unlock Deck
Unlock for access to all 50 flashcards in this deck.
Unlock Deck
k this deck
12
Use the information below to answer the following question(s).
Below is a spreadsheet for Trance Electronics.
Suppose that the project manager of Trance Electronics has identified the following uncertain variables in the model and the distributions and parameters that describe them, as follows:
Market size: normal with mean of 2,000,000 units and standard deviation of 400,000 units.
R&D costs: uniform between $600,000,000 and $800,000,000.
Clinical trial costs: lognormal with mean of $150,000,000 and standard deviation $30,000,000.
Annual market growth factor: triangular with minimum = 2%, maximum = 6%, and most likely = 3%.
Annual market share growth rate: triangular with minimum = 15%, maximum = 25%, and most likely = 20%.
The number of trials per simulation is equal to 10,000 at a Sim.Random Seed of 2.Run the simulation and answer the following questions using the Risk Solver Platform.
What is the expected value margin obtained from the simulation results of the net present value?
A)0)864
B)-0.708
C)0)343
D)-0.467
Unlock Deck
Unlock for access to all 50 flashcards in this deck.
Unlock Deck
k this deck
13
Use the information below to answer the following question(s).
Consider the following spreadsheet for an outsourcing decision model.
We assume that the production (demand)volume is normally distributed with a mean of 1,000 and a standard deviation of 100.For the unit cost, select the triangular distribution.It has a minimum value of $150, most likely value of $165, and a maximum value of $190.The number of trials per simulation is equal to 5,000 at a Sim.Random Seed of 1.Run the simulation and answer the following question(s)using the Risk Solver Platform.
What is the value of mean absolute deviation obtained from the simulation results?
A)$10,893
B)$3,476
C)$7,412
D)$5,885
Unlock Deck
Unlock for access to all 50 flashcards in this deck.
Unlock Deck
k this deck
14
Which of the following statements is true of a triangular distribution?
A)We are required to know only the smallest and largest possible values that the variable might assume.
B)These distributions depend on multiple parameters that one can easily identify based on managerial knowledge and judgment.
C)The distribution has a limited range and can be skewed in either direction.
D)The distribution is very positively skewed, with no negative values.
Unlock Deck
Unlock for access to all 50 flashcards in this deck.
Unlock Deck
k this deck
15
Use the information below to answer the following question(s).
Consider the following spreadsheet for an outsourcing decision model.
We assume that the production (demand)volume is normally distributed with a mean of 1,000 and a standard deviation of 100.For the unit cost, select the triangular distribution.It has a minimum value of $150, most likely value of $165, and a maximum value of $190.The number of trials per simulation is equal to 5,000 at a Sim.Random Seed of 1.Run the simulation and answer the following question(s)using the Risk Solver Platform.
What is the value of mode obtained from the simulation results?
A)$28,435
B)$26,287
C)$27,198
D)$25,394
Unlock Deck
Unlock for access to all 50 flashcards in this deck.
Unlock Deck
k this deck
16
Which of the following is a parameter in the Normal Distribution Dialog of the Risk Solver Platform?
A)maximum value
B)minimum value
C)most likely value
D)mean
A)maximum value
B)minimum value
C)most likely value
D)mean
Unlock Deck
Unlock for access to all 50 flashcards in this deck.
Unlock Deck
k this deck
17
Use the information below to answer the following question(s).
Consider the following spreadsheet for an outsourcing decision model.
We assume that the production (demand)volume is normally distributed with a mean of 1,000 and a standard deviation of 100.For the unit cost, select the triangular distribution.It has a minimum value of $150, most likely value of $165, and a maximum value of $190.The number of trials per simulation is equal to 5,000 at a Sim.Random Seed of 1.Run the simulation and answer the following question(s)using the Risk Solver Platform.
What is the cost difference lower cutoff if the likelihood is 60%?
A)approximately 13.63
B)approximately 22.45
C)approximately 29.67
D)approximately 38.97
Unlock Deck
Unlock for access to all 50 flashcards in this deck.
Unlock Deck
k this deck
18
Use the information below to answer the following question(s).
Below is a spreadsheet for Trance Electronics.
Suppose that the project manager of Trance Electronics has identified the following uncertain variables in the model and the distributions and parameters that describe them, as follows:
Market size: normal with mean of 2,000,000 units and standard deviation of 400,000 units.
R&D costs: uniform between $600,000,000 and $800,000,000.
Clinical trial costs: lognormal with mean of $150,000,000 and standard deviation $30,000,000.
Annual market growth factor: triangular with minimum = 2%, maximum = 6%, and most likely = 3%.
Annual market share growth rate: triangular with minimum = 15%, maximum = 25%, and most likely = 20%.
The number of trials per simulation is equal to 10,000 at a Sim.Random Seed of 2.Run the simulation and answer the following questions using the Risk Solver Platform.
What is the risk that the net present value over the 5 years will not be positive?
A)approximately 40%
B)approximately 57%
C)approximately 24%
D)approximately 76%
Unlock Deck
Unlock for access to all 50 flashcards in this deck.
Unlock Deck
k this deck
19
Use the information below to answer the following question(s).
Consider the following spreadsheet for an outsourcing decision model.
We assume that the production (demand)volume is normally distributed with a mean of 1,000 and a standard deviation of 100.For the unit cost, select the triangular distribution.It has a minimum value of $150, most likely value of $165, and a maximum value of $190.The number of trials per simulation is equal to 5,000 at a Sim.Random Seed of 1.Run the simulation and answer the following question(s)using the Risk Solver Platform.
What is the value of mean obtained from the simulation results? [Hint: Choose the nearest answer]
A)$18,385
B)$21,663
C)$14,894
D)$23,946
Unlock Deck
Unlock for access to all 50 flashcards in this deck.
Unlock Deck
k this deck
20
Use the information below to answer the following question(s).
Consider the following spreadsheet for an outsourcing decision model.
We assume that the production (demand)volume is normally distributed with a mean of 1,000 and a standard deviation of 100.For the unit cost, select the triangular distribution.It has a minimum value of $150, most likely value of $165, and a maximum value of $190.The number of trials per simulation is equal to 5,000 at a Sim.Random Seed of 1.Run the simulation and answer the following question(s)using the Risk Solver Platform.
What is the cost difference upper cutoff if the likelihood is 75%?
A)approximately 46
B)approximately 28
C)approximately 32
D)approximately 59
Unlock Deck
Unlock for access to all 50 flashcards in this deck.
Unlock Deck
k this deck
21
The Risk Solver Platform ________ chart shows the minimum, first quartile, median, third quartile, and maximum values in a data set graphically.
A)trend
B)sensitivity
C)overlay
D)box-whisker
A)trend
B)sensitivity
C)overlay
D)box-whisker
Unlock Deck
Unlock for access to all 50 flashcards in this deck.
Unlock Deck
k this deck
22
Use the information below to answer the following question(s).
Below is a spreadsheet for Trance Electronics.
Suppose that the project manager of Trance Electronics has identified the following uncertain variables in the model and the distributions and parameters that describe them, as follows:
Market size: normal with mean of 2,000,000 units and standard deviation of 400,000 units.
R&D costs: uniform between $600,000,000 and $800,000,000.
Clinical trial costs: lognormal with mean of $150,000,000 and standard deviation $30,000,000.
Annual market growth factor: triangular with minimum = 2%, maximum = 6%, and most likely = 3%.
Annual market share growth rate: triangular with minimum = 15%, maximum = 25%, and most likely = 20%.
The number of trials per simulation is equal to 10,000 at a Sim.Random Seed of 2.Run the simulation and answer the following questions using the Risk Solver Platform.
What is the correlation of the R&D cost with the NPV with reference to the sensitivity chart?
A)-0.361
B)0)028
C)0)908
D)-0.194
Unlock Deck
Unlock for access to all 50 flashcards in this deck.
Unlock Deck
k this deck
23
The Risk Solver Platform ________ feature allows you to determine the influence that each uncertain model input has individually on an output variable based on its correlation with the output variable.
A)trend chart
B)sensitivity chart
C)overlay chart
D)box-whisker chart
A)trend chart
B)sensitivity chart
C)overlay chart
D)box-whisker chart
Unlock Deck
Unlock for access to all 50 flashcards in this deck.
Unlock Deck
k this deck
24
Answer the following question(s)using the Risk Solver Platform (5000 trials per simulation).
Consider the spreadsheet for a Newsvendor Model.
What is the value of mean profit?
A)$255.90
B)$251.45
C)$245.98
D)$264.00
Consider the spreadsheet for a Newsvendor Model.
What is the value of mean profit?
A)$255.90
B)$251.45
C)$245.98
D)$264.00
Unlock Deck
Unlock for access to all 50 flashcards in this deck.
Unlock Deck
k this deck
25
The Risk Solver Platform ________ feature allows you to superimpose the frequency distributions from selected forecasts on one chart in order to compare differences and similarities that might not be apparent.
A)trend chart
B)sensitivity chart
C)overlay chart
D)box-whisker chart
A)trend chart
B)sensitivity chart
C)overlay chart
D)box-whisker chart
Unlock Deck
Unlock for access to all 50 flashcards in this deck.
Unlock Deck
k this deck
26
Use the information below to answer the following question(s).
Below is a spreadsheet for a hotel overbooking model.
Assume that each reservation has a constant probability p = 0.04 of being cancelled.Answer the question(s)using the Risk Solver Platform.
With respect to B14, what should the number of trials correspond to in the Parameters section of the Binomial dialog?
A)reservation limit
B)customer demand
C)reservations made
D)customer arrivals
Unlock Deck
Unlock for access to all 50 flashcards in this deck.
Unlock Deck
k this deck
27
Use the information below to answer the following question(s).
Below is a spreadsheet for a hotel overbooking model.
Assume that each reservation has a constant probability p = 0.04 of being cancelled.Answer the question(s)using the Risk Solver Platform.
With respect to B12, what is the range of weights given in the Parameters section in the Discrete dialog?
A)$E$2:$E$13
B)$D$2:$D$8
C)$D$2:$D$13
D)$E$2:$E$8
Unlock Deck
Unlock for access to all 50 flashcards in this deck.
Unlock Deck
k this deck
28
Use the information below to answer the following question(s).
Below is a spreadsheet for a hotel overbooking model.
Assume that each reservation has a constant probability p = 0.04 of being cancelled.Answer the question(s)using the Risk Solver Platform.
Which of the following cells is defined as an output cell?
A)B13
B)B14
C)B15
D)B17
Below is a spreadsheet for a hotel overbooking model.
Assume that each reservation has a constant probability p = 0.04 of being cancelled.Answer the question(s)using the Risk Solver Platform.
Which of the following cells is defined as an output cell?
A)B13
B)B14
C)B15
D)B17
Unlock Deck
Unlock for access to all 50 flashcards in this deck.
Unlock Deck
k this deck
29
Answer the following question(s)using the Risk Solver Platform (5000 trials per simulation).
Consider the spreadsheet for a Newsvendor Model.
What is the value of mode?
A)$228
B)$245
C)$255
D)$264
Consider the spreadsheet for a Newsvendor Model.
What is the value of mode?
A)$228
B)$245
C)$255
D)$264
Unlock Deck
Unlock for access to all 50 flashcards in this deck.
Unlock Deck
k this deck
30
Answer the following question(s)using the Risk Solver Platform (5000 trials per simulation).
Consider the spreadsheet for a Newsvendor Model.
Which of the following cells is defined as the uncertain function cell?
A)B12
B)B14
C)B15
D)B17
Consider the spreadsheet for a Newsvendor Model.
Which of the following cells is defined as the uncertain function cell?
A)B12
B)B14
C)B15
D)B17
Unlock Deck
Unlock for access to all 50 flashcards in this deck.
Unlock Deck
k this deck
31
Answer the following question(s)using the Risk Solver Platform (5000 trials per simulation).
Consider the spreadsheet for a Newsvendor Model.
What is the purchase quantity lower cutoff if the likelihood is 75%?
A)264
B)255
C)246
D)228
Consider the spreadsheet for a Newsvendor Model.
What is the purchase quantity lower cutoff if the likelihood is 75%?
A)264
B)255
C)246
D)228
Unlock Deck
Unlock for access to all 50 flashcards in this deck.
Unlock Deck
k this deck
32
Use the information below to answer the following question(s).
Below is a spreadsheet for Trance Electronics.
Suppose that the project manager of Trance Electronics has identified the following uncertain variables in the model and the distributions and parameters that describe them, as follows:
Market size: normal with mean of 2,000,000 units and standard deviation of 400,000 units.
R&D costs: uniform between $600,000,000 and $800,000,000.
Clinical trial costs: lognormal with mean of $150,000,000 and standard deviation $30,000,000.
Annual market growth factor: triangular with minimum = 2%, maximum = 6%, and most likely = 3%.
Annual market share growth rate: triangular with minimum = 15%, maximum = 25%, and most likely = 20%.
The number of trials per simulation is equal to 10,000 at a Sim.Random Seed of 2.Run the simulation and answer the following questions using the Risk Solver Platform.
With reference to the trend chart, which year shows the highest mean net cumulative profit?
A)Year 1
B)Year 2
C)Year 4
D)Year 5
Unlock Deck
Unlock for access to all 50 flashcards in this deck.
Unlock Deck
k this deck
33
Use the information below to answer the following question(s).
Below is a spreadsheet for Trance Electronics.
Suppose that the project manager of Trance Electronics has identified the following uncertain variables in the model and the distributions and parameters that describe them, as follows:
Market size: normal with mean of 2,000,000 units and standard deviation of 400,000 units.
R&D costs: uniform between $600,000,000 and $800,000,000.
Clinical trial costs: lognormal with mean of $150,000,000 and standard deviation $30,000,000.
Annual market growth factor: triangular with minimum = 2%, maximum = 6%, and most likely = 3%.
Annual market share growth rate: triangular with minimum = 15%, maximum = 25%, and most likely = 20%.
The number of trials per simulation is equal to 10,000 at a Sim.Random Seed of 2.Run the simulation and answer the following questions using the Risk Solver Platform.
What are the chances that the product will show a cumulative net profit in the fourth year?
A)approximately 25%
B)approximately 18%
C)approximately 11%
D)approximately 32%
Unlock Deck
Unlock for access to all 50 flashcards in this deck.
Unlock Deck
k this deck
34
If a simulation has multiple output variables that are related to one another, the distributions of all output variables can be viewed on a single Risk Solver Platform chart called a(n)________.
A)trend chart
B)sensitivity chart
C)overlay chart
D)box-whisker chart
A)trend chart
B)sensitivity chart
C)overlay chart
D)box-whisker chart
Unlock Deck
Unlock for access to all 50 flashcards in this deck.
Unlock Deck
k this deck
35
Answer the following question(s)using the Risk Solver Platform (5000 trials per simulation).
Consider the spreadsheet for a Newsvendor Model.
What is the value of standard deviation?
A)$12.50
B)$10.99
C)$15.86
D)$20.25
Consider the spreadsheet for a Newsvendor Model.
What is the value of standard deviation?
A)$12.50
B)$10.99
C)$15.86
D)$20.25
Unlock Deck
Unlock for access to all 50 flashcards in this deck.
Unlock Deck
k this deck
36
Use the information below to answer the following question(s).
Below is a spreadsheet for Trance Electronics.
Suppose that the project manager of Trance Electronics has identified the following uncertain variables in the model and the distributions and parameters that describe them, as follows:
Market size: normal with mean of 2,000,000 units and standard deviation of 400,000 units.
R&D costs: uniform between $600,000,000 and $800,000,000.
Clinical trial costs: lognormal with mean of $150,000,000 and standard deviation $30,000,000.
Annual market growth factor: triangular with minimum = 2%, maximum = 6%, and most likely = 3%.
Annual market share growth rate: triangular with minimum = 15%, maximum = 25%, and most likely = 20%.
The number of trials per simulation is equal to 10,000 at a Sim.Random Seed of 2.Run the simulation and answer the following questions using the Risk Solver Platform.
What cumulative profit in the fifth year is likely to be realized with a probability of 0.50?
A)$78,244,098
B)$102,573,415
C)$144,058,696
D)$203,676,827
Unlock Deck
Unlock for access to all 50 flashcards in this deck.
Unlock Deck
k this deck
37
Use the information below to answer the following question(s).
Below is a spreadsheet for Trance Electronics.
Suppose that the project manager of Trance Electronics has identified the following uncertain variables in the model and the distributions and parameters that describe them, as follows:
Market size: normal with mean of 2,000,000 units and standard deviation of 400,000 units.
R&D costs: uniform between $600,000,000 and $800,000,000.
Clinical trial costs: lognormal with mean of $150,000,000 and standard deviation $30,000,000.
Annual market growth factor: triangular with minimum = 2%, maximum = 6%, and most likely = 3%.
Annual market share growth rate: triangular with minimum = 15%, maximum = 25%, and most likely = 20%.
The number of trials per simulation is equal to 10,000 at a Sim.Random Seed of 2.Run the simulation and answer the following questions using the Risk Solver Platform.
What is the correlation of the market size with the NPV with reference to the sensitivity chart?
A)0)043
B)0)910
C)-0.341
D)-0.026
Unlock Deck
Unlock for access to all 50 flashcards in this deck.
Unlock Deck
k this deck
38
Answer the following question(s)using the Risk Solver Platform (5000 trials per simulation).
Consider the spreadsheet for a Newsvendor Model.
What is the value of mean absolute deviation?
A)$8.91
B)$5.45
C)$12.35
D)$15.64
Consider the spreadsheet for a Newsvendor Model.
What is the value of mean absolute deviation?
A)$8.91
B)$5.45
C)$12.35
D)$15.64
Unlock Deck
Unlock for access to all 50 flashcards in this deck.
Unlock Deck
k this deck
39
Use the information below to answer the following question(s).
Below is a spreadsheet for Trance Electronics.
Suppose that the project manager of Trance Electronics has identified the following uncertain variables in the model and the distributions and parameters that describe them, as follows:
Market size: normal with mean of 2,000,000 units and standard deviation of 400,000 units.
R&D costs: uniform between $600,000,000 and $800,000,000.
Clinical trial costs: lognormal with mean of $150,000,000 and standard deviation $30,000,000.
Annual market growth factor: triangular with minimum = 2%, maximum = 6%, and most likely = 3%.
Annual market share growth rate: triangular with minimum = 15%, maximum = 25%, and most likely = 20%.
The number of trials per simulation is equal to 10,000 at a Sim.Random Seed of 2.Run the simulation and answer the following questions using the Risk Solver Platform.
With reference to the trend chart, which year shows the highest uncertainty in forecasting the future?
A)Year 1
B)Year 3
C)Year 4
D)Year 5
Unlock Deck
Unlock for access to all 50 flashcards in this deck.
Unlock Deck
k this deck
40
Use the information below to answer the following question(s).
Below is a spreadsheet for a hotel overbooking model.
Assume that each reservation has a constant probability p = 0.04 of being cancelled.Answer the question(s)using the Risk Solver Platform.
With respect to B12, what is the range for values given in the Parameters section in the Discrete dialog?
A)$E$2:$E$13
B)$D$2:$D$8
C)$D$2:$D$13
D)$E$2:$E$8
Unlock Deck
Unlock for access to all 50 flashcards in this deck.
Unlock Deck
k this deck
41
Explain the concept of the "flaw of averages."
Unlock Deck
Unlock for access to all 50 flashcards in this deck.
Unlock Deck
k this deck
42
Uniform or triangular distributions are used in the absence of data.
Unlock Deck
Unlock for access to all 50 flashcards in this deck.
Unlock Deck
k this deck
43
Explain the process of running a simulation using Risk Solver Platform.
Unlock Deck
Unlock for access to all 50 flashcards in this deck.
Unlock Deck
k this deck
44
What are the benefits of a Risk Solver Platform sensitivity chart?
Unlock Deck
Unlock for access to all 50 flashcards in this deck.
Unlock Deck
k this deck
45
Monte Carlo simulation is an inappropriate tool to analyze cash budgets because of the inherent uncertainty of the sales forecasts on which most cash budgets are based.
Unlock Deck
Unlock for access to all 50 flashcards in this deck.
Unlock Deck
k this deck
46
What are three types of Risk Solver Platform charts used to obtain multiple simulation results?
Unlock Deck
Unlock for access to all 50 flashcards in this deck.
Unlock Deck
k this deck
47
As Monte Carlo simulation is essentially statistical sampling, the larger the number of trials used, the more precise is the result.
Unlock Deck
Unlock for access to all 50 flashcards in this deck.
Unlock Deck
k this deck
48
A normal distribution has a limited range and can be skewed in either direction.
Unlock Deck
Unlock for access to all 50 flashcards in this deck.
Unlock Deck
k this deck
49
What is Monte Carlo simulation?
Unlock Deck
Unlock for access to all 50 flashcards in this deck.
Unlock Deck
k this deck
50
Using an empirical distribution precludes sampling values outside the range of the actual data.
Unlock Deck
Unlock for access to all 50 flashcards in this deck.
Unlock Deck
k this deck
Unlock Deck
Unlock for access to all 50 flashcards in this deck.


