Exam 11: Simulation and Risk Analysis
Exam 1: Introduction to Business Analytics50 Questions
Exam 2: Analytics on Spreadsheets52 Questions
Exam 3: Visualizing and Exploring Data50 Questions
Exam 4: Descriptive Statistical Measures79 Questions
Exam 5: Probability Distributions and Data Modeling50 Questions
Exam 6: Sampling and Estimation59 Questions
Exam 7: Statistical Inference50 Questions
Exam 8: Predictive Modeling and Analysis64 Questions
Exam 9: Regression Analysis50 Questions
Exam 10: Forecasting Techniques55 Questions
Exam 11: Simulation and Risk Analysis50 Questions
Exam 12: Introduction to Data Mining53 Questions
Exam 13: Linear Optimization50 Questions
Exam 14: Applications of Linear Optimization62 Questions
Exam 15: Integer Optimization50 Questions
Exam 16: Nonlinear and Non-Smooth Optimization66 Questions
Exam 17: Optimization Models with Uncertainty50 Questions
Exam 18: Decision Analysis50 Questions
Select questions type
Using an empirical distribution precludes sampling values outside the range of the actual data.
Free
(True/False)
5.0/5  (29)
(29)
Correct Answer: Verified
True
Use the information below to answer the following question(s).
Consider the following spreadsheet for an outsourcing decision model.
1 \ A B 2 Outsourcing Decision Model 3 Data 4 5 Manufactured in-house 6 Fixed cost \ 60,000 7 Unit variable cost \ 130 8 9 Purchased from supplier 10 Unit cost \ 180 11 12 Demand volume \ 1,600 13 14 Model 15 16 Total manufacturing cost 17 Total purchased cost 18 19 Difference 20 Decision
We assume that the production (demand)volume is normally distributed with a mean of 1,000 and a standard deviation of 100.For the unit cost, select the triangular distribution.It has a minimum value of $150, most likely value of $165, and a maximum value of $190.The number of trials per simulation is equal to 5,000 at a Sim.Random Seed of 1.Run the simulation and answer the following question(s)using the Risk Solver Platform.
-What is the value of mean absolute deviation obtained from the simulation results?
Free
(Multiple Choice)
4.9/5 (40)
Correct Answer:Verified
C
Use the information below to answer the following question(s).
Below is a spreadsheet for a hotel overbooking model.
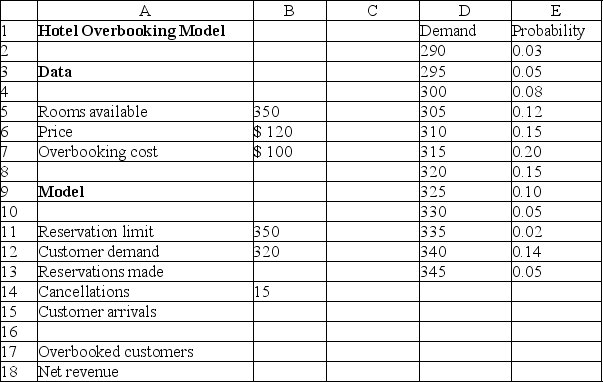 Assume that each reservation has a constant probability p = 0.04 of being cancelled.Answer the question(s)using the Risk Solver Platform.
-Which of the following cells is defined as an output cell?
Assume that each reservation has a constant probability p = 0.04 of being cancelled.Answer the question(s)using the Risk Solver Platform.
-Which of the following cells is defined as an output cell?
Free
(Multiple Choice)
4.8/5 (31)
Correct Answer:Verified
D
Use the information below to answer the following question(s).
Below is a spreadsheet for Trance Electronics.
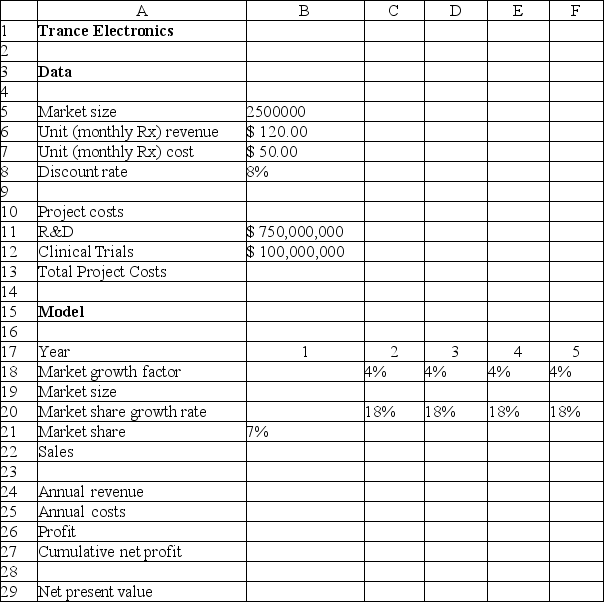 Suppose that the project manager of Trance Electronics has identified the following uncertain variables in the model and the distributions and parameters that describe them, as follows:
 : normal with mean of 2,000,000 units and standard deviation of 400,000 units.
 : uniform between $600,000,000 and $800,000,000.
 : lognormal with mean of $150,000,000 and standard deviation $30,000,000.
 : triangular with minimum = 2%, maximum = 6%, and most likely = 3%.
 : triangular with minimum = 15%, maximum = 25%, and most likely = 20%.
The number of trials per simulation is equal to 10,000 at a Sim.Random Seed of 2.Run the simulation and answer the following questions using the Risk Solver Platform.
-What is the correlation of the market size with the NPV with reference to the sensitivity chart?
: triangular with minimum = 15%, maximum = 25%, and most likely = 20%.
The number of trials per simulation is equal to 10,000 at a Sim.Random Seed of 2.Run the simulation and answer the following questions using the Risk Solver Platform.
-What is the correlation of the market size with the NPV with reference to the sensitivity chart?
(Multiple Choice)
4.7/5 (36)
Use the information below to answer the following question(s).
Below is a spreadsheet for Trance Electronics.
Suppose that the project manager of Trance Electronics has identified the following uncertain variables in the model and the distributions and parameters that describe them, as follows:
: normal with mean of 2,000,000 units and standard deviation of 400,000 units.
: uniform between $600,000,000 and $800,000,000.
: lognormal with mean of $150,000,000 and standard deviation $30,000,000.
: triangular with minimum = 2%, maximum = 6%, and most likely = 3%.
: triangular with minimum = 15%, maximum = 25%, and most likely = 20%.
The number of trials per simulation is equal to 10,000 at a Sim.Random Seed of 2.Run the simulation and answer the following questions using the Risk Solver Platform.
-With reference to the trend chart, which year shows the highest uncertainty in forecasting the future?
(Multiple Choice)
4.8/5 (37)
Use the information below to answer the following question(s).
Below is a spreadsheet for Trance Electronics.
Suppose that the project manager of Trance Electronics has identified the following uncertain variables in the model and the distributions and parameters that describe them, as follows:
: normal with mean of 2,000,000 units and standard deviation of 400,000 units.
: uniform between $600,000,000 and $800,000,000.
: lognormal with mean of $150,000,000 and standard deviation $30,000,000.
: triangular with minimum = 2%, maximum = 6%, and most likely = 3%.
: triangular with minimum = 15%, maximum = 25%, and most likely = 20%.
The number of trials per simulation is equal to 10,000 at a Sim.Random Seed of 2.Run the simulation and answer the following questions using the Risk Solver Platform.
-What cumulative profit in the fifth year is likely to be realized with a probability of 0.50?
(Multiple Choice)
5.0/5 (38)
Explain the process of running a simulation using Risk Solver Platform.
(Essay)
4.8/5 (39)
Answer the following question(s)using the Risk Solver Platform (5000 trials per simulation).
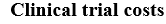
Consider the spreadsheet for a Newsvendor Model.
 -Which of the following cells is defined as the uncertain function cell?
(Multiple Choice)
4.8/5 (35)
Answer the following question(s)using the Risk Solver Platform (5000 trials per simulation).
Consider the spreadsheet for a Newsvendor Model.
-What is the purchase quantity lower cutoff if the likelihood is 75%?
(Multiple Choice)
4.9/5 (35)
Use the information below to answer the following question(s).
Below is a spreadsheet for Trance Electronics.
Suppose that the project manager of Trance Electronics has identified the following uncertain variables in the model and the distributions and parameters that describe them, as follows:
: normal with mean of 2,000,000 units and standard deviation of 400,000 units.
: uniform between $600,000,000 and $800,000,000.
: lognormal with mean of $150,000,000 and standard deviation $30,000,000.
: triangular with minimum = 2%, maximum = 6%, and most likely = 3%.
: triangular with minimum = 15%, maximum = 25%, and most likely = 20%.
The number of trials per simulation is equal to 10,000 at a Sim.Random Seed of 2.Run the simulation and answer the following questions using the Risk Solver Platform.
-With reference to the trend chart, which year shows the highest mean net cumulative profit?
(Multiple Choice)
4.8/5 (34)
A normal distribution has a limited range and can be skewed in either direction.
(True/False)
4.9/5 (38)
Use the information below to answer the following question(s).
Below is a spreadsheet for Trance Electronics.
Suppose that the project manager of Trance Electronics has identified the following uncertain variables in the model and the distributions and parameters that describe them, as follows:
: normal with mean of 2,000,000 units and standard deviation of 400,000 units.
: uniform between $600,000,000 and $800,000,000.
: lognormal with mean of $150,000,000 and standard deviation $30,000,000.
: triangular with minimum = 2%, maximum = 6%, and most likely = 3%.
: triangular with minimum = 15%, maximum = 25%, and most likely = 20%.
The number of trials per simulation is equal to 10,000 at a Sim.Random Seed of 2.Run the simulation and answer the following questions using the Risk Solver Platform.
-What is the standard deviation obtained from the simulation results of the net present value? [Hint: Choose the approximate value.]
(Multiple Choice)
4.9/5 (28)
Which of the following best defines Monte Carlo simulation?
(Multiple Choice)
4.8/5 (28)
Uniform or triangular distributions are used in the absence of data.
(True/False)
4.8/5 (41)
The Risk Solver Platform ________ chart shows the minimum, first quartile, median, third quartile, and maximum values in a data set graphically.
(Multiple Choice)
4.7/5 (36)
Use the information below to answer the following question(s).
Below is a spreadsheet for a hotel overbooking model.
Assume that each reservation has a constant probability p = 0.04 of being cancelled.Answer the question(s)using the Risk Solver Platform.
-With respect to B12, what is the range of weights given in the Parameters section in the Discrete dialog?
(Multiple Choice)
4.9/5 (40)
Use the information below to answer the following question(s).
Below is a spreadsheet for Trance Electronics.
Suppose that the project manager of Trance Electronics has identified the following uncertain variables in the model and the distributions and parameters that describe them, as follows:
: normal with mean of 2,000,000 units and standard deviation of 400,000 units.
: uniform between $600,000,000 and $800,000,000.
: lognormal with mean of $150,000,000 and standard deviation $30,000,000.
: triangular with minimum = 2%, maximum = 6%, and most likely = 3%.
: triangular with minimum = 15%, maximum = 25%, and most likely = 20%.
The number of trials per simulation is equal to 10,000 at a Sim.Random Seed of 2.Run the simulation and answer the following questions using the Risk Solver Platform.
-What is the coefficient of variation obtained from the simulation results of the net present value?
(Multiple Choice)
4.8/5 (32)
Answer the following question(s)using the Risk Solver Platform (5000 trials per simulation).
Consider the spreadsheet for a Newsvendor Model.
-What is the value of standard deviation?
(Multiple Choice)
4.8/5 (27)
Use the information below to answer the following question(s).
Consider the following spreadsheet for an outsourcing decision model.
1 \ A B 2 Outsourcing Decision Model 3 Data 4 5 Manufactured in-house 6 Fixed cost \ 60,000 7 Unit variable cost \ 130 8 9 Purchased from supplier 10 Unit cost \ 180 11 12 Demand volume \ 1,600 13 14 Model 15 16 Total manufacturing cost 17 Total purchased cost 18 19 Difference 20 Decision
We assume that the production (demand)volume is normally distributed with a mean of 1,000 and a standard deviation of 100.For the unit cost, select the triangular distribution.It has a minimum value of $150, most likely value of $165, and a maximum value of $190.The number of trials per simulation is equal to 5,000 at a Sim.Random Seed of 1.Run the simulation and answer the following question(s)using the Risk Solver Platform.
-What is the cost difference upper cutoff if the likelihood is 75%?
(Multiple Choice)
4.8/5 (40)
Which of the following statements is true of a triangular distribution?
(Multiple Choice)
4.8/5 (41)
Filters
- Essay(0)
- Multiple Choice(0)
- Short Answer(0)
- True False(0)
- Matching(0)