Deck 4: Descriptive Statistical Measures
Full screen (f)
Question
Question
Which of the following measures of location is calculated using the formula  =
=  ,where n is the number of observations?
A)midrange
B)sample mean
C)mode
D)median
= ,where n is the number of observations?A)midrange
B)sample mean
C)mode
D)median
Question
Question
Question
Question
Question
Use the table below to answer the following question(s).
Below is a table showing the costs per order of items bought by a computer hardware store.
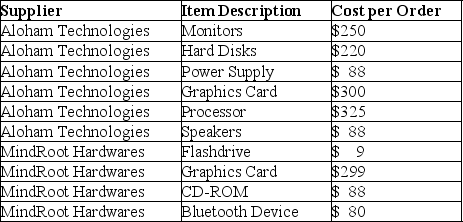
Calculate the mode for the cost per order data.
A)$174.17
B)$325
C)$88
D)$206.5
Below is a table showing the costs per order of items bought by a computer hardware store.
Calculate the mode for the cost per order data.
A)$174.17
B)$325
C)$88
D)$206.5
Question
Use the table below to answer the following question(s).
Below is a table showing the costs per order of items bought by a computer hardware store.
Calculate the mean cost per order.
A)$220.54
B)$174.70
C)$159
D)$88
Below is a table showing the costs per order of items bought by a computer hardware store.
Calculate the mean cost per order.
A)$220.54
B)$174.70
C)$159
D)$88
Question
Use the table below to answer the following question(s).
Below is a table showing the costs per order of items bought by a computer hardware store.
Calculate the median for the cost per order data.
A)$325
B)$154
C)$174.17
D)$88
Below is a table showing the costs per order of items bought by a computer hardware store.
Calculate the median for the cost per order data.
A)$325
B)$154
C)$174.17
D)$88
Question
Question
Question
Question
Question
Question
Question
Question
Which of the following is true from the equation:  = 0 where
  is the mean of the sample?
A)The sum of the deviations above the mean are the same as the sum of the deviations below the mean
B)Half the data lie above the mean of the values
C)The specific set of values does not have any outliers affecting the mean
D)Half the data lie below the mean of the values
= 0 where is the mean of the sample?A)The sum of the deviations above the mean are the same as the sum of the deviations below the mean
B)Half the data lie above the mean of the values
C)The specific set of values does not have any outliers affecting the mean
D)Half the data lie below the mean of the values
Question
Question
Question
Question
Question
Question
Question
Question
Question
Question
Question
Question
Which of the following is the z-score equation for the ith observation?
A)Zt ₌
B)Zᵢ ₌
C)Z₁= (xᵢ ₋ )S
)S
D)Zᵢ =
A)Zt ₌
B)Zᵢ ₌
C)Z₁= (xᵢ ₋
)SD)Zᵢ =
Question
Question
Question
Question
Question
Question
Question
Question
Question
The coefficient of skewness is computed as ________.
A)CS = )³
)³
B)CS =
C)CS =
D)CS =
A)CS =
)³B)CS =
C)CS =
D)CS =
Question
Question
Question
Which of the following is the equation used for computing the sample correlation coefficient?
A)rₓᵧ = cov(X,Y) (sₓsᵧ)
B)rₓᵧ =
C)rₓᵧ =
D)rₓᵧ =
A)rₓᵧ = cov(X,Y) (sₓsᵧ)
B)rₓᵧ =
C)rₓᵧ =
D)rₓᵧ =
Question
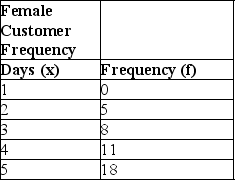
The table below shows the daily frequency of female customers at a particular ice cream shop during discount sale periods.The data is collected for 5 days.Calculate the mean for the data.
Question
Use the spreadsheet below to answer the following question(s).
Below is the table showing rate of shoes sold per day and the highest-priced shoe sold that day for a one-week period.The rate of shoes sold per day (X)and the price of the shoes (Y).
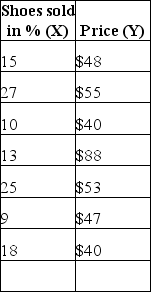
Use Excel to calculate the z-score of X observation 27.
A)-0.24
B)0
C)0)18
D)1)46
Below is the table showing rate of shoes sold per day and the highest-priced shoe sold that day for a one-week period.The rate of shoes sold per day (X)and the price of the shoes (Y).
Use Excel to calculate the z-score of X observation 27.
A)-0.24
B)0
C)0)18
D)1)46
Question
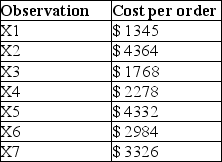
Calculate the standard deviation for cost per order in the following table.
Question
Which of the following cases require the mean of a sample to be calculated using the formula = 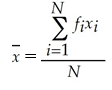 ?
?
A)the sample has no mode value
B)there is direct access to the raw data
C)sample data are grouped in a frequency distribution
D)the coefficient of skewness is 1 or less than -1
?A)the sample has no mode value
B)there is direct access to the raw data
C)sample data are grouped in a frequency distribution
D)the coefficient of skewness is 1 or less than -1
Question
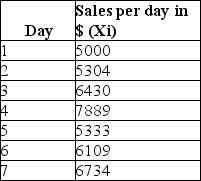
The table below shows the sales per day at a grocery store over a period of a week.Calculate the z-score for sales on Day 4.
Question
Use the spreadsheet below to answer the following question(s).
Below is the table showing rate of shoes sold per day and the highest-priced shoe sold that day for a one-week period.The rate of shoes sold per day (X)and the price of the shoes (Y).
Use Excel to calculate the coefficient of variation of X.
A)0)42
B)0)31
C)7)04
D)16.47
Below is the table showing rate of shoes sold per day and the highest-priced shoe sold that day for a one-week period.The rate of shoes sold per day (X)and the price of the shoes (Y).
Use Excel to calculate the coefficient of variation of X.
A)0)42
B)0)31
C)7)04
D)16.47
Question
Question
Which of the following formula is used to compute covariance between two variables X and Y?
A)cov (X,Y)=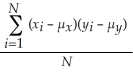
B)cov (X,Y)=
C)cov (X,Y)=
D)cov (X,Y)=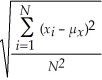
A)cov (X,Y)=
B)cov (X,Y)=
C)cov (X,Y)=
D)cov (X,Y)=
Question
Question
Question
Use the spreadsheet below to answer the following question(s).
Below is the table showing rate of shoes sold per day and the highest-priced shoe sold that day for a one-week period.The rate of shoes sold per day (X)and the price of the shoes (Y).
Use Excel to calculate the correlation between variables X and Y.
A)16.47
B)0)02
C)16.71
D)7)04
Below is the table showing rate of shoes sold per day and the highest-priced shoe sold that day for a one-week period.The rate of shoes sold per day (X)and the price of the shoes (Y).
Use Excel to calculate the correlation between variables X and Y.
A)16.47
B)0)02
C)16.71
D)7)04
Question
Use the spreadsheet below to answer the following question(s).
Below is the table showing rate of shoes sold per day and the highest-priced shoe sold that day for a one-week period.The rate of shoes sold per day (X)and the price of the shoes (Y).
Use Excel to calculate the mean for X.
A)16.71
B)7)04
C)2)67
D)0)02
Below is the table showing rate of shoes sold per day and the highest-priced shoe sold that day for a one-week period.The rate of shoes sold per day (X)and the price of the shoes (Y).
Use Excel to calculate the mean for X.
A)16.71
B)7)04
C)2)67
D)0)02
Question
Question
Question
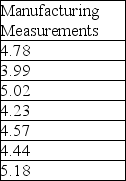
Below is the data collected from a manufacturing process for a part whose dimensions are specified as 4.00 ± 0.1 centimetres.Calculate the process capability index within three standard deviations of the mean.
Question
Use the spreadsheet below to answer the following question(s).
Below is the table showing rate of shoes sold per day and the highest-priced shoe sold that day for a one-week period.The rate of shoes sold per day (X)and the price of the shoes (Y).
Use Excel to calculate the covariance between variables X and Y.
A)2)66
B)0)02
C)16.71
D)7)04
Below is the table showing rate of shoes sold per day and the highest-priced shoe sold that day for a one-week period.The rate of shoes sold per day (X)and the price of the shoes (Y).
Use Excel to calculate the covariance between variables X and Y.
A)2)66
B)0)02
C)16.71
D)7)04
Question
Question
Use the spreadsheet below to answer the following question(s).
Below is the table showing rate of shoes sold per day and the highest-priced shoe sold that day for a one-week period.The rate of shoes sold per day (X)and the price of the shoes (Y).
Use Excel to calculate the variance of X.
A)271.33
B)16.47
C)49.57
D)7)04
Below is the table showing rate of shoes sold per day and the highest-priced shoe sold that day for a one-week period.The rate of shoes sold per day (X)and the price of the shoes (Y).
Use Excel to calculate the variance of X.
A)271.33
B)16.47
C)49.57
D)7)04
Question
Use the spreadsheet below to answer the following question(s).
Below is the table showing rate of shoes sold per day and the highest-priced shoe sold that day for a one-week period.The rate of shoes sold per day (X)and the price of the shoes (Y).
Use Excel to calculate the standard deviation for Y.
A)49.57
B)16.47
C)7)04
D)2)6
Below is the table showing rate of shoes sold per day and the highest-priced shoe sold that day for a one-week period.The rate of shoes sold per day (X)and the price of the shoes (Y).
Use Excel to calculate the standard deviation for Y.
A)49.57
B)16.47
C)7)04
D)2)6
Question
Question
Question
Question
Question
Question
Question
Question
Question
Question
Question
Question
Question
Question
Question
Question
Question
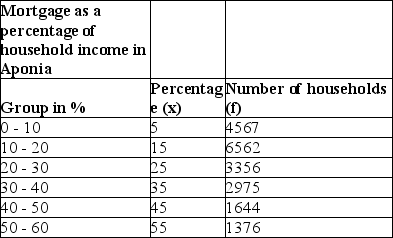
The following table lists the amounts paid in mortgages as a percentage of the household income in the town Aponia.Calculate the variance and standard deviation of the data, if mean is given as 22.4%.The percentage (x)values are estimated as midpoints of each percentage range.
Question
Question

Unlock Deck
Sign up to unlock the cards in this deck!
Unlock Deck
Unlock Deck
1/79
Play
Full screen (f)
Deck 4: Descriptive Statistical Measures
1
In statistical notation, the elements of a data set are typically labeled as ________.
A)summation operators
B)letters in capitals
C)Greek letters
D)subscripted variables
A)summation operators
B)letters in capitals
C)Greek letters
D)subscripted variables
D
2
Which of the following measures of location is calculated using the formula = ,where n is the number of observations?
A)midrange
B)sample mean
C)mode
D)median
= ,where n is the number of observations?A)midrange
B)sample mean
C)mode
D)median
B
3
The purpose of sampling is to ________.
A)enumerate all the values in the population
B)measure all items of interest for a particular interest or investigation
C)obtain sufficient information to draw a valid inference about a population
D)calculate all variables and observations within a population
A)enumerate all the values in the population
B)measure all items of interest for a particular interest or investigation
C)obtain sufficient information to draw a valid inference about a population
D)calculate all variables and observations within a population
C
4
Which of the following is true for a median?
A)A median is only meaningful for interval or ordinal data and not for ratio data.
B)Medians can be calculated no matter how the data is arranged.
C)Medians are affected by outliers.
D)For an even number of observations, the median is the mean of the two middle numbers.
A)A median is only meaningful for interval or ordinal data and not for ratio data.
B)Medians can be calculated no matter how the data is arranged.
C)Medians are affected by outliers.
D)For an even number of observations, the median is the mean of the two middle numbers.
Unlock Deck
Unlock for access to all 79 flashcards in this deck.
Unlock Deck
k this deck
5
Which of the following is an example of a subset?
A)The number of individuals who have a Ford car
B)The number of IT employees out of all employees working in an office of Google
C)The number of members in the Democratic Party
D)The population of Canada
A)The number of individuals who have a Ford car
B)The number of IT employees out of all employees working in an office of Google
C)The number of members in the Democratic Party
D)The population of Canada
Unlock Deck
Unlock for access to all 79 flashcards in this deck.
Unlock Deck
k this deck
6
Which of the following is an example of a measure of dispersion?
A)median
B)mode
C)variance
D)midrange
A)median
B)mode
C)variance
D)midrange
Unlock Deck
Unlock for access to all 79 flashcards in this deck.
Unlock Deck
k this deck
7
Use the table below to answer the following question(s).
Below is a table showing the costs per order of items bought by a computer hardware store.
Calculate the mode for the cost per order data.
A)$174.17
B)$325
C)$88
D)$206.5
Below is a table showing the costs per order of items bought by a computer hardware store.
Calculate the mode for the cost per order data.
A)$174.17
B)$325
C)$88
D)$206.5
Unlock Deck
Unlock for access to all 79 flashcards in this deck.
Unlock Deck
k this deck
8
Use the table below to answer the following question(s).
Below is a table showing the costs per order of items bought by a computer hardware store.
Calculate the mean cost per order.
A)$220.54
B)$174.70
C)$159
D)$88
Below is a table showing the costs per order of items bought by a computer hardware store.
Calculate the mean cost per order.
A)$220.54
B)$174.70
C)$159
D)$88
Unlock Deck
Unlock for access to all 79 flashcards in this deck.
Unlock Deck
k this deck
9
Use the table below to answer the following question(s).
Below is a table showing the costs per order of items bought by a computer hardware store.
Calculate the median for the cost per order data.
A)$325
B)$154
C)$174.17
D)$88
Below is a table showing the costs per order of items bought by a computer hardware store.
Calculate the median for the cost per order data.
A)$325
B)$154
C)$174.17
D)$88
Unlock Deck
Unlock for access to all 79 flashcards in this deck.
Unlock Deck
k this deck
10
Which of the following is a difference between a mean and a median?
A)A mean divides the data half above it and half below it; a median does not.
B)A median is not affected by outliers; a mean is affected by outliers.
C)A mean is an observation that occurs most frequently; a median is the average of all observations.
D)A median is not meaningful for ratio data; a mean is meaningful to ratio data.
Unlock Deck
Unlock for access to all 79 flashcards in this deck.
Unlock Deck
k this deck
11
Which of the following describes dispersion in statistics?
A)the degree of variation in the data
B)the central value in the data
C)the frequency of values in the data
D)the measure of outliers in the data
A)the degree of variation in the data
B)the central value in the data
C)the frequency of values in the data
D)the measure of outliers in the data
Unlock Deck
Unlock for access to all 79 flashcards in this deck.
Unlock Deck
k this deck
12
Which of the following types of conditions is most likely to render a midrange value useless?
A)having repetitious values in the data set
B)having the data arranged from least to greatest in value
C)having a small sample size
D)having extreme values in a data
A)having repetitious values in the data set
B)having the data arranged from least to greatest in value
C)having a small sample size
D)having extreme values in a data
Unlock Deck
Unlock for access to all 79 flashcards in this deck.
Unlock Deck
k this deck
13
The ________ is the observation that occurs most frequently.
A)mode
B)mean
C)outlier
D)median
A)mode
B)mean
C)outlier
D)median
Unlock Deck
Unlock for access to all 79 flashcards in this deck.
Unlock Deck
k this deck
14
The ________ is the average of the greatest and least values in the data set.
A)mean
B)median
C)midrange
D)mode
A)mean
B)median
C)midrange
D)mode
Unlock Deck
Unlock for access to all 79 flashcards in this deck.
Unlock Deck
k this deck
15
Which of the following is a similarity between a midrange and a mean?
A)Both measures are calculated using all the values in a data set.
B)Both measures are affected by outliers.
C)Both measures divide the data into two equal halves.
D)Both measures can only be used for small sample sizes.
A)Both measures are calculated using all the values in a data set.
B)Both measures are affected by outliers.
C)Both measures divide the data into two equal halves.
D)Both measures can only be used for small sample sizes.
Unlock Deck
Unlock for access to all 79 flashcards in this deck.
Unlock Deck
k this deck
16
According to statistical notations, what does Σ stand for?
A)to act as a summation operator
B)to represent sample statistics
C)to represent population measures
D)to represent the number of items in a population
A)to act as a summation operator
B)to represent sample statistics
C)to represent population measures
D)to represent the number of items in a population
Unlock Deck
Unlock for access to all 79 flashcards in this deck.
Unlock Deck
k this deck
17
Which of the following is true from the equation: = 0 where is the mean of the sample?
A)The sum of the deviations above the mean are the same as the sum of the deviations below the mean
B)Half the data lie above the mean of the values
C)The specific set of values does not have any outliers affecting the mean
D)Half the data lie below the mean of the values
= 0 where is the mean of the sample?A)The sum of the deviations above the mean are the same as the sum of the deviations below the mean
B)Half the data lie above the mean of the values
C)The specific set of values does not have any outliers affecting the mean
D)Half the data lie below the mean of the values
Unlock Deck
Unlock for access to all 79 flashcards in this deck.
Unlock Deck
k this deck
18
The measure of location that specifies the middle value when the data are arranged from least to greatest is the ________.
A)outlier
B)mean
C)median
D)mode
A)outlier
B)mean
C)median
D)mode
Unlock Deck
Unlock for access to all 79 flashcards in this deck.
Unlock Deck
k this deck
19
One of the measures of location is calculated as 88.Which of the following measures of location corresponds to this value?
A)mean
B)mode
C)median
D)midrange
A)mean
B)mode
C)median
D)midrange
Unlock Deck
Unlock for access to all 79 flashcards in this deck.
Unlock Deck
k this deck
20
Which of the following is true for a mode?
A)Modes are the mid values of data arranged from least to greatest.
B)Modes are affected by outliers.
C)Modes cannot be used in data having repetitious values.
D)The highest bar in a histogram is its mode.
A)Modes are the mid values of data arranged from least to greatest.
B)Modes are affected by outliers.
C)Modes cannot be used in data having repetitious values.
D)The highest bar in a histogram is its mode.
Unlock Deck
Unlock for access to all 79 flashcards in this deck.
Unlock Deck
k this deck
21
The difference between the first and third quartiles is referred to as the ________.
A)standard deviation
B)variance
C)interquartile range
D)midrange
A)standard deviation
B)variance
C)interquartile range
D)midrange
Unlock Deck
Unlock for access to all 79 flashcards in this deck.
Unlock Deck
k this deck
22
________ states that for any set of data, the proportion of values that lie within k standard deviations (k > 1)of the mean is at least 1 - 1/k².
A)Prime number theorem
B)Bertrand's postulate
C)Oppermann's conjecture
D)Chebyshev's theorem
A)Prime number theorem
B)Bertrand's postulate
C)Oppermann's conjecture
D)Chebyshev's theorem
Unlock Deck
Unlock for access to all 79 flashcards in this deck.
Unlock Deck
k this deck
23
Which of the following is the equation for calculating the coefficient of variation (CV)?
A)CV = standard deviation/mean
B)CV = standard deviation - z-score/mean (total variation)
C)CV = value of observation's distance from mean/standard deviation
D)CV = mean/(standard deviation)²
A)CV = standard deviation/mean
B)CV = standard deviation - z-score/mean (total variation)
C)CV = value of observation's distance from mean/standard deviation
D)CV = mean/(standard deviation)²
Unlock Deck
Unlock for access to all 79 flashcards in this deck.
Unlock Deck
k this deck
24
Which of the following describes a positively skewed histogram?
A)a histogram that tails off toward the right
B)a histogram that has no fluctuation in mass
C)a histogram where more mass tails off toward the left
D)a histogram where mass is only concentrated in the middle
A)a histogram that tails off toward the right
B)a histogram that has no fluctuation in mass
C)a histogram where more mass tails off toward the left
D)a histogram where mass is only concentrated in the middle
Unlock Deck
Unlock for access to all 79 flashcards in this deck.
Unlock Deck
k this deck
25
In the equation Cp = upper specification - lower specification/total variation, what does Cp denote?
A)capacity variation index
B)capability pattern
C)process capability index
D)capability push
A)capacity variation index
B)capability pattern
C)process capability index
D)capability push
Unlock Deck
Unlock for access to all 79 flashcards in this deck.
Unlock Deck
k this deck
26
In the z-score formula, which of the following is true if the value in the numerator is a negative value?
A)that the xᵢ value lies to the left of the mean
B)that the mean is of lesser value than the xᵢ value
C)that the mean is of negative value
D)that the numerator value cannot be divided by the standard deviation
A)that the xᵢ value lies to the left of the mean
B)that the mean is of lesser value than the xᵢ value
C)that the mean is of negative value
D)that the numerator value cannot be divided by the standard deviation
Unlock Deck
Unlock for access to all 79 flashcards in this deck.
Unlock Deck
k this deck
27
Using Chebyshev's theorem for standard deviation, calculate the percentage of data that lie within five standard deviations of the mean.
A)89%
B)75%
C)96%
D)50%
A)89%
B)75%
C)96%
D)50%
Unlock Deck
Unlock for access to all 79 flashcards in this deck.
Unlock Deck
k this deck
28
How is the return to risk described in financial statistics?
A)as the relative measure of the distance an observation is from the mean
B)as the reciprocal of coefficient of variation
C)as the square root of variance
D)as the ratio of excess returns to its standard deviation
A)as the relative measure of the distance an observation is from the mean
B)as the reciprocal of coefficient of variation
C)as the square root of variance
D)as the ratio of excess returns to its standard deviation
Unlock Deck
Unlock for access to all 79 flashcards in this deck.
Unlock Deck
k this deck
29
Which of the following is the z-score equation for the ith observation?
A)Zt ₌
B)Zᵢ ₌
C)Z₁= (xᵢ ₋ )S
D)Zᵢ =
A)Zt ₌
B)Zᵢ ₌
C)Z₁= (xᵢ ₋
)SD)Zᵢ =
Unlock Deck
Unlock for access to all 79 flashcards in this deck.
Unlock Deck
k this deck
30
The ________ measures the degree of asymmetry of observations around the mean.
A)coefficient of variation
B)return to risk factor
C)coefficient of skewness
D)coefficient of kurtosis
A)coefficient of variation
B)return to risk factor
C)coefficient of skewness
D)coefficient of kurtosis
Unlock Deck
Unlock for access to all 79 flashcards in this deck.
Unlock Deck
k this deck
31
Which of the following describes standard deviation?
A)It is the average of the greatest and least values in the data set.
B)It is the square root of the variance.
C)It is the difference between the first and third quartiles of a data set.
D)It is the average of the squared deviations of the observations from the mean.
A)It is the average of the greatest and least values in the data set.
B)It is the square root of the variance.
C)It is the difference between the first and third quartiles of a data set.
D)It is the average of the squared deviations of the observations from the mean.
Unlock Deck
Unlock for access to all 79 flashcards in this deck.
Unlock Deck
k this deck
32
Calculate the coefficient of variation from the following data:
Z-score = 1.32; standard deviation = 0.173; mean = 4.7; total variation = 0.6
A)27.16
B)156.66
C)0)04
D)-0.5
Z-score = 1.32; standard deviation = 0.173; mean = 4.7; total variation = 0.6
A)27.16
B)156.66
C)0)04
D)-0.5
Unlock Deck
Unlock for access to all 79 flashcards in this deck.
Unlock Deck
k this deck
33
Which of the following is true of variance?
A)The formula to calculate variance of a population is not the same as the formula to calculate variance of a sample.
B)Its value is inversely proportional to the degree to which the data is spread from the mean.
C)It only requires the middle 50% of data to be calculated.
D)It is the square root of standard deviation.
Unlock Deck
Unlock for access to all 79 flashcards in this deck.
Unlock Deck
k this deck
34
Which of the following values of the coefficients of variation of stocks represents the least risky stock?
A)1)0
B)0)005
C)0)5
D)0)045
A)1)0
B)0)005
C)0)5
D)0)045
Unlock Deck
Unlock for access to all 79 flashcards in this deck.
Unlock Deck
k this deck
35
In finance, the ________ is the ratio of a fund's excess returns (annualized total returns minus Treasury bill returns)to its standard deviation.
A)field ratio
B)Sortino ratio
C)Calmar ratio
D)Sharpe ratio
A)field ratio
B)Sortino ratio
C)Calmar ratio
D)Sharpe ratio
Unlock Deck
Unlock for access to all 79 flashcards in this deck.
Unlock Deck
k this deck
36
Which of the following is true of the coefficient of skewness (CS)?
A)If the CS is positive, the distribution of values tails off to the left.
B)If the CS value is between 0.5 and 1, the skewness is considered to be moderate.
C)If the CS is closer to zero, the degree of skewness is considered to be high.
D)If the CS value is between -0.5 and -1, the skewness is considered negligible.
Unlock Deck
Unlock for access to all 79 flashcards in this deck.
Unlock Deck
k this deck
37
A z-score of 1.0 means that ________.
A)the observation is -1.0 standard deviation to the right of the mean
B)the observation is -1.0 standard deviation to the left of the mean
C)the observation has no deviation from the mean
D)the observation is 1.0 standard deviation to the right of the mean
A)the observation is -1.0 standard deviation to the right of the mean
B)the observation is -1.0 standard deviation to the left of the mean
C)the observation has no deviation from the mean
D)the observation is 1.0 standard deviation to the right of the mean
Unlock Deck
Unlock for access to all 79 flashcards in this deck.
Unlock Deck
k this deck
38
The coefficient of skewness is computed as ________.
A)CS = )³
B)CS =
C)CS =
D)CS =
A)CS =
)³B)CS =
C)CS =
D)CS =
Unlock Deck
Unlock for access to all 79 flashcards in this deck.
Unlock Deck
k this deck
39
Which of the following is true of midspread?
A)It is an example of a measure of location.
B)It is calculated by finding the difference between the highest and lowest values in the data set.
C)It is affected by extreme values.
D)It is calculated using only the middle 50% of the data.
A)It is an example of a measure of location.
B)It is calculated by finding the difference between the highest and lowest values in the data set.
C)It is affected by extreme values.
D)It is calculated using only the middle 50% of the data.
Unlock Deck
Unlock for access to all 79 flashcards in this deck.
Unlock Deck
k this deck
40
Which of the following describes variance?
A)It is the difference between the maximum value and the minimum value in the data set.
B)It is the difference between the first and third quartiles of a data set.
C)It is the average of the squared deviations of the observations from the mean.
D)It is the average of the greatest and least values in the data set.
Unlock Deck
Unlock for access to all 79 flashcards in this deck.
Unlock Deck
k this deck
41
Which of the following is the equation used for computing the sample correlation coefficient?
A)rₓᵧ = cov(X,Y) (sₓsᵧ)
B)rₓᵧ =
C)rₓᵧ =
D)rₓᵧ =
A)rₓᵧ = cov(X,Y) (sₓsᵧ)
B)rₓᵧ =
C)rₓᵧ =
D)rₓᵧ =
Unlock Deck
Unlock for access to all 79 flashcards in this deck.
Unlock Deck
k this deck
42
The table below shows the daily frequency of female customers at a particular ice cream shop during discount sale periods.The data is collected for 5 days.Calculate the mean for the data.
Unlock Deck
Unlock for access to all 79 flashcards in this deck.
Unlock Deck
k this deck
43
Use the spreadsheet below to answer the following question(s).
Below is the table showing rate of shoes sold per day and the highest-priced shoe sold that day for a one-week period.The rate of shoes sold per day (X)and the price of the shoes (Y).
Use Excel to calculate the z-score of X observation 27.
A)-0.24
B)0
C)0)18
D)1)46
Below is the table showing rate of shoes sold per day and the highest-priced shoe sold that day for a one-week period.The rate of shoes sold per day (X)and the price of the shoes (Y).
Use Excel to calculate the z-score of X observation 27.
A)-0.24
B)0
C)0)18
D)1)46
Unlock Deck
Unlock for access to all 79 flashcards in this deck.
Unlock Deck
k this deck
44
Calculate the standard deviation for cost per order in the following table.
Unlock Deck
Unlock for access to all 79 flashcards in this deck.
Unlock Deck
k this deck
45
Which of the following cases require the mean of a sample to be calculated using the formula = ?
A)the sample has no mode value
B)there is direct access to the raw data
C)sample data are grouped in a frequency distribution
D)the coefficient of skewness is 1 or less than -1
?A)the sample has no mode value
B)there is direct access to the raw data
C)sample data are grouped in a frequency distribution
D)the coefficient of skewness is 1 or less than -1
Unlock Deck
Unlock for access to all 79 flashcards in this deck.
Unlock Deck
k this deck
46
The table below shows the sales per day at a grocery store over a period of a week.Calculate the z-score for sales on Day 4.
Unlock Deck
Unlock for access to all 79 flashcards in this deck.
Unlock Deck
k this deck
47
Use the spreadsheet below to answer the following question(s).
Below is the table showing rate of shoes sold per day and the highest-priced shoe sold that day for a one-week period.The rate of shoes sold per day (X)and the price of the shoes (Y).
Use Excel to calculate the coefficient of variation of X.
A)0)42
B)0)31
C)7)04
D)16.47
Below is the table showing rate of shoes sold per day and the highest-priced shoe sold that day for a one-week period.The rate of shoes sold per day (X)and the price of the shoes (Y).
Use Excel to calculate the coefficient of variation of X.
A)0)42
B)0)31
C)7)04
D)16.47
Unlock Deck
Unlock for access to all 79 flashcards in this deck.
Unlock Deck
k this deck
48
________ is a measure of the linear association between two variables, X and Y.
A)Kurtosis
B)Proportion
C)Skewness
D)Covariance
A)Kurtosis
B)Proportion
C)Skewness
D)Covariance
Unlock Deck
Unlock for access to all 79 flashcards in this deck.
Unlock Deck
k this deck
49
Which of the following formula is used to compute covariance between two variables X and Y?
A)cov (X,Y)=
B)cov (X,Y)=
C)cov (X,Y)=
D)cov (X,Y)=
A)cov (X,Y)=
B)cov (X,Y)=
C)cov (X,Y)=
D)cov (X,Y)=
Unlock Deck
Unlock for access to all 79 flashcards in this deck.
Unlock Deck
k this deck
50
In statistics, ________ refers to the peakedness or flatness of a histogram.
A)Sharpe ratio
B)entropy rate
C)Markov chain
D)kurtosis
A)Sharpe ratio
B)entropy rate
C)Markov chain
D)kurtosis
Unlock Deck
Unlock for access to all 79 flashcards in this deck.
Unlock Deck
k this deck
51
________ is a measure of the linear relationship between two variables, X and Y, which does not depend on the units of measurement.
A)Kurtosis
B)Proportion
C)Skewness
D)Correlation
A)Kurtosis
B)Proportion
C)Skewness
D)Correlation
Unlock Deck
Unlock for access to all 79 flashcards in this deck.
Unlock Deck
k this deck
52
Use the spreadsheet below to answer the following question(s).
Below is the table showing rate of shoes sold per day and the highest-priced shoe sold that day for a one-week period.The rate of shoes sold per day (X)and the price of the shoes (Y).
Use Excel to calculate the correlation between variables X and Y.
A)16.47
B)0)02
C)16.71
D)7)04
Below is the table showing rate of shoes sold per day and the highest-priced shoe sold that day for a one-week period.The rate of shoes sold per day (X)and the price of the shoes (Y).
Use Excel to calculate the correlation between variables X and Y.
A)16.47
B)0)02
C)16.71
D)7)04
Unlock Deck
Unlock for access to all 79 flashcards in this deck.
Unlock Deck
k this deck
53
Use the spreadsheet below to answer the following question(s).
Below is the table showing rate of shoes sold per day and the highest-priced shoe sold that day for a one-week period.The rate of shoes sold per day (X)and the price of the shoes (Y).
Use Excel to calculate the mean for X.
A)16.71
B)7)04
C)2)67
D)0)02
Below is the table showing rate of shoes sold per day and the highest-priced shoe sold that day for a one-week period.The rate of shoes sold per day (X)and the price of the shoes (Y).
Use Excel to calculate the mean for X.
A)16.71
B)7)04
C)2)67
D)0)02
Unlock Deck
Unlock for access to all 79 flashcards in this deck.
Unlock Deck
k this deck
54
The ________ is a formal statistical measure for categorical data, such as defects or errors in quality control applications or consumer preferences in market research.
A)variance
B)proportion
C)mean
D)skewness
A)variance
B)proportion
C)mean
D)skewness
Unlock Deck
Unlock for access to all 79 flashcards in this deck.
Unlock Deck
k this deck
55
Which of the following is true of covariance, between two variables, when one of the deviations from the mean is positive and the other is negative?
A)the degree of linear association is high between the two variables
B)there is no covariance between the two variables
C)the covariance will be negative
D)the covariance will be positive
A)the degree of linear association is high between the two variables
B)there is no covariance between the two variables
C)the covariance will be negative
D)the covariance will be positive
Unlock Deck
Unlock for access to all 79 flashcards in this deck.
Unlock Deck
k this deck
56
Below is the data collected from a manufacturing process for a part whose dimensions are specified as 4.00 ± 0.1 centimetres.Calculate the process capability index within three standard deviations of the mean.
Unlock Deck
Unlock for access to all 79 flashcards in this deck.
Unlock Deck
k this deck
57
Use the spreadsheet below to answer the following question(s).
Below is the table showing rate of shoes sold per day and the highest-priced shoe sold that day for a one-week period.The rate of shoes sold per day (X)and the price of the shoes (Y).
Use Excel to calculate the covariance between variables X and Y.
A)2)66
B)0)02
C)16.71
D)7)04
Below is the table showing rate of shoes sold per day and the highest-priced shoe sold that day for a one-week period.The rate of shoes sold per day (X)and the price of the shoes (Y).
Use Excel to calculate the covariance between variables X and Y.
A)2)66
B)0)02
C)16.71
D)7)04
Unlock Deck
Unlock for access to all 79 flashcards in this deck.
Unlock Deck
k this deck
58
For two variables, a positive correlation coefficient indicates ________.
A)a linear relationship exists for which one variable increases as the other also increases
B)a linear relationship exists for one variable that increases while the other decreases
C)that the two variables have no linear relationship with each other
D)a nonlinear relationship with no linear correlation between the two variables
Unlock Deck
Unlock for access to all 79 flashcards in this deck.
Unlock Deck
k this deck
59
Use the spreadsheet below to answer the following question(s).
Below is the table showing rate of shoes sold per day and the highest-priced shoe sold that day for a one-week period.The rate of shoes sold per day (X)and the price of the shoes (Y).
Use Excel to calculate the variance of X.
A)271.33
B)16.47
C)49.57
D)7)04
Below is the table showing rate of shoes sold per day and the highest-priced shoe sold that day for a one-week period.The rate of shoes sold per day (X)and the price of the shoes (Y).
Use Excel to calculate the variance of X.
A)271.33
B)16.47
C)49.57
D)7)04
Unlock Deck
Unlock for access to all 79 flashcards in this deck.
Unlock Deck
k this deck
60
Use the spreadsheet below to answer the following question(s).
Below is the table showing rate of shoes sold per day and the highest-priced shoe sold that day for a one-week period.The rate of shoes sold per day (X)and the price of the shoes (Y).
Use Excel to calculate the standard deviation for Y.
A)49.57
B)16.47
C)7)04
D)2)6
Below is the table showing rate of shoes sold per day and the highest-priced shoe sold that day for a one-week period.The rate of shoes sold per day (X)and the price of the shoes (Y).
Use Excel to calculate the standard deviation for Y.
A)49.57
B)16.47
C)7)04
D)2)6
Unlock Deck
Unlock for access to all 79 flashcards in this deck.
Unlock Deck
k this deck
61
One of the properties of the mean is that the sum of the deviations of each observation from the mean is zero.
Unlock Deck
Unlock for access to all 79 flashcards in this deck.
Unlock Deck
k this deck
62
The value of a coefficient of skewness falling between 0.5 and -0.5 indicates relative symmetry.
Unlock Deck
Unlock for access to all 79 flashcards in this deck.
Unlock Deck
k this deck
63
Two variables can only have a statistical relationship if there is a cause-and-effect factor between them.
Unlock Deck
Unlock for access to all 79 flashcards in this deck.
Unlock Deck
k this deck
64
The larger the variance, the more the data are spread out from the mean.
Unlock Deck
Unlock for access to all 79 flashcards in this deck.
Unlock Deck
k this deck
65
For an odd number of observations, the median is the mean of the two middle numbers.
Unlock Deck
Unlock for access to all 79 flashcards in this deck.
Unlock Deck
k this deck
66
If the distribution of observations are such that mode < median < mean, the histogram would be said to be negatively skewed.
Unlock Deck
Unlock for access to all 79 flashcards in this deck.
Unlock Deck
k this deck
67
What are the different interpretations for correlation coefficient values?
Unlock Deck
Unlock for access to all 79 flashcards in this deck.
Unlock Deck
k this deck
68
A correlation of 0 indicates that the two variables have no linear relationship with each
other.
other.
Unlock Deck
Unlock for access to all 79 flashcards in this deck.
Unlock Deck
k this deck
69
State the three empirical rules in standard deviation.
Unlock Deck
Unlock for access to all 79 flashcards in this deck.
Unlock Deck
k this deck
70
According to the empirical rules of standard deviation in statistics, approximately 68% of the observations will fall within three standard deviations of the mean.
Unlock Deck
Unlock for access to all 79 flashcards in this deck.
Unlock Deck
k this deck
71
What is statistical thinking? How is it important to making business decisions?
Unlock Deck
Unlock for access to all 79 flashcards in this deck.
Unlock Deck
k this deck
72
Two different sets of data can never have the same z-scores.
Unlock Deck
Unlock for access to all 79 flashcards in this deck.
Unlock Deck
k this deck
73
Give an account of Excel's Descriptive Statistics Tool.
Unlock Deck
Unlock for access to all 79 flashcards in this deck.
Unlock Deck
k this deck
74
Skewness describes the lack of symmetry of data.
Unlock Deck
Unlock for access to all 79 flashcards in this deck.
Unlock Deck
k this deck
75
In stock trading, the higher the coefficient of variation for the stock, the smaller the relative risk is for the return provided.
Unlock Deck
Unlock for access to all 79 flashcards in this deck.
Unlock Deck
k this deck
76
According to the interquartile range, extreme outliers are more than 3*IQR away from the left of Q1 or to the right of Q3.
Unlock Deck
Unlock for access to all 79 flashcards in this deck.
Unlock Deck
k this deck
77
The following table lists the amounts paid in mortgages as a percentage of the household income in the town Aponia.Calculate the variance and standard deviation of the data, if mean is given as 22.4%.The percentage (x)values are estimated as midpoints of each percentage range.
Unlock Deck
Unlock for access to all 79 flashcards in this deck.
Unlock Deck
k this deck
78
A sample is a subset of a population.
Unlock Deck
Unlock for access to all 79 flashcards in this deck.
Unlock Deck
k this deck
79
How can outliers be identified in a data set?
Unlock Deck
Unlock for access to all 79 flashcards in this deck.
Unlock Deck
k this deck
Unlock Deck
Unlock for access to all 79 flashcards in this deck.


