Exam 4: Descriptive Statistical Measures
Exam 1: Introduction to Business Analytics50 Questions
Exam 2: Analytics on Spreadsheets52 Questions
Exam 3: Visualizing and Exploring Data50 Questions
Exam 4: Descriptive Statistical Measures79 Questions
Exam 5: Probability Distributions and Data Modeling50 Questions
Exam 6: Sampling and Estimation59 Questions
Exam 7: Statistical Inference50 Questions
Exam 8: Predictive Modeling and Analysis64 Questions
Exam 9: Regression Analysis50 Questions
Exam 10: Forecasting Techniques55 Questions
Exam 11: Simulation and Risk Analysis50 Questions
Exam 12: Introduction to Data Mining53 Questions
Exam 13: Linear Optimization50 Questions
Exam 14: Applications of Linear Optimization62 Questions
Exam 15: Integer Optimization50 Questions
Exam 16: Nonlinear and Non-Smooth Optimization66 Questions
Exam 17: Optimization Models with Uncertainty50 Questions
Exam 18: Decision Analysis50 Questions
Select questions type
The table below shows the daily frequency of female customers at a particular ice cream shop during discount sale periods.The data is collected for 5 days.Calculate the mean for the data.
Female Customer Frequency Days (x) Frequency (f) 1 0 2 5 3 8 4 11 5 18
Free
(Essay)
4.8/5  (24)
(24)
Correct Answer: Verified
For grouped data, mean, , where is the number of observations, and is individual frequencies multiplied by the corresponding number of days.
First we multiply individual frequencies by their corresponding number of day. Then we add the multiplied values to ohtain .
Here,
is calculated to be 42 .
Therefore the mean, . .
Two variables can only have a statistical relationship if there is a cause-and-effect factor between them.
Free
(True/False)
4.9/5 (40)
Correct Answer:Verified
False
Use the table below to answer the following question(s).
Below is a table showing the costs per order of items bought by a computer hardware store.
Supplier Item Description Cost per Order Aloham Technologies Monitors \ 250 Aloham Technologies Hard Disks \ 220 Aloham Technologies Power Supply \ 88 Aloham Technologies Graphics Card \ 300 Aloham Technologies Processor \ 325 Aloham Technologies Speakers \ 88 MindRoot Hardwares Flashdrive \ 9 MindRoot Hardwares Graphics Card \ 299 MindRoot Hardwares CD-ROM \ 88 MindRoot Hardwares Bluetooth Device \ 80
-Calculate the mode for the cost per order data.
Free
(Multiple Choice)
4.8/5 (37)
Correct Answer:Verified
C
In statistics, ________ refers to the peakedness or flatness of a histogram.
(Multiple Choice)
4.9/5 (27)
One of the properties of the mean is that the sum of the deviations of each observation from the mean is zero.
(True/False)
4.9/5 (49)
Use the spreadsheet below to answer the following question(s).
Below is the table showing rate of shoes sold per day and the highest-priced shoe sold that day for a one-week period.The rate of shoes sold per day (X)and the price of the shoes (Y).
Shoes sold in \% () Price (Y) 15 \ 48 27 \ 55 10 \ 40 13 \ 88 25 \ 53 9 \ 47 18 \ 40
-Use Excel to calculate the standard deviation for Y.
(Multiple Choice)
4.8/5 (39)
________ is a measure of the linear association between two variables, X and Y.
(Multiple Choice)
4.7/5 (33)
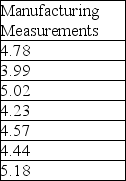
Below is the data collected from a manufacturing process for a part whose dimensions are specified as 4.00 ± 0.1 centimetres.Calculate the process capability index within three standard deviations of the mean.
(Essay)
4.9/5 (36)
Which of the following values of the coefficients of variation of stocks represents the least risky stock?
(Multiple Choice)
4.9/5 (39)
The ________ is the observation that occurs most frequently.
(Multiple Choice)
4.8/5 (30)
Calculate the standard deviation for cost per order in the following table.
Observation Costper order 1 \ 1345 2 \ 4364 3 \ 1768 4 \ 2278 5 \ 4332 6 \ 2984 7 \ 3326
(Essay)
4.9/5 (32)
For an odd number of observations, the median is the mean of the two middle numbers.
(True/False)
4.9/5 (35)
Which of the following is a difference between a mean and a median?
(Multiple Choice)
4.9/5 (32)
For two variables, a positive correlation coefficient indicates ________.
(Multiple Choice)
5.0/5 (34)
Which of the following is the equation used for computing the sample correlation coefficient?
(Multiple Choice)
4.8/5 (41)
In the equation Cp = upper specification - lower specification/total variation, what does Cp denote?
(Multiple Choice)
4.7/5 (36)
In stock trading, the higher the coefficient of variation for the stock, the smaller the relative risk is for the return provided.
(True/False)
4.8/5 (31)
Filters
- Essay(0)
- Multiple Choice(0)
- Short Answer(0)
- True False(0)
- Matching(0)