Deck 4: Physiological Development and Epigenetics
Full screen (f)
Question
Question
Question
Question
Question
Refer to the figure shown.
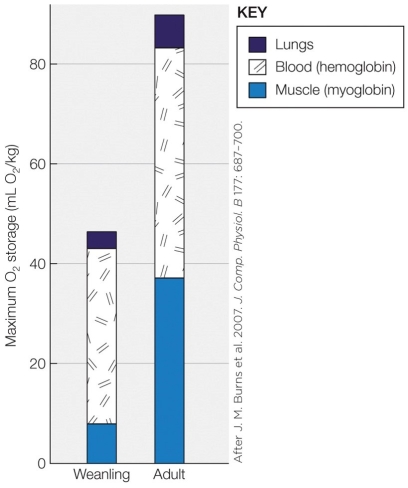 Based on the figure, what character is increasing overall as hooded seals develop into adults?
A) Mass
B) Dive duration
C) Oxygen storage
D) Carbon dioxide tolerance
Based on the figure, what character is increasing overall as hooded seals develop into adults?A) Mass
B) Dive duration
C) Oxygen storage
D) Carbon dioxide tolerance
Question
Refer to the figure shown.
 According to the figure, which statement regarding the lung data collected about hooded seals is the most accurate?
A) The amount of O2 storage in the lung decreases during development.
B) The amount of O2 storage per kg of body mass changes the least during development.
C) Lung mass does not increase during development.
D) Lung volume does not change during development.
According to the figure, which statement regarding the lung data collected about hooded seals is the most accurate?A) The amount of O2 storage in the lung decreases during development.
B) The amount of O2 storage per kg of body mass changes the least during development.
C) Lung mass does not increase during development.
D) Lung volume does not change during development.
Question
Refer to the figure shown.
 The y axis in the figure refers to which unit of measurement?
A) Grams
B) Liters
C) mL O2
D) mL O2/kg
The y axis in the figure refers to which unit of measurement?A) Grams
B) Liters
C) mL O2
D) mL O2/kg
Question
Question
Refer to the table shown.
 Sources: L. P. Folkow and A. S. Blix. 1999. Polar Biol. 22: 61-74; L. P. Folkow et al. 2010. Polar Biol. 33: 433-441.
a More than 170,000 dives were recorded using satellite-linked dive recorders.
b Outliers that represented < 0.1% of the data set are omitted.
According to the table, which measurement changes most dramatically from weanling hooded seals to adults?
A) Duration of most dives
B) Longest dives
C) Depth of most dives
D) Deepest dives
Sources: L. P. Folkow and A. S. Blix. 1999. Polar Biol. 22: 61-74; L. P. Folkow et al. 2010. Polar Biol. 33: 433-441.a More than 170,000 dives were recorded using satellite-linked dive recorders.
b Outliers that represented < 0.1% of the data set are omitted.
According to the table, which measurement changes most dramatically from weanling hooded seals to adults?
A) Duration of most dives
B) Longest dives
C) Depth of most dives
D) Deepest dives
Question
Refer to the table shown.
 Sources: L. P. Folkow and A. S. Blix. 1999. Polar Biol. 22: 61-74; L. P. Folkow et al. 2010. Polar Biol. 33: 433-441.
a More than 170,000 dives were recorded using satellite-linked dive recorders.
b Outliers that represented < 0.1% of the data set are omitted.
According to the table, which adult measurement has changed the least from the weanling measurement?
A) Durations of most dives
B) Longest dives
C) Depths of most dives
D) Deepest dives
Sources: L. P. Folkow and A. S. Blix. 1999. Polar Biol. 22: 61-74; L. P. Folkow et al. 2010. Polar Biol. 33: 433-441.a More than 170,000 dives were recorded using satellite-linked dive recorders.
b Outliers that represented < 0.1% of the data set are omitted.
According to the table, which adult measurement has changed the least from the weanling measurement?
A) Durations of most dives
B) Longest dives
C) Depths of most dives
D) Deepest dives
Question
Refer to the figure shown.
 According to the figure, which human organ(s) develop(s) the quickest?
A) Brain
B) Digestive organs
C) Heart
D) Reproductive organs
According to the figure, which human organ(s) develop(s) the quickest?A) Brain
B) Digestive organs
C) Heart
D) Reproductive organs
Question
Refer to the figure shown.
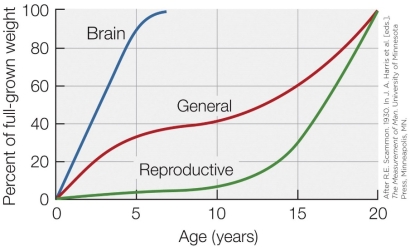 According to the figure, which organ(s) develop(s) the slowest?
A) Brain
B) Digestive organs
C) Heart
D) Reproductive organs
According to the figure, which organ(s) develop(s) the slowest?A) Brain
B) Digestive organs
C) Heart
D) Reproductive organs
Question
Question
Question
Question
Question
Question
Refer to the graphs shown.
 What physiological concept is being shown by the data in the figures?
A) Homeothermy
B) The development of thermoregulation
C) The ontogeny of metabolic rate
D) Insulation
What physiological concept is being shown by the data in the figures?A) Homeothermy
B) The development of thermoregulation
C) The ontogeny of metabolic rate
D) Insulation
Question
Refer to the graphs shown.
 What contributes most significantly to the data shown in figure II?
A) An increase in brown fat
B) An increase in the adipose layer under the skin
C) An increase in the thickness of the epidermis
D) The development of fur
What contributes most significantly to the data shown in figure II?A) An increase in brown fat
B) An increase in the adipose layer under the skin
C) An increase in the thickness of the epidermis
D) The development of fur
Question
Refer to the graphs shown.
 The patterns in figures _______ and _______ are fundamental drivers of the pattern observed in figure _______.
A) III, IV, II
B) I, III, IV
C) I, II, III
D) II, IV, I
The patterns in figures _______ and _______ are fundamental drivers of the pattern observed in figure _______.A) III, IV, II
B) I, III, IV
C) I, II, III
D) II, IV, I
Question
Refer to the graphs shown.
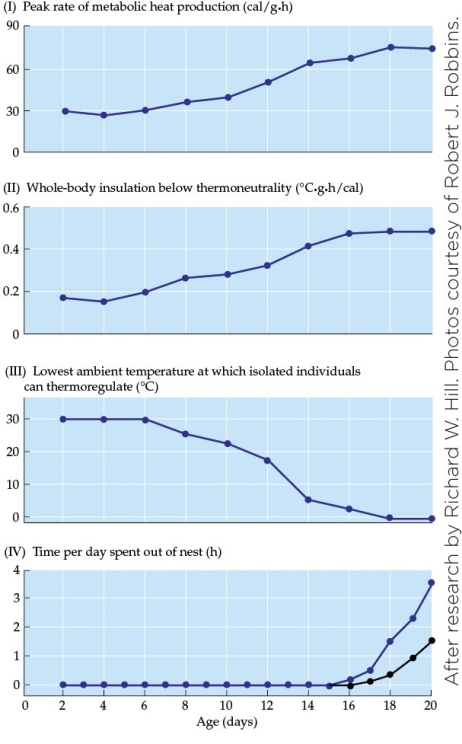 Considering the values of all panels of a mouse at 15°C on day 17 of development, which panel would represent the greatest difference when considering an adult white-footed mouse?
A) Panel I
B) Panel II
C) Panel III
D) Panel IV
Considering the values of all panels of a mouse at 15°C on day 17 of development, which panel would represent the greatest difference when considering an adult white-footed mouse?A) Panel I
B) Panel II
C) Panel III
D) Panel IV
Question
Refer to the figure shown.
 According to the figure, which enzyme(s) is(are) upregulated during the fetal stage of the rat?
A) Glycogen synthetase
B) Phosphoenolpyruvate carboxykinase
C) Glycogen synthetase and phosphoenolpyruvate carboxykinase
D) Glucokinase and phosphoenolpyruvate carboxykinase
According to the figure, which enzyme(s) is(are) upregulated during the fetal stage of the rat?A) Glycogen synthetase
B) Phosphoenolpyruvate carboxykinase
C) Glycogen synthetase and phosphoenolpyruvate carboxykinase
D) Glucokinase and phosphoenolpyruvate carboxykinase
Question
Refer to the figure shown.
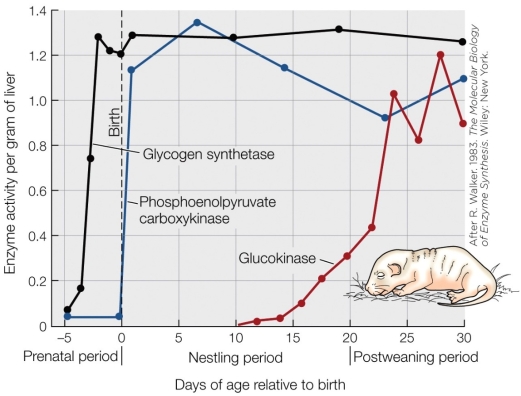 According to the data in the figure, when is the rat's blood glucose regulation fully functional?
A) At birth
B) Within a week following birth
C) By day 20
D) After day 24
According to the data in the figure, when is the rat's blood glucose regulation fully functional?A) At birth
B) Within a week following birth
C) By day 20
D) After day 24
Question
Question
Question
Question
Refer to the figure shown.
 The figure shows measurements of
A) the onset of thermoregulation.
B) organ development.
C) gene transcription.
D) enzyme upregulation.
The figure shows measurements ofA) the onset of thermoregulation.
B) organ development.
C) gene transcription.
D) enzyme upregulation.
Question
Refer to the figure shown.
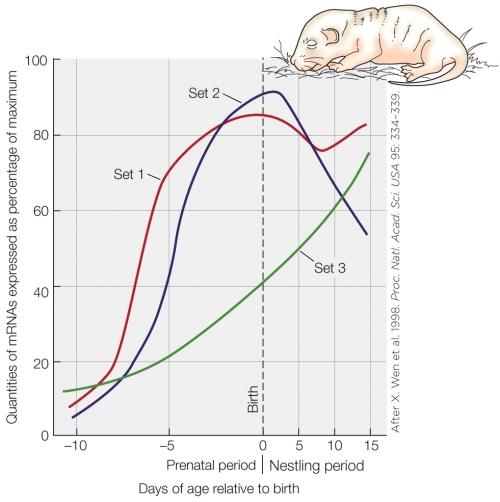 If additional data were added to the figure, the developmental trajectory would show
A) an overall increase.
B) an overall decrease.
C) a steady level or an overall increase.
D) a steady level, an overall increase, or an overall decrease.
If additional data were added to the figure, the developmental trajectory would showA) an overall increase.
B) an overall decrease.
C) a steady level or an overall increase.
D) a steady level, an overall increase, or an overall decrease.
Question
Question
Refer to the figure shown.
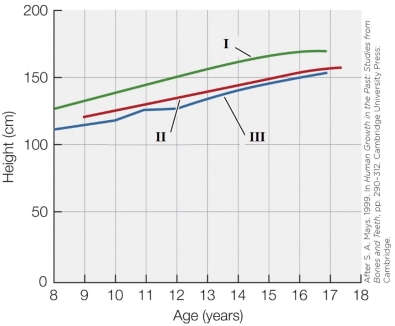 The data in the figure demonstrate the phenomenon of
A) phenotypic plasticity.
B) genotype by environment interaction.
C) epigenetics.
D) genomic imprinting.
The data in the figure demonstrate the phenomenon ofA) phenotypic plasticity.
B) genotype by environment interaction.
C) epigenetics.
D) genomic imprinting.
Question
Refer to the figure shown.
 Which of the following populations in the figure are from the twentieth century?
A) Population I
B) Population II
C) Population III
D) Populations I and II
Which of the following populations in the figure are from the twentieth century?A) Population I
B) Population II
C) Population III
D) Populations I and II
Question
Refer to the figure shown.
 In the figure, one of the lines tracks the height in a population of medieval children. These measurements were derived
A) from historical records.
B) from comparative morphology of skull sizes.
C) by assembling skeletons and measuring height.
D) from calculations of long bone lengths.
In the figure, one of the lines tracks the height in a population of medieval children. These measurements were derivedA) from historical records.
B) from comparative morphology of skull sizes.
C) by assembling skeletons and measuring height.
D) from calculations of long bone lengths.
Question
Refer to the figure shown.
 If the heights of aristocratic children living during the 1830s were charted, this line would fall _______ on the figure.
A) above line I
B) a little below line I
C) between lines II and III
D) below line III
If the heights of aristocratic children living during the 1830s were charted, this line would fall _______ on the figure.A) above line I
B) a little below line I
C) between lines II and III
D) below line III
Question
Question
Question
Question
Question
Question
Question
Question
Question
Question
Refer to the figure shown.
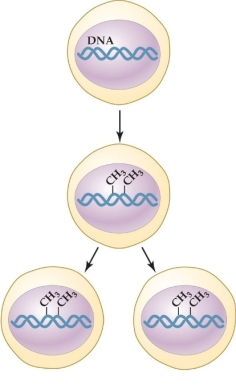 What process is shown in the figure?
A) Epigenetic marking
B) Genotypic plasticity
C) Histone methylation
D) Genomic imprinting
What process is shown in the figure?A) Epigenetic marking
B) Genotypic plasticity
C) Histone methylation
D) Genomic imprinting
Question
Question
Question
Question
Refer to the figure shown.
 The data in the figure show evidence for the existence of
A) nutritional deficiencies.
B) phenotypic plasticity.
C) epigenetic marking.
D) similarities in sibling DNA methylation.
The data in the figure show evidence for the existence ofA) nutritional deficiencies.
B) phenotypic plasticity.
C) epigenetic marking.
D) similarities in sibling DNA methylation.
Question
Refer to the figure shown.
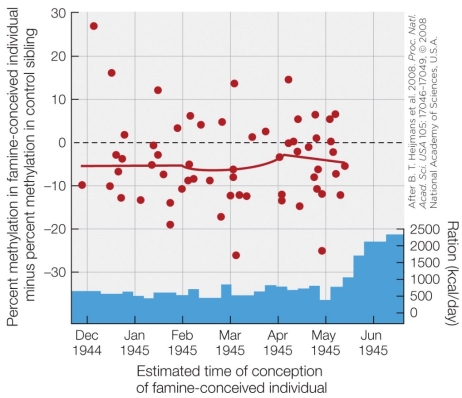 The data in the figure show that DNA methylation
A) correlates with caloric intake.
B) does not change during a famine.
C) of individuals conceived during a famine was lower than that of siblings conceived during no famine.
D) of individuals conceived during a famine was higher than that of siblings conceived during no famine.
The data in the figure show that DNA methylationA) correlates with caloric intake.
B) does not change during a famine.
C) of individuals conceived during a famine was lower than that of siblings conceived during no famine.
D) of individuals conceived during a famine was higher than that of siblings conceived during no famine.
Question
Refer to the figure shown.
 Children born during the Dutch Hunger Winter had _______ compared to their siblings.
A) comparatively more DNA methylation
B) comparatively less DNA methylation
C) comparatively more DNA expression
D) comparatively less DNA expression
Children born during the Dutch Hunger Winter had _______ compared to their siblings.A) comparatively more DNA methylation
B) comparatively less DNA methylation
C) comparatively more DNA expression
D) comparatively less DNA expression
Question
Question
Question
Question
Question
Question
Question
Question
Question
Question

Unlock Deck
Sign up to unlock the cards in this deck!
Unlock Deck
Unlock Deck
1/59
Play
Full screen (f)
Deck 4: Physiological Development and Epigenetics
1
The functions and processes occurring at all of the successive stages of individual ontogeny, as well as their mechanisms, are called
A) developmental plasticity.
B) phenotypic plasticity.
C) developmental physiology.
D) epigenetics.
A) developmental plasticity.
B) phenotypic plasticity.
C) developmental physiology.
D) epigenetics.
C
2
Which statement regarding hooded seals is true?
A) Weanlings dive as deep as adults.
B) Weanling hooded seals dive as many times per hour as adults do.
C) Weanlings have the same dive duration capabilities as adults.
D) Weanlings spend 90% of their time underwater just as adults do.
A) Weanlings dive as deep as adults.
B) Weanling hooded seals dive as many times per hour as adults do.
C) Weanlings have the same dive duration capabilities as adults.
D) Weanlings spend 90% of their time underwater just as adults do.
D
3
Which source is the most significant oxygen store during a mammalian dive?
A) Lung air
B) Blood plasma
C) Hemoglobin
D) Myoglobin in skeletal muscle
A) Lung air
B) Blood plasma
C) Hemoglobin
D) Myoglobin in skeletal muscle
C
4
As hooded seals develop from weanlings, the most dramatic increase in their ability to store oxygen during a dive is seen in
A) lung air.
B) hemoglobin.
C) myoglobin.
D) blood volume.
A) lung air.
B) hemoglobin.
C) myoglobin.
D) blood volume.
Unlock Deck
Unlock for access to all 59 flashcards in this deck.
Unlock Deck
k this deck
5
Refer to the figure shown.
Based on the figure, what character is increasing overall as hooded seals develop into adults?
A) Mass
B) Dive duration
C) Oxygen storage
D) Carbon dioxide tolerance
Based on the figure, what character is increasing overall as hooded seals develop into adults?A) Mass
B) Dive duration
C) Oxygen storage
D) Carbon dioxide tolerance
Unlock Deck
Unlock for access to all 59 flashcards in this deck.
Unlock Deck
k this deck
6
Refer to the figure shown.
According to the figure, which statement regarding the lung data collected about hooded seals is the most accurate?
A) The amount of O2 storage in the lung decreases during development.
B) The amount of O2 storage per kg of body mass changes the least during development.
C) Lung mass does not increase during development.
D) Lung volume does not change during development.
According to the figure, which statement regarding the lung data collected about hooded seals is the most accurate?A) The amount of O2 storage in the lung decreases during development.
B) The amount of O2 storage per kg of body mass changes the least during development.
C) Lung mass does not increase during development.
D) Lung volume does not change during development.
Unlock Deck
Unlock for access to all 59 flashcards in this deck.
Unlock Deck
k this deck
7
Refer to the figure shown.
The y axis in the figure refers to which unit of measurement?
A) Grams
B) Liters
C) mL O2
D) mL O2/kg
The y axis in the figure refers to which unit of measurement?A) Grams
B) Liters
C) mL O2
D) mL O2/kg
Unlock Deck
Unlock for access to all 59 flashcards in this deck.
Unlock Deck
k this deck
8
Which statement regarding developing hooded seals is false?
A) Increased body size accounts for the majority of the increase in oxygen storage.
B) Oxygen storage is twice as great per unit body weight in an adult compared to a weanling.
C) The concentration of hemoglobin increases during development.
D) In the course of development muscles more than triple their myoglobin concentration.
Unlock Deck
Unlock for access to all 59 flashcards in this deck.
Unlock Deck
k this deck
9
Refer to the table shown.
Sources: L. P. Folkow and A. S. Blix. 1999. Polar Biol. 22: 61-74; L. P. Folkow et al. 2010. Polar Biol. 33: 433-441.
a More than 170,000 dives were recorded using satellite-linked dive recorders.
b Outliers that represented < 0.1% of the data set are omitted.
According to the table, which measurement changes most dramatically from weanling hooded seals to adults?
A) Duration of most dives
B) Longest dives
C) Depth of most dives
D) Deepest dives
Sources: L. P. Folkow and A. S. Blix. 1999. Polar Biol. 22: 61-74; L. P. Folkow et al. 2010. Polar Biol. 33: 433-441.a More than 170,000 dives were recorded using satellite-linked dive recorders.
b Outliers that represented < 0.1% of the data set are omitted.
According to the table, which measurement changes most dramatically from weanling hooded seals to adults?
A) Duration of most dives
B) Longest dives
C) Depth of most dives
D) Deepest dives
Unlock Deck
Unlock for access to all 59 flashcards in this deck.
Unlock Deck
k this deck
10
Refer to the table shown.
Sources: L. P. Folkow and A. S. Blix. 1999. Polar Biol. 22: 61-74; L. P. Folkow et al. 2010. Polar Biol. 33: 433-441.
a More than 170,000 dives were recorded using satellite-linked dive recorders.
b Outliers that represented < 0.1% of the data set are omitted.
According to the table, which adult measurement has changed the least from the weanling measurement?
A) Durations of most dives
B) Longest dives
C) Depths of most dives
D) Deepest dives
Sources: L. P. Folkow and A. S. Blix. 1999. Polar Biol. 22: 61-74; L. P. Folkow et al. 2010. Polar Biol. 33: 433-441.a More than 170,000 dives were recorded using satellite-linked dive recorders.
b Outliers that represented < 0.1% of the data set are omitted.
According to the table, which adult measurement has changed the least from the weanling measurement?
A) Durations of most dives
B) Longest dives
C) Depths of most dives
D) Deepest dives
Unlock Deck
Unlock for access to all 59 flashcards in this deck.
Unlock Deck
k this deck
11
Refer to the figure shown.
According to the figure, which human organ(s) develop(s) the quickest?
A) Brain
B) Digestive organs
C) Heart
D) Reproductive organs
According to the figure, which human organ(s) develop(s) the quickest?A) Brain
B) Digestive organs
C) Heart
D) Reproductive organs
Unlock Deck
Unlock for access to all 59 flashcards in this deck.
Unlock Deck
k this deck
12
Refer to the figure shown.
According to the figure, which organ(s) develop(s) the slowest?
A) Brain
B) Digestive organs
C) Heart
D) Reproductive organs
According to the figure, which organ(s) develop(s) the slowest?A) Brain
B) Digestive organs
C) Heart
D) Reproductive organs
Unlock Deck
Unlock for access to all 59 flashcards in this deck.
Unlock Deck
k this deck
13
The human _______ has(have) attained its(their) fully grown size by the time a person is 7 years of age.
A) brain
B) lungs
C) liver
D) gonads
A) brain
B) lungs
C) liver
D) gonads
Unlock Deck
Unlock for access to all 59 flashcards in this deck.
Unlock Deck
k this deck
14
A 5-year-old human child typically devotes 50% of his or her total body metabolism to
A) skeletal muscle.
B) thermoregulation.
C) the brain.
D) sodium‒potassium pumps.
A) skeletal muscle.
B) thermoregulation.
C) the brain.
D) sodium‒potassium pumps.
Unlock Deck
Unlock for access to all 59 flashcards in this deck.
Unlock Deck
k this deck
15
Indigo buntings are able to determine which direction is north during for their first migration
A) because of innate knowledge.
B) by following their parents.
C) by using the sun as a compass.
D) by observing star movements.
A) because of innate knowledge.
B) by following their parents.
C) by using the sun as a compass.
D) by observing star movements.
Unlock Deck
Unlock for access to all 59 flashcards in this deck.
Unlock Deck
k this deck
16
The physiological regulation of body temperature is called
A) endothermy.
B) homeothermy.
C) ectothermy.
D) poikilothermy.
A) endothermy.
B) homeothermy.
C) ectothermy.
D) poikilothermy.
Unlock Deck
Unlock for access to all 59 flashcards in this deck.
Unlock Deck
k this deck
17
In terms of homeothermy, newborn mammals _______ adult mammals.
A) are less capable than
B) are more capable than
C) as capable as
D) It varies depending on the mammal species.
A) are less capable than
B) are more capable than
C) as capable as
D) It varies depending on the mammal species.
Unlock Deck
Unlock for access to all 59 flashcards in this deck.
Unlock Deck
k this deck
18
Refer to the graphs shown.
What physiological concept is being shown by the data in the figures?
A) Homeothermy
B) The development of thermoregulation
C) The ontogeny of metabolic rate
D) Insulation
What physiological concept is being shown by the data in the figures?A) Homeothermy
B) The development of thermoregulation
C) The ontogeny of metabolic rate
D) Insulation
Unlock Deck
Unlock for access to all 59 flashcards in this deck.
Unlock Deck
k this deck
19
Refer to the graphs shown.
What contributes most significantly to the data shown in figure II?
A) An increase in brown fat
B) An increase in the adipose layer under the skin
C) An increase in the thickness of the epidermis
D) The development of fur
What contributes most significantly to the data shown in figure II?A) An increase in brown fat
B) An increase in the adipose layer under the skin
C) An increase in the thickness of the epidermis
D) The development of fur
Unlock Deck
Unlock for access to all 59 flashcards in this deck.
Unlock Deck
k this deck
20
Refer to the graphs shown.
The patterns in figures _______ and _______ are fundamental drivers of the pattern observed in figure _______.
A) III, IV, II
B) I, III, IV
C) I, II, III
D) II, IV, I
The patterns in figures _______ and _______ are fundamental drivers of the pattern observed in figure _______.A) III, IV, II
B) I, III, IV
C) I, II, III
D) II, IV, I
Unlock Deck
Unlock for access to all 59 flashcards in this deck.
Unlock Deck
k this deck
21
Refer to the graphs shown.
Considering the values of all panels of a mouse at 15°C on day 17 of development, which panel would represent the greatest difference when considering an adult white-footed mouse?
A) Panel I
B) Panel II
C) Panel III
D) Panel IV
Considering the values of all panels of a mouse at 15°C on day 17 of development, which panel would represent the greatest difference when considering an adult white-footed mouse?A) Panel I
B) Panel II
C) Panel III
D) Panel IV
Unlock Deck
Unlock for access to all 59 flashcards in this deck.
Unlock Deck
k this deck
22
Refer to the figure shown.
According to the figure, which enzyme(s) is(are) upregulated during the fetal stage of the rat?
A) Glycogen synthetase
B) Phosphoenolpyruvate carboxykinase
C) Glycogen synthetase and phosphoenolpyruvate carboxykinase
D) Glucokinase and phosphoenolpyruvate carboxykinase
According to the figure, which enzyme(s) is(are) upregulated during the fetal stage of the rat?A) Glycogen synthetase
B) Phosphoenolpyruvate carboxykinase
C) Glycogen synthetase and phosphoenolpyruvate carboxykinase
D) Glucokinase and phosphoenolpyruvate carboxykinase
Unlock Deck
Unlock for access to all 59 flashcards in this deck.
Unlock Deck
k this deck
23
Refer to the figure shown.
According to the data in the figure, when is the rat's blood glucose regulation fully functional?
A) At birth
B) Within a week following birth
C) By day 20
D) After day 24
According to the data in the figure, when is the rat's blood glucose regulation fully functional?A) At birth
B) Within a week following birth
C) By day 20
D) After day 24
Unlock Deck
Unlock for access to all 59 flashcards in this deck.
Unlock Deck
k this deck
24
In an 8-day-old killifish, the major site of osmoregulation is the
A) gills.
B) egg membrane.
C) skin.
D) yolk sac membrane.
A) gills.
B) egg membrane.
C) skin.
D) yolk sac membrane.
Unlock Deck
Unlock for access to all 59 flashcards in this deck.
Unlock Deck
k this deck
25
In the killifish, the _______ are responsible for removing chloride from the body.
A) yolk sac cells
B) gills
C) chloride cells
D) skin cells
A) yolk sac cells
B) gills
C) chloride cells
D) skin cells
Unlock Deck
Unlock for access to all 59 flashcards in this deck.
Unlock Deck
k this deck
26
Researchers can study the developmental distribution of chloride transport in the killifish by
A) labeling Na+-K+-ATPase with an antibody that glows green.
B) exposing killifish to different concentrations of chloride during development and measuring chloride flux.
C) labeling the membrane of the chloride cells with a fluorescent dye.
D) using a microarray to measure the expression of chloride cells in different tissues.
Unlock Deck
Unlock for access to all 59 flashcards in this deck.
Unlock Deck
k this deck
27
Refer to the figure shown.
The figure shows measurements of
A) the onset of thermoregulation.
B) organ development.
C) gene transcription.
D) enzyme upregulation.
The figure shows measurements ofA) the onset of thermoregulation.
B) organ development.
C) gene transcription.
D) enzyme upregulation.
Unlock Deck
Unlock for access to all 59 flashcards in this deck.
Unlock Deck
k this deck
28
Refer to the figure shown.
If additional data were added to the figure, the developmental trajectory would show
A) an overall increase.
B) an overall decrease.
C) a steady level or an overall increase.
D) a steady level, an overall increase, or an overall decrease.
If additional data were added to the figure, the developmental trajectory would showA) an overall increase.
B) an overall decrease.
C) a steady level or an overall increase.
D) a steady level, an overall increase, or an overall decrease.
Unlock Deck
Unlock for access to all 59 flashcards in this deck.
Unlock Deck
k this deck
29
The ability of an animal (with a fixed genotype) to express two or more genetically controlled phenotypes is called
A) phenotypic plasticity.
B) epigenetics.
C) genotypic plasticity.
D) genomic imprinting.
A) phenotypic plasticity.
B) epigenetics.
C) genotypic plasticity.
D) genomic imprinting.
Unlock Deck
Unlock for access to all 59 flashcards in this deck.
Unlock Deck
k this deck
30
Refer to the figure shown.
The data in the figure demonstrate the phenomenon of
A) phenotypic plasticity.
B) genotype by environment interaction.
C) epigenetics.
D) genomic imprinting.
The data in the figure demonstrate the phenomenon ofA) phenotypic plasticity.
B) genotype by environment interaction.
C) epigenetics.
D) genomic imprinting.
Unlock Deck
Unlock for access to all 59 flashcards in this deck.
Unlock Deck
k this deck
31
Refer to the figure shown.
Which of the following populations in the figure are from the twentieth century?
A) Population I
B) Population II
C) Population III
D) Populations I and II
Which of the following populations in the figure are from the twentieth century?A) Population I
B) Population II
C) Population III
D) Populations I and II
Unlock Deck
Unlock for access to all 59 flashcards in this deck.
Unlock Deck
k this deck
32
Refer to the figure shown.
In the figure, one of the lines tracks the height in a population of medieval children. These measurements were derived
A) from historical records.
B) from comparative morphology of skull sizes.
C) by assembling skeletons and measuring height.
D) from calculations of long bone lengths.
In the figure, one of the lines tracks the height in a population of medieval children. These measurements were derivedA) from historical records.
B) from comparative morphology of skull sizes.
C) by assembling skeletons and measuring height.
D) from calculations of long bone lengths.
Unlock Deck
Unlock for access to all 59 flashcards in this deck.
Unlock Deck
k this deck
33
Refer to the figure shown.
If the heights of aristocratic children living during the 1830s were charted, this line would fall _______ on the figure.
A) above line I
B) a little below line I
C) between lines II and III
D) below line III
If the heights of aristocratic children living during the 1830s were charted, this line would fall _______ on the figure.A) above line I
B) a little below line I
C) between lines II and III
D) below line III
Unlock Deck
Unlock for access to all 59 flashcards in this deck.
Unlock Deck
k this deck
34
Which characteristic does not appear in the gregarious phenotypes of migratory locusts?
A) Presence of wings
B) Swarming behavior
C) Fasting behavior
E) Camouflaged coloration
A) Presence of wings
B) Swarming behavior
C) Fasting behavior
E) Camouflaged coloration
Unlock Deck
Unlock for access to all 59 flashcards in this deck.
Unlock Deck
k this deck
35
Which observation would not be considered an example of phenotypic plasticity?
A) Poor nutrition during development can delay menarche.
B) Snails grow a thicker shell in the presence of predators.
C) Butterflies develop darker pigments during the cold season.
D) Worker and queen honeybees cooperate in an elaborate control of reproduction.
A) Poor nutrition during development can delay menarche.
B) Snails grow a thicker shell in the presence of predators.
C) Butterflies develop darker pigments during the cold season.
D) Worker and queen honeybees cooperate in an elaborate control of reproduction.
Unlock Deck
Unlock for access to all 59 flashcards in this deck.
Unlock Deck
k this deck
36
Blue mussels _______ in response to the presence of crabs.
A) grow defensive spines
B) grow a thicker shell during development
C) close up and move
D) increase their shell thickness
A) grow defensive spines
B) grow a thicker shell during development
C) close up and move
D) increase their shell thickness
Unlock Deck
Unlock for access to all 59 flashcards in this deck.
Unlock Deck
k this deck
37
What is the likely adaptive advantage in the periwinkle snail's growing of a thicker shell?
A) Protection against intermittent harsh environments
B) More effective mate attraction
C) Better burrowing capabilities
D) Better protection against predation
A) Protection against intermittent harsh environments
B) More effective mate attraction
C) Better burrowing capabilities
D) Better protection against predation
Unlock Deck
Unlock for access to all 59 flashcards in this deck.
Unlock Deck
k this deck
38
When dietary protein is inadequate, a rat
A) grows up to be deficient in its ability to learn.
B) will be stunted in its growth.
C) reproduces less frequently than normal.
D) can compensate by eating more fats.
A) grows up to be deficient in its ability to learn.
B) will be stunted in its growth.
C) reproduces less frequently than normal.
D) can compensate by eating more fats.
Unlock Deck
Unlock for access to all 59 flashcards in this deck.
Unlock Deck
k this deck
39
The phenomenon in which genetically identical individuals can assume two or more distinct body forms, induced by differences in the environment, is called
A) polyphenic development.
B) epigenetics.
C) phenotypic plasticity.
D) seasonal polyphenism.
A) polyphenic development.
B) epigenetics.
C) phenotypic plasticity.
D) seasonal polyphenism.
Unlock Deck
Unlock for access to all 59 flashcards in this deck.
Unlock Deck
k this deck
40
Seasonal polyphenism in the western white butterfly aids in
A) mate attraction.
B) predator avoidance.
C) thermoregulation.
D) seasonal camouflage.
A) mate attraction.
B) predator avoidance.
C) thermoregulation.
D) seasonal camouflage.
Unlock Deck
Unlock for access to all 59 flashcards in this deck.
Unlock Deck
k this deck
41
Modifications of gene expression (with no change in DNA sequence) that are transmitted when genes replicate are called
A) epigenetic changes.
B) phenotypic plasticity.
C) genetic imprinting.
D) polyphonic development.
A) epigenetic changes.
B) phenotypic plasticity.
C) genetic imprinting.
D) polyphonic development.
Unlock Deck
Unlock for access to all 59 flashcards in this deck.
Unlock Deck
k this deck
42
What is altered during an epigenetic modification?
A) The intron of the DNA
B) Gene expression
C) The gene
D) The mRNA
A) The intron of the DNA
B) Gene expression
C) The gene
D) The mRNA
Unlock Deck
Unlock for access to all 59 flashcards in this deck.
Unlock Deck
k this deck
43
Refer to the figure shown.
What process is shown in the figure?
A) Epigenetic marking
B) Genotypic plasticity
C) Histone methylation
D) Genomic imprinting
What process is shown in the figure?A) Epigenetic marking
B) Genotypic plasticity
C) Histone methylation
D) Genomic imprinting
Unlock Deck
Unlock for access to all 59 flashcards in this deck.
Unlock Deck
k this deck
44
Which mechanism is not used for epigenetic marking?
A) DNA methylation
B) mRNA methylation
C) Histone methylation
D) Histone phosphorylation
A) DNA methylation
B) mRNA methylation
C) Histone methylation
D) Histone phosphorylation
Unlock Deck
Unlock for access to all 59 flashcards in this deck.
Unlock Deck
k this deck
45
Which process describes a mechanism whereby environmental effects are transmitted from one generation to the next?
A) Natural selection
B) Histone modification
C) Phenotypic plasticity
D) Genetic drift
A) Natural selection
B) Histone modification
C) Phenotypic plasticity
D) Genetic drift
Unlock Deck
Unlock for access to all 59 flashcards in this deck.
Unlock Deck
k this deck
46
If DNA methylation is blocked early in a developing worker honeybee, it develops into a
A) larger worker honeybee.
B) male drone honeybee.
C) queen honeybee.
D) fertile worker honeybee.
A) larger worker honeybee.
B) male drone honeybee.
C) queen honeybee.
D) fertile worker honeybee.
Unlock Deck
Unlock for access to all 59 flashcards in this deck.
Unlock Deck
k this deck
47
Refer to the figure shown.
The data in the figure show evidence for the existence of
A) nutritional deficiencies.
B) phenotypic plasticity.
C) epigenetic marking.
D) similarities in sibling DNA methylation.
The data in the figure show evidence for the existence ofA) nutritional deficiencies.
B) phenotypic plasticity.
C) epigenetic marking.
D) similarities in sibling DNA methylation.
Unlock Deck
Unlock for access to all 59 flashcards in this deck.
Unlock Deck
k this deck
48
Refer to the figure shown.
The data in the figure show that DNA methylation
A) correlates with caloric intake.
B) does not change during a famine.
C) of individuals conceived during a famine was lower than that of siblings conceived during no famine.
D) of individuals conceived during a famine was higher than that of siblings conceived during no famine.
The data in the figure show that DNA methylationA) correlates with caloric intake.
B) does not change during a famine.
C) of individuals conceived during a famine was lower than that of siblings conceived during no famine.
D) of individuals conceived during a famine was higher than that of siblings conceived during no famine.
Unlock Deck
Unlock for access to all 59 flashcards in this deck.
Unlock Deck
k this deck
49
Refer to the figure shown.
Children born during the Dutch Hunger Winter had _______ compared to their siblings.
A) comparatively more DNA methylation
B) comparatively less DNA methylation
C) comparatively more DNA expression
D) comparatively less DNA expression
Children born during the Dutch Hunger Winter had _______ compared to their siblings.A) comparatively more DNA methylation
B) comparatively less DNA methylation
C) comparatively more DNA expression
D) comparatively less DNA expression
Unlock Deck
Unlock for access to all 59 flashcards in this deck.
Unlock Deck
k this deck
50
Which of the following statements about DNA methylation is true?
A) It is generally associated with increased gene expression.
B) It is generally associated with reduced gene expression.
C) It is not generally associated with changes in gene expression.
D) It is generally not a heritable trait.
A) It is generally associated with increased gene expression.
B) It is generally associated with reduced gene expression.
C) It is not generally associated with changes in gene expression.
D) It is generally not a heritable trait.
Unlock Deck
Unlock for access to all 59 flashcards in this deck.
Unlock Deck
k this deck
51
What do hooded seals tell us about developmental physiology?
Unlock Deck
Unlock for access to all 59 flashcards in this deck.
Unlock Deck
k this deck
52
Explain why 5-year-old children may be particularly vulnerable to significant developmental damage cause by food insufficiency.
Unlock Deck
Unlock for access to all 59 flashcards in this deck.
Unlock Deck
k this deck
53
Why are white-footed mice not able to survive colder temperatures until around 18 days of development?
Unlock Deck
Unlock for access to all 59 flashcards in this deck.
Unlock Deck
k this deck
54
How do early larval killifish osmoregulate if they do not have gills?
Unlock Deck
Unlock for access to all 59 flashcards in this deck.
Unlock Deck
k this deck
55
Discuss the meaning of phenotypic plasticity and provide at least one example from human development.
Unlock Deck
Unlock for access to all 59 flashcards in this deck.
Unlock Deck
k this deck
56
We know the environment can have significant effects on development. Discuss how these effects can be adaptive or pathological. Provide examples of each.
Unlock Deck
Unlock for access to all 59 flashcards in this deck.
Unlock Deck
k this deck
57
What is meant by seasonal polyphenism? Provide an example.
Unlock Deck
Unlock for access to all 59 flashcards in this deck.
Unlock Deck
k this deck
58
Explain how the burgeoning field of epigenetics is providing a new dimension to the study of the interaction between genes and the environment.
Unlock Deck
Unlock for access to all 59 flashcards in this deck.
Unlock Deck
k this deck
59
Explain two major mechanisms of epigenetic marking.
Unlock Deck
Unlock for access to all 59 flashcards in this deck.
Unlock Deck
k this deck
Unlock Deck
Unlock for access to all 59 flashcards in this deck.


