Deck 16: Multivariate Analysis
Full screen (f)
Question
Question
A researcher develops a multivariate model in which it is hypothesized that two of the variables, X and Y, are associated but not causally related. This relationship would be illustrated in an arrow diagram as
A)
B)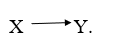
C)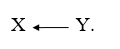
D)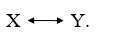
A)
B)
C)
D)
Question
According to the theoretical model: 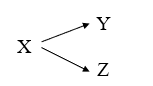
A) the inferred causal relationship between Y and Z is weak.
B) X is an intervening variable.
C) X affects Y and Z, but there is no causal relationship between Y and Z.
D) Y and Z are independent of X.
A) the inferred causal relationship between Y and Z is weak.
B) X is an intervening variable.
C) X affects Y and Z, but there is no causal relationship between Y and Z.
D) Y and Z are independent of X.
Question
In which of the following causal diagrams is the predicted relationship between X and Y negative?
A)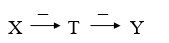
B)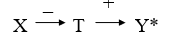
C)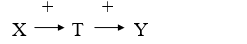
D)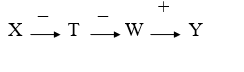
A)
B)
C)
D)
Question
Question
Question
Question
Question
Question
Which variable(s) is (are) controlled, or held constant, in each partial table of Table 1?
Table 1. Percentage of Respondents Expressing High Tolerance of Civil Liberties for Political
Dissidents, by Gender and Religiosity

A) gender
B) religiosity
C) gender and religiosity
D) tolerance of civil liberties for political dissidents
Table 1. Percentage of Respondents Expressing High Tolerance of Civil Liberties for Political
Dissidents, by Gender and Religiosity
A) gender
B) religiosity
C) gender and religiosity
D) tolerance of civil liberties for political dissidents
Question
Table 1

-Which statement best summarizes the outcome in Table 1?
A) Males are more likely to be tolerant than females.
B) Religiosity is directly related to tolerance.
C) There is no association between gender and tolerance.
D) Religiosity and gender interact to influence tolerance.
-Which statement best summarizes the outcome in Table 1?
A) Males are more likely to be tolerant than females.
B) Religiosity is directly related to tolerance.
C) There is no association between gender and tolerance.
D) Religiosity and gender interact to influence tolerance.
Question
Table 1
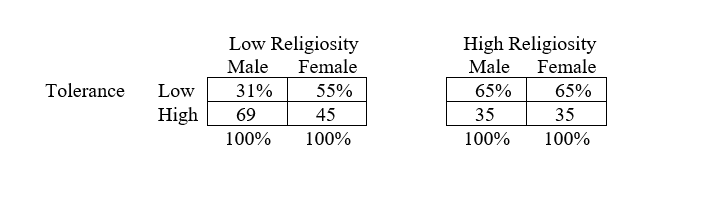
-The outcome illustrated in Table 1 is known as
A) intervention.
B) specification.
C) explanation.
D) spuriousness.
-The outcome illustrated in Table 1 is known as
A) intervention.
B) specification.
C) explanation.
D) spuriousness.
Question
Question
Question
Question
Question
Question
Question
Question
Question
Question
Question
Question
Question
Question
Consider the following path diagram representing a model of occupational prestige with path coefficients (standardized Beta slopes) estimated from the 2016 General Social Survey. Significance level: *** = p < .001.
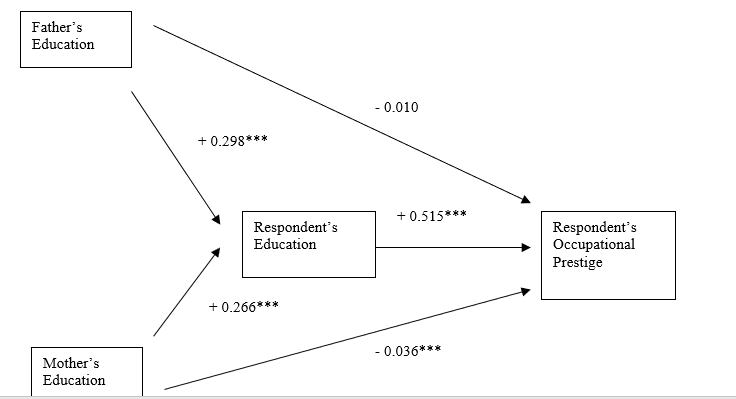
-What is the direct effect of mother's education on respondent's educational attainment?
A) Predicted education increases .266 year for every year increase in mother's education.
B) Predicted education increases .266 year for every year increase in mother's education, controlling for father's education.
C) Predicted education increases .266 standard deviation for every increase of one standard deviation in mother's education.
D) Predicted education increases .266 standard deviation for every increase of one standard deviation in mother's education, controlling for father's education.
Question
Consider the following path diagram representing a model of occupational prestige with path coefficients (standardized Beta slopes) estimated from the 2016 General Social Survey. Significance level: *** = p < .001.
-What is the indirect effect (path) of father's education on respondent's occupational prestige?
A) − 0.010
B) 0.298 + 0.515 = 0.813
C) 0.298 × 0.515 = 0.153
D) 0.298 × 0.515 × (−.0.010) = − 0.0015
-What is the indirect effect (path) of father's education on respondent's occupational prestige?
A) − 0.010
B) 0.298 + 0.515 = 0.813
C) 0.298 × 0.515 = 0.153
D) 0.298 × 0.515 × (−.0.010) = − 0.0015
Question
Question
Question
Question
Question
Question
Question
Question
Question
Question
Question
Question
Question
Question
Question
Question
Question
Question
Question
Question
Question
Question
Question
The following tables show the relationship, for employed respondents, between hours per week the respondent usually works (Work hours), level of education (number of years completed), and sex for the 2016 GSS.
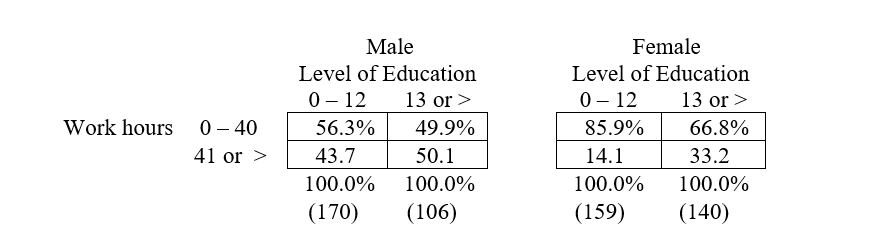 a. Which variable is controlled in each partial table?
b. Describe the relationship in each partial table.
c. The first partial (for males) has a chi-square value of 1.07, with p > .10; the second table (for females) has a chi-square value of 15.5, with p < .001. What do these statistics reveal about the relationships between the variables?
d. The zero-order association between level of education and usual hours worked per week was statistically significant. Comparing this result with the results of the partial tables, what type of elaboration outcome is shown?
a. Which variable is controlled in each partial table?b. Describe the relationship in each partial table.
c. The first partial (for males) has a chi-square value of 1.07, with p > .10; the second table (for females) has a chi-square value of 15.5, with p < .001. What do these statistics reveal about the relationships between the variables?
d. The zero-order association between level of education and usual hours worked per week was statistically significant. Comparing this result with the results of the partial tables, what type of elaboration outcome is shown?
Question
Question

Unlock Deck
Sign up to unlock the cards in this deck!
Unlock Deck
Unlock Deck
1/52
Play
Full screen (f)
Deck 16: Multivariate Analysis
1
Statistical control of extraneous variables in a survey is analogous to __________ in an experiment.
A) randomly assigning research participants to experimental conditions
B) manipulating the independent variable
C) pretesting (i.e., pre-measuring) the dependent variable
D) posttesting the dependent variable.
A) randomly assigning research participants to experimental conditions
B) manipulating the independent variable
C) pretesting (i.e., pre-measuring) the dependent variable
D) posttesting the dependent variable.
A
2
A researcher develops a multivariate model in which it is hypothesized that two of the variables, X and Y, are associated but not causally related. This relationship would be illustrated in an arrow diagram as
A)
B)
C)
D)
A)
B)
C)
D)
A
3
According to the theoretical model:
A) the inferred causal relationship between Y and Z is weak.
B) X is an intervening variable.
C) X affects Y and Z, but there is no causal relationship between Y and Z.
D) Y and Z are independent of X.
A) the inferred causal relationship between Y and Z is weak.
B) X is an intervening variable.
C) X affects Y and Z, but there is no causal relationship between Y and Z.
D) Y and Z are independent of X.
C
4
In which of the following causal diagrams is the predicted relationship between X and Y negative?
A)
B)
C)
D)
A)
B)
C)
D)
Unlock Deck
Unlock for access to all 52 flashcards in this deck.
Unlock Deck
k this deck
5
The stochastic component of a statistical model may correspond to all but which one of the following sources of variation?
A) random sampling error
B) systematic measurement error
C) random measurement error
D) chance differences among experimental conditions
A) random sampling error
B) systematic measurement error
C) random measurement error
D) chance differences among experimental conditions
Unlock Deck
Unlock for access to all 52 flashcards in this deck.
Unlock Deck
k this deck
6
Which of the following is not typically a step in elaboration analysis?
A) examine the bivariate relationship between X and Y
B) consider extraneous variables that might affect the original X − Y relationship
C) control statistically for the influence of extraneous variables
D) simultaneously control for several additional extraneous variables
A) examine the bivariate relationship between X and Y
B) consider extraneous variables that might affect the original X − Y relationship
C) control statistically for the influence of extraneous variables
D) simultaneously control for several additional extraneous variables
Unlock Deck
Unlock for access to all 52 flashcards in this deck.
Unlock Deck
k this deck
7
Suppose you examine the relationship between participation in interscholastic sports (yes/no) and grade-point average (low, medium, high). Controlling for the variable sex (male/female) would require the creation of __________ partial tables.
A) one
B) two
C) three
D) four
E) five
A) one
B) two
C) three
D) four
E) five
Unlock Deck
Unlock for access to all 52 flashcards in this deck.
Unlock Deck
k this deck
8
In elaboration analysis, two variables are spuriously related if the original bivariate relationship __________ when an extraneous __________ variable is controlled.
A) remains the same; intervening
B) remains the same; antecedent
C) disappears; intervening
D) disappears; antecedent
A) remains the same; intervening
B) remains the same; antecedent
C) disappears; intervening
D) disappears; antecedent
Unlock Deck
Unlock for access to all 52 flashcards in this deck.
Unlock Deck
k this deck
9
A multivariate cross-tabulation with one control variable is called
A) a first-order partial table.
B) a spurious table.
C) a suppressed table.
D) an explained table.
E) a compressed table.
A) a first-order partial table.
B) a spurious table.
C) a suppressed table.
D) an explained table.
E) a compressed table.
Unlock Deck
Unlock for access to all 52 flashcards in this deck.
Unlock Deck
k this deck
10
Which variable(s) is (are) controlled, or held constant, in each partial table of Table 1?
Table 1. Percentage of Respondents Expressing High Tolerance of Civil Liberties for Political
Dissidents, by Gender and Religiosity
A) gender
B) religiosity
C) gender and religiosity
D) tolerance of civil liberties for political dissidents
Table 1. Percentage of Respondents Expressing High Tolerance of Civil Liberties for Political
Dissidents, by Gender and Religiosity
A) gender
B) religiosity
C) gender and religiosity
D) tolerance of civil liberties for political dissidents
Unlock Deck
Unlock for access to all 52 flashcards in this deck.
Unlock Deck
k this deck
11
Table 1
-Which statement best summarizes the outcome in Table 1?
A) Males are more likely to be tolerant than females.
B) Religiosity is directly related to tolerance.
C) There is no association between gender and tolerance.
D) Religiosity and gender interact to influence tolerance.
-Which statement best summarizes the outcome in Table 1?
A) Males are more likely to be tolerant than females.
B) Religiosity is directly related to tolerance.
C) There is no association between gender and tolerance.
D) Religiosity and gender interact to influence tolerance.
Unlock Deck
Unlock for access to all 52 flashcards in this deck.
Unlock Deck
k this deck
12
Table 1
-The outcome illustrated in Table 1 is known as
A) intervention.
B) specification.
C) explanation.
D) spuriousness.
-The outcome illustrated in Table 1 is known as
A) intervention.
B) specification.
C) explanation.
D) spuriousness.
Unlock Deck
Unlock for access to all 52 flashcards in this deck.
Unlock Deck
k this deck
13
In elaboration analysis, __________ has the same empirical requirements and outcomes as __________.
A) explanation; interpretation
B) explanation; replication
C) interpretation; specification
D) replication; specification
E) explanation; specification
A) explanation; interpretation
B) explanation; replication
C) interpretation; specification
D) replication; specification
E) explanation; specification
Unlock Deck
Unlock for access to all 52 flashcards in this deck.
Unlock Deck
k this deck
14
The presence of a __________ variable makes a relationship __________.
A) distorter; appear to be in the wrong direction
B) distorter; appear weaker than it actually is
C) suppressor; appear to be in the wrong direction
D) intervening; appear to be in the wrong direction.
A) distorter; appear to be in the wrong direction
B) distorter; appear weaker than it actually is
C) suppressor; appear to be in the wrong direction
D) intervening; appear to be in the wrong direction.
Unlock Deck
Unlock for access to all 52 flashcards in this deck.
Unlock Deck
k this deck
15
Variables X and Y are positively related for males and negatively related for females. This is an example of
A) reverse replication.
B) spuriousness.
C) specification (interaction).
D) a distorter effect.
A) reverse replication.
B) spuriousness.
C) specification (interaction).
D) a distorter effect.
Unlock Deck
Unlock for access to all 52 flashcards in this deck.
Unlock Deck
k this deck
16
A partial-regression coefficient in a multiple regression equation
A) is the result of a specification error.
B) usually has the same value as the corresponding bivariate regression coefficient.
C) indicates the influence of an independent variable on the dependent variable when other independent variables are held constant.
D) is a product of multicollinearity.
A) is the result of a specification error.
B) usually has the same value as the corresponding bivariate regression coefficient.
C) indicates the influence of an independent variable on the dependent variable when other independent variables are held constant.
D) is a product of multicollinearity.
Unlock Deck
Unlock for access to all 52 flashcards in this deck.
Unlock Deck
k this deck
17
Which of the following would not pose a problem for the interpretation of a multiple linear regression analysis?
A) nominal-scale independent variables
B) multicollinearity
C) misspecification
D) curvilinear relationship between independent and dependent variable
A) nominal-scale independent variables
B) multicollinearity
C) misspecification
D) curvilinear relationship between independent and dependent variable
Unlock Deck
Unlock for access to all 52 flashcards in this deck.
Unlock Deck
k this deck
18
A dummy variable in a multiple regression analysis is
A) an unmeasured variable that is excluded from the underlying causal model.
B) an uncontrolled variable that creates a spurious relationship.
C) an uncontrolled variable that intervenes or "mediates" a relationship.
D) a variable with values of 0 and 1 used to represent a nominal- or ordinal-scale variable.
Unlock Deck
Unlock for access to all 52 flashcards in this deck.
Unlock Deck
k this deck
19
When Becket Broh regressed twelfth-grade math grades on sports participation and developmental variables such as locus of control and homework, the relationship between sports participation and grades __________, thus supporting the developmental model.
A) increased
B) reduced to nonsignificance
C) remained the same as the bivariate (zero-order) relationship.
D) remained the same as when she regressed sports participation on antecedent control variables
A) increased
B) reduced to nonsignificance
C) remained the same as the bivariate (zero-order) relationship.
D) remained the same as when she regressed sports participation on antecedent control variables
Unlock Deck
Unlock for access to all 52 flashcards in this deck.
Unlock Deck
k this deck
20
Using the 2016 GSS, we regressed the number of hours of television watched on the average day on three variables: years of education, age, and marital status. Marital status is a dummy variable with 1 = married. We get the following results for the unstandardized regression coefficients: TVhours = 4.63 - .15Educ + .01Age - .34Married. According to this equation,
A) There is a near zero association between education and television viewing.
B) Younger people watch more hours of television, on average, than older people.
C) Married people watch fewer hours of television, on average, than unmarried people.
D) Marital status is more strongly associated with hours of television viewing than age.
Unlock Deck
Unlock for access to all 52 flashcards in this deck.
Unlock Deck
k this deck
21
Using the 2016 GSS, we regressed the number of hours of television watched on the average day on three variables: years of education, age, and marital status. Marital status is a dummy variable with 1 = married. We get the following results for the unstandardized regression coefficients: TVhours = 4.63 - .15Educ + .01Age - .34Married. What is the predicted number of hours of television viewing for a 20-year-old, unmarried person with 14 years of education?
A) 1.93
B) 2.73
C) 4.15
D) 5.25
A) 1.93
B) 2.73
C) 4.15
D) 5.25
Unlock Deck
Unlock for access to all 52 flashcards in this deck.
Unlock Deck
k this deck
22
Using the 2016 GSS, we regressed the number of hours of television watched on the average day on three variables: years of education, age, and marital status. Marital status is a dummy variable with 1 = married. We get the following results for the standardized regression coefficients: TVhours = - .20Educ + .07Age - .07Married. According to this equation,
A) none of the variables is significantly related to television viewing.
B) all three variables are significantly related to television viewing.
C) age has the strongest association with television viewing.
D) education has a stronger association with television viewing than age.
A) none of the variables is significantly related to television viewing.
B) all three variables are significantly related to television viewing.
C) age has the strongest association with television viewing.
D) education has a stronger association with television viewing than age.
Unlock Deck
Unlock for access to all 52 flashcards in this deck.
Unlock Deck
k this deck
23
Suppose you wanted to include marital status, a nominal-scale variable with five categories, in a multiple regression analysis. This would require the
A) creation of four dummy variables.
B) creation of five dummy variables.
C) analysis of four different multiple regressions.
D) analysis of five different multiple regressions.
A) creation of four dummy variables.
B) creation of five dummy variables.
C) analysis of four different multiple regressions.
D) analysis of five different multiple regressions.
Unlock Deck
Unlock for access to all 52 flashcards in this deck.
Unlock Deck
k this deck
24
Which of the following statements is not true of path analysis?
A) It is a form of multivariate causal modeling.
B) It is depicted with arrow diagrams.
C) It uses unstandardized regression coefficients.
D) It assesses both direct and indirect effects.
A) It is a form of multivariate causal modeling.
B) It is depicted with arrow diagrams.
C) It uses unstandardized regression coefficients.
D) It assesses both direct and indirect effects.
Unlock Deck
Unlock for access to all 52 flashcards in this deck.
Unlock Deck
k this deck
25
Each coefficient in a path analysis, called a "path coefficient,"
A) is an unstandardized regression coefficient.
B) consists of the bivariate correlation between the given pair of variables.
C) is derived from a multiple regression equation.
D) represents the total effect of the independent variable on the dependent variable.
A) is an unstandardized regression coefficient.
B) consists of the bivariate correlation between the given pair of variables.
C) is derived from a multiple regression equation.
D) represents the total effect of the independent variable on the dependent variable.
Unlock Deck
Unlock for access to all 52 flashcards in this deck.
Unlock Deck
k this deck
26
Consider the following path diagram representing a model of occupational prestige with path coefficients (standardized Beta slopes) estimated from the 2016 General Social Survey. Significance level: *** = p < .001.
-What is the direct effect of mother's education on respondent's educational attainment?
A) Predicted education increases .266 year for every year increase in mother's education.
B) Predicted education increases .266 year for every year increase in mother's education, controlling for father's education.
C) Predicted education increases .266 standard deviation for every increase of one standard deviation in mother's education.
D) Predicted education increases .266 standard deviation for every increase of one standard deviation in mother's education, controlling for father's education.
Unlock Deck
Unlock for access to all 52 flashcards in this deck.
Unlock Deck
k this deck
27
Consider the following path diagram representing a model of occupational prestige with path coefficients (standardized Beta slopes) estimated from the 2016 General Social Survey. Significance level: *** = p < .001.
-What is the indirect effect (path) of father's education on respondent's occupational prestige?
A) − 0.010
B) 0.298 + 0.515 = 0.813
C) 0.298 × 0.515 = 0.153
D) 0.298 × 0.515 × (−.0.010) = − 0.0015
-What is the indirect effect (path) of father's education on respondent's occupational prestige?
A) − 0.010
B) 0.298 + 0.515 = 0.813
C) 0.298 × 0.515 = 0.153
D) 0.298 × 0.515 × (−.0.010) = − 0.0015
Unlock Deck
Unlock for access to all 52 flashcards in this deck.
Unlock Deck
k this deck
28
Which statement below best summarizes the path model results?
A) Parents' educational levels have no effects on the occupational prestige of their children.
B) Parents' educational levels have only direct effects on the occupational prestige of their children.
C) Parents' educational levels have only indirect effects (through their children's educational attainment) on the occupational prestige of their children.
D) Parents' educational levels have both direct and indirect effects on the occupational prestige of their children.
Unlock Deck
Unlock for access to all 52 flashcards in this deck.
Unlock Deck
k this deck
29
In nonexperimental research, as in experiments, it is possible to control statistically for variables that have not been measured.
Unlock Deck
Unlock for access to all 52 flashcards in this deck.
Unlock Deck
k this deck
30
In nonexperimental research, inferences about direction of influence usually are based on statistical analysis.
Unlock Deck
Unlock for access to all 52 flashcards in this deck.
Unlock Deck
k this deck
31
In the model X → T →Y, the relationship between X and Y is spurious.
Unlock Deck
Unlock for access to all 52 flashcards in this deck.
Unlock Deck
k this deck
32
The predicted direction of the relationship between X and Y is determined by multiplying the signs (+ or −) of all the intervening links between X and Y.
Unlock Deck
Unlock for access to all 52 flashcards in this deck.
Unlock Deck
k this deck
33
The systematic component in a statistical model pertains to hypothesized relationships.
Unlock Deck
Unlock for access to all 52 flashcards in this deck.
Unlock Deck
k this deck
34
Statistical control in nonexperimental research is analogous to the manipulation of the independent variable in experiments.
Unlock Deck
Unlock for access to all 52 flashcards in this deck.
Unlock Deck
k this deck
35
In elaboration analysis, statistically controlling for an intervening variable may reveal a spurious association.
Unlock Deck
Unlock for access to all 52 flashcards in this deck.
Unlock Deck
k this deck
36
A specification outcome in elaboration analysis means that there is an interaction effect.
Unlock Deck
Unlock for access to all 52 flashcards in this deck.
Unlock Deck
k this deck
37
One strength of elaboration analysis is that it permits the simultaneous control of several independent variables.
Unlock Deck
Unlock for access to all 52 flashcards in this deck.
Unlock Deck
k this deck
38
A zero-order relationship means that there is no association between the variables.
Unlock Deck
Unlock for access to all 52 flashcards in this deck.
Unlock Deck
k this deck
39
Multivariate regression is more likely than bivariate regression to produce a specification error.
Unlock Deck
Unlock for access to all 52 flashcards in this deck.
Unlock Deck
k this deck
40
Leaving out important variables from a model is called a "specification error."
Unlock Deck
Unlock for access to all 52 flashcards in this deck.
Unlock Deck
k this deck
41
"Collinearity" refers to a perfect association between variables.
Unlock Deck
Unlock for access to all 52 flashcards in this deck.
Unlock Deck
k this deck
42
R2 is a popular measure of how well a statistical model fits the data.
Unlock Deck
Unlock for access to all 52 flashcards in this deck.
Unlock Deck
k this deck
43
Multiple regression is limited to the analysis of interval- and ratio-scale independent variables.
Unlock Deck
Unlock for access to all 52 flashcards in this deck.
Unlock Deck
k this deck
44
A dummy variable is a dichotomous variable with variable categories arbitrarily coded 0 and 1.
Unlock Deck
Unlock for access to all 52 flashcards in this deck.
Unlock Deck
k this deck
45
To determine which independent variable has the greatest impact in a multiple regression, researchers use unstandardized regression coefficients.
Unlock Deck
Unlock for access to all 52 flashcards in this deck.
Unlock Deck
k this deck
46
Path analysis provides quantitative estimates of both direct and indirect effects.
Unlock Deck
Unlock for access to all 52 flashcards in this deck.
Unlock Deck
k this deck
47
Draw an arrow diagram representing a causal ordering and likely direction of relationship (positive or negative) among the following set of variables: respondent's newspaper readership (frequency), educational attainment, and age.
Unlock Deck
Unlock for access to all 52 flashcards in this deck.
Unlock Deck
k this deck
48
Explain the differences between the ideal elaboration outcomes of explanation, interpretation, specification, and replication.
Unlock Deck
Unlock for access to all 52 flashcards in this deck.
Unlock Deck
k this deck
49
Explain the difference between the regression coefficient in bivariate regression and the partial-regression coefficient in multiple regression.
Unlock Deck
Unlock for access to all 52 flashcards in this deck.
Unlock Deck
k this deck
50
The following tables show the relationship, for employed respondents, between hours per week the respondent usually works (Work hours), level of education (number of years completed), and sex for the 2016 GSS.
a. Which variable is controlled in each partial table?
b. Describe the relationship in each partial table.
c. The first partial (for males) has a chi-square value of 1.07, with p > .10; the second table (for females) has a chi-square value of 15.5, with p < .001. What do these statistics reveal about the relationships between the variables?
d. The zero-order association between level of education and usual hours worked per week was statistically significant. Comparing this result with the results of the partial tables, what type of elaboration outcome is shown?
a. Which variable is controlled in each partial table?b. Describe the relationship in each partial table.
c. The first partial (for males) has a chi-square value of 1.07, with p > .10; the second table (for females) has a chi-square value of 15.5, with p < .001. What do these statistics reveal about the relationships between the variables?
d. The zero-order association between level of education and usual hours worked per week was statistically significant. Comparing this result with the results of the partial tables, what type of elaboration outcome is shown?
Unlock Deck
Unlock for access to all 52 flashcards in this deck.
Unlock Deck
k this deck
51
What predicts the amount of time that people spend on the Internet? Based on 2016 GSS data, the regression of hours per week on the Internet (Y) on age, education (number of years completed), and verbal ability (number of correct words on a ten-item vocabulary test) produced the following equation:
Y = 9.327 - .161Age + .348Educ + .489Verbal
a. Explain the meaning of the regression coefficient for Educ (years of education completed)?
b. How much does hours on the Internet change for each increase of one year in a respondent's age?
c. Calculate the number of hours per week on the Internet for a 30-year-old with 16 years of education who got all ten words correct on the vocabulary test.
Using standardized regression coefficients, the multiple regression of Internet hours has the following values (all coefficients are statistically significant):
Y = - .179Age + .065Educ + .064Verbal
d. Which variable has the largest effect on weekly hours on the Internet?
Unlock Deck
Unlock for access to all 52 flashcards in this deck.
Unlock Deck
k this deck
52
Someone at your college conducts a survey on helping and voluntarism. Suppose you are consulted about how to analyze the data to test the hypothesis that students majoring in the arts are more likely to do volunteer work than students majoring in the sciences. (a) What questions would you ask about the data before you make your recommendations? (b) As you might point out, why is a bivariate analysis seldom, if ever, sufficient to test a hypothesis that one variable causes another? (c) As you might explain, how is multiple regression superior to elaboration?
Unlock Deck
Unlock for access to all 52 flashcards in this deck.
Unlock Deck
k this deck
Unlock Deck
Unlock for access to all 52 flashcards in this deck.


