Deck 16: The Nature of Communities
Full screen (f)
Question
Question
Question
Question
Question
Question
Question
Question
Question
Refer to the figure.
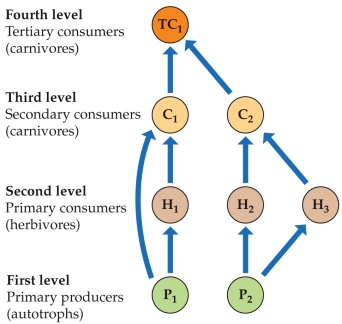 Considering the food web, imagine a circumstance where a new, mutually beneficial relationship develops between H2 and H3, increasing both of their numbers. The effects of this on P2 and C2 are best described as
A) a direct negative effect on P2 and a trophic facilitation effect on C2.
B) an indirect positive effect on P2 and a direct negative effect on C2.
C) a trophic facilitation effect on both C2 and P2.
D) a direct negative effect on both C2 and P2.
Considering the food web, imagine a circumstance where a new, mutually beneficial relationship develops between H2 and H3, increasing both of their numbers. The effects of this on P2 and C2 are best described asA) a direct negative effect on P2 and a trophic facilitation effect on C2.
B) an indirect positive effect on P2 and a direct negative effect on C2.
C) a trophic facilitation effect on both C2 and P2.
D) a direct negative effect on both C2 and P2.
Question
Question
Question
Refer to the figure.
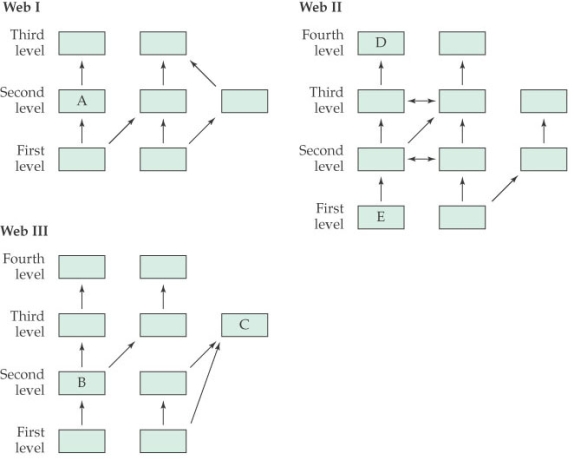
-Which web(s) in the figure is(are) an interaction web?
A) Web I
B) Web II
C) Web III
D) Web II and Web III
-Which web(s) in the figure is(are) an interaction web?
A) Web I
B) Web II
C) Web III
D) Web II and Web III
Question
Refer to the figure.

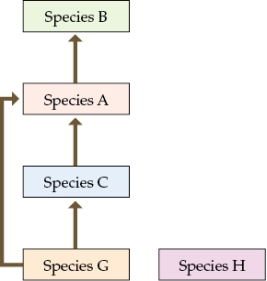
- Which species in the figure is an omnivore?
A) Species A
B) Species B
C) Species C
D) Species D
- Which species in the figure is an omnivore?
A) Species A
B) Species B
C) Species C
D) Species D
Question
Refer to the figure.

- Which species in the figure is a primary producer?
A) Species A
B) Species B
C) Species C
D) Species E
- Which species in the figure is a primary producer?
A) Species A
B) Species B
C) Species C
D) Species E
Question
Refer to the figure.

-According to the figure, species A is a(n)
A) primary producer.
B) herbivore.
C) carnivore.
D) omnivore.
-According to the figure, species A is a(n)
A) primary producer.
B) herbivore.
C) carnivore.
D) omnivore.
Question
Question
Question
Refer to the tables.
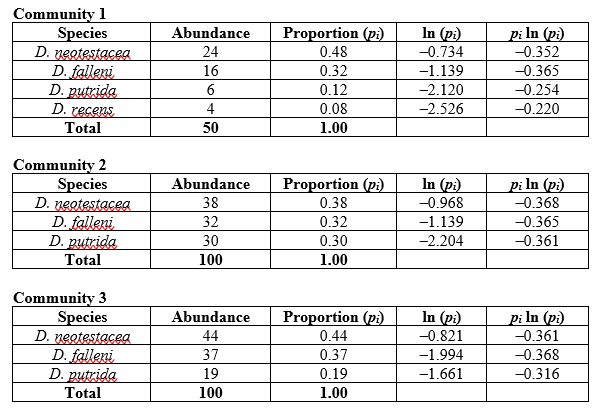
A) Community 1 > Community 2 > Community 3
B) Community 1 > Community 3 > Community 2
C) Community 2 > Community 1 > Community 3
D) Community 3 > Community 2 > Community 1
A) Community 1 > Community 2 > Community 3
B) Community 1 > Community 3 > Community 2
C) Community 2 > Community 1 > Community 3
D) Community 3 > Community 2 > Community 1
Question
Refer to the tables.
A) 1.000
B) 1.094
C) 1.191
D) 6.519
A) 1.000
B) 1.094
C) 1.191
D) 6.519
Question
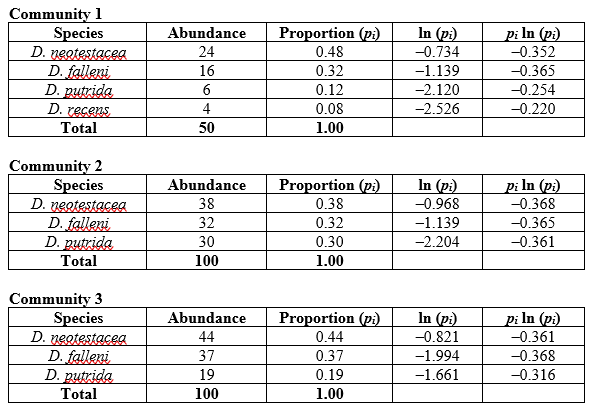
Refer to the table.
![<strong>Refer to the table. </strong> A) ‒[0.48 (ln 0.48) + 0.32 (ln 0.32) + 0.12 (ln 0.12)] B) ‒[0.48 (ln 0.48) + 0.32 (ln 0.32) + 0.2 (ln 0.2)] C) 0.48 (ln 0.48) + 0.32 (ln 0.32) + 0.12 (ln 0.12) D) 0.48 (ln 0.48) + 0.32 (ln 0.32) + 0.2 (ln 0.2) <div style=padding-top: 35px>](https://storage.examlex.com/TBO1115/11ed489c_c913_f68c_be58_03041c05972d_TBO1115_00.jpg)
A) ‒[0.48 (ln 0.48) + 0.32 (ln 0.32) + 0.12 (ln 0.12)]
B) ‒[0.48 (ln 0.48) + 0.32 (ln 0.32) + 0.2 (ln 0.2)]
C) 0.48 (ln 0.48) + 0.32 (ln 0.32) + 0.12 (ln 0.12)
D) 0.48 (ln 0.48) + 0.32 (ln 0.32) + 0.2 (ln 0.2)
A) ‒[0.48 (ln 0.48) + 0.32 (ln 0.32) + 0.12 (ln 0.12)]
B) ‒[0.48 (ln 0.48) + 0.32 (ln 0.32) + 0.2 (ln 0.2)]
C) 0.48 (ln 0.48) + 0.32 (ln 0.32) + 0.12 (ln 0.12)
D) 0.48 (ln 0.48) + 0.32 (ln 0.32) + 0.2 (ln 0.2)
Question
Question
Question
Question
Question
Question
Question
Question
Question
Refer to the figure.

-Research has suggested that in some cases, killer whales (Orcinus orca) have increased their predation on sea otters. This would have a(n) _______ effect on kelp.
A) direct positive
B) direct negative
C) indirect positive
D) indirect negative
-Research has suggested that in some cases, killer whales (Orcinus orca) have increased their predation on sea otters. This would have a(n) _______ effect on kelp.
A) direct positive
B) direct negative
C) indirect positive
D) indirect negative
Question
Refer to the figure.
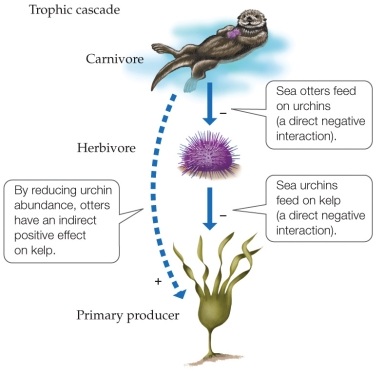
- If another predator were to begin competing with sea otters for the urchins, they would have a(n) _______ effect on otters and a(n) _______ effect on urchins.
A) direct negative; direct positive
B) direct negative; direct negative
C) direct negative; indirect negative
D) direct positive; direct negative
Question
Refer to the figure.
 Considering the figure, which of the following scenarios would be best described as trophic facilitation?
A) A wolf feeding on deer assists aspen trees in regeneration
B) Ravens, eagles, and vultures consuming an elk carcass left behind by the wolves that made the kill
C) Two species of squirrel each consuming the same type of nut, resulting in reduced numbers of germinating seeds
D) Three species of birds that directly compete with each other for similar resources, with no one species dominating any other
Considering the figure, which of the following scenarios would be best described as trophic facilitation?A) A wolf feeding on deer assists aspen trees in regeneration
B) Ravens, eagles, and vultures consuming an elk carcass left behind by the wolves that made the kill
C) Two species of squirrel each consuming the same type of nut, resulting in reduced numbers of germinating seeds
D) Three species of birds that directly compete with each other for similar resources, with no one species dominating any other
Question
Question
Question
Question
Question
Question
Question
Question
Refer to the figure.
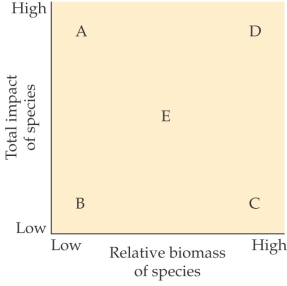
- Where would a keystone species most likely be located in the figure?
A) Position A
B) Position B
C) Position D
D) Position E
- Where would a keystone species most likely be located in the figure?
A) Position A
B) Position B
C) Position D
D) Position E
Question
Refer to the figure.
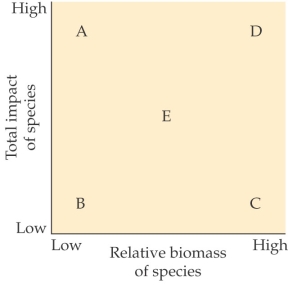
- Where would a foundation species most likely be located in the figure?
A) Position A
B) Position B
C) Position C
D) Position D
- Where would a foundation species most likely be located in the figure?
A) Position A
B) Position B
C) Position C
D) Position D
Question
Question
Question
Question
Question
Question
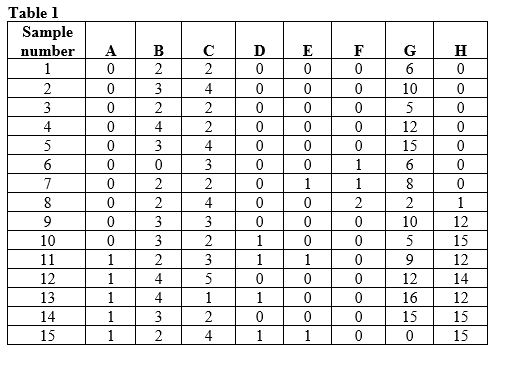
Refer to the table.
Table 1
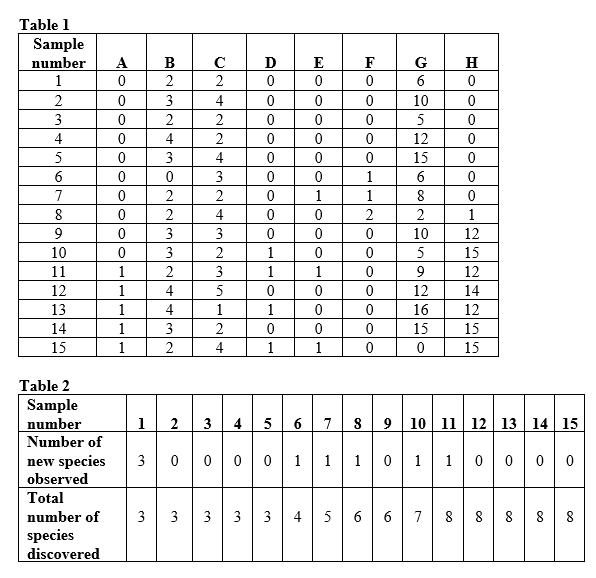
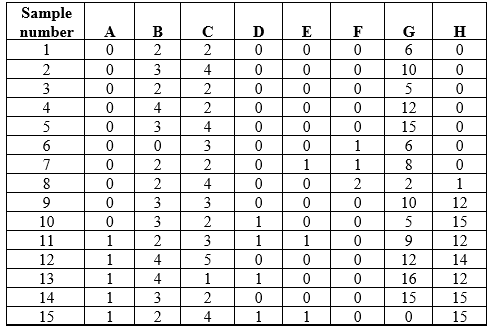 Suppose you are researching an ecological community in a new study area. You divide your study area into quadrats and sample one quadrat a day to determine the species that occupy the area and how many individuals of these species are present. Assume that by the end of your sampling efforts, you have identified all of the species that occur in the study area. Table 1 shows the data collected for each sample for species A-H and indicates the number of individuals of each species identified in each quadrat. Use the table to investigate the pattern of species discoveries in your data. Then, create a new data table (this will be referred to as Table 2) that reflects the number of new species discovered as a function of the number of samples. Include the number of new species observed in each sample and the total number of species discovered over the course of your sampling.
Table 1
Suppose you are researching an ecological community in a new study area. You divide your study area into quadrats and sample one quadrat a day to determine the species that occupy the area and how many individuals of these species are present. Assume that by the end of your sampling efforts, you have identified all of the species that occur in the study area. Table 1 shows the data collected for each sample for species A-H and indicates the number of individuals of each species identified in each quadrat. Use the table to investigate the pattern of species discoveries in your data. Then, create a new data table (this will be referred to as Table 2) that reflects the number of new species discovered as a function of the number of samples. Include the number of new species observed in each sample and the total number of species discovered over the course of your sampling. Question
Refer to the tables.
 Suppose you are researching an ecological community in a new study area. You divide your study area into quadrats and sample one quadrat a day to determine the species that occupy the area and how many individuals of these species are present. Assume that by the end of your sampling efforts, you have identified all of the species that occur in the study area. Use the numbers of individuals from Table 1 and the number of species in Table 2 to graph the relationship between total individuals and total species identified during your sampling efforts (this will be referred to as Figure 1). Graph your data as a line graph.
Suppose you are researching an ecological community in a new study area. You divide your study area into quadrats and sample one quadrat a day to determine the species that occupy the area and how many individuals of these species are present. Assume that by the end of your sampling efforts, you have identified all of the species that occur in the study area. Use the numbers of individuals from Table 1 and the number of species in Table 2 to graph the relationship between total individuals and total species identified during your sampling efforts (this will be referred to as Figure 1). Graph your data as a line graph. Question
Refer to the tables and figure.
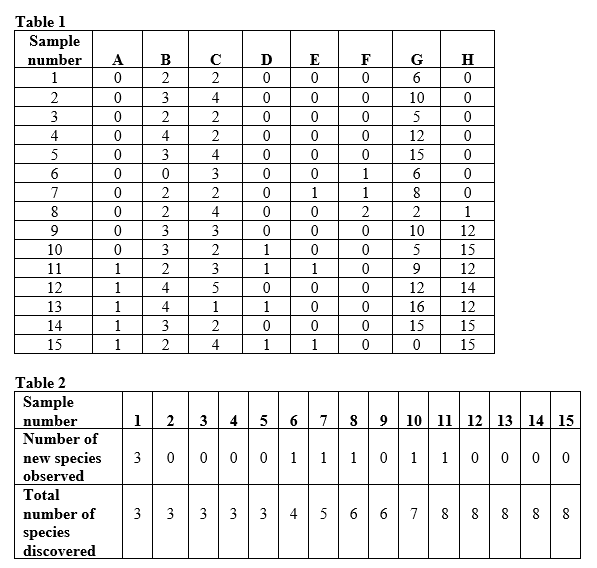 Figure 1
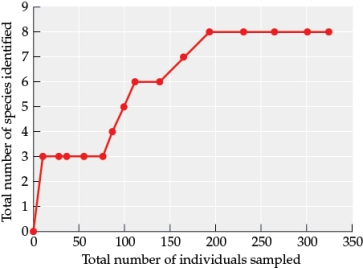 Suppose you are researching an ecological community in a new study area. You divide your study area into quadrats and sample one quadrat a day to determine the species that occupy the area and how many individuals of these species are present. Assume that by the end of your sampling efforts, you have identified all of the species that occur in the study area. Use Table 1, Table 2, and Figure 1 to answer the following questions:
a) In community ecology studies, what is the relationship that you graphed in Figure 1 commonly called?
b) Which species community measure did you plot on the y-axis of the graph?
c) What percentage of the total individuals did you have to sample before you identified all of the species in your study area?
d) How many quadrats did you have to sample before you identified all of the species in your study area?
Figure 1 Suppose you are researching an ecological community in a new study area. You divide your study area into quadrats and sample one quadrat a day to determine the species that occupy the area and how many individuals of these species are present. Assume that by the end of your sampling efforts, you have identified all of the species that occur in the study area. Use Table 1, Table 2, and Figure 1 to answer the following questions:a) In community ecology studies, what is the relationship that you graphed in Figure 1 commonly called?
b) Which species community measure did you plot on the y-axis of the graph?
c) What percentage of the total individuals did you have to sample before you identified all of the species in your study area?
d) How many quadrats did you have to sample before you identified all of the species in your study area?
Question
Refer to the table and the figure.
Table 1
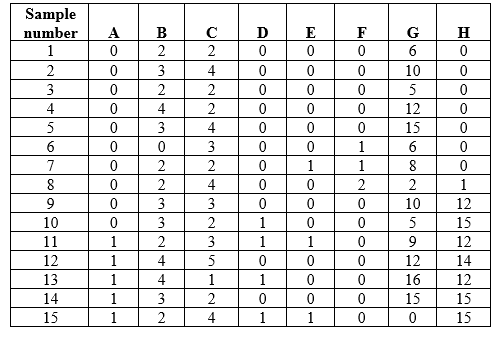 Figure 2
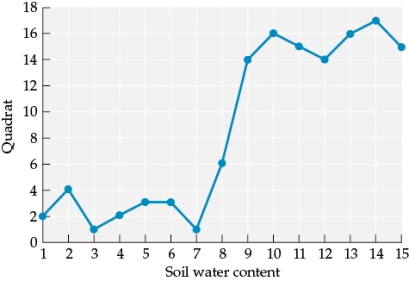 Suppose you are researching an ecological community in a new study area. You divide your study area into quadrats and sample one quadrat a day to determine the species that occupy the area and how many individuals of these species are present. Assume that by the end of your sampling efforts, you have identified all of the species that occur in the study area. Suppose that in addition to finding individuals and identifying species, you also collect information on abiotic factors and environmental conditions in the study area. Figure 2 shows how abiotic factors vary across the quadrats sampled. Based on your samples of the numbers of individuals of each species that occur in these quadrats (Table 1), which species is most affected by quadrat-level differences in soil water content? Based on both Table 1 and Figure 2, how would you define communities and determine the number of communities in your study area? How might this information influence how you categorize your quadrats into communities?
Table 1
Figure 2 Suppose you are researching an ecological community in a new study area. You divide your study area into quadrats and sample one quadrat a day to determine the species that occupy the area and how many individuals of these species are present. Assume that by the end of your sampling efforts, you have identified all of the species that occur in the study area. Suppose that in addition to finding individuals and identifying species, you also collect information on abiotic factors and environmental conditions in the study area. Figure 2 shows how abiotic factors vary across the quadrats sampled. Based on your samples of the numbers of individuals of each species that occur in these quadrats (Table 1), which species is most affected by quadrat-level differences in soil water content? Based on both Table 1 and Figure 2, how would you define communities and determine the number of communities in your study area? How might this information influence how you categorize your quadrats into communities? Question
Refer to the table.
Table 3: Species Abundance in Different Communities
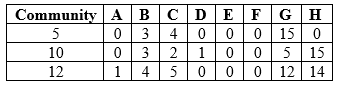 Suppose you are researching an ecological community in a new study area. You divide your study area into quadrats and sample one quadrat a day to determine the species that occupy the area and how many individuals of these species are present. Assume that by the end of your sampling efforts, you have identified all of the species that occur in the study area. Assume that each quadrat sample now reflects a separate community. Focus on samples in quadrats 5, 10, and 12, which will now be referred to as community 5, community 10, and community 12, respectively. Refer to abundances of species A-H shown in Table 3 for each of the three communities and use the data to determine the proportions of species present in different communities to answer the following questions:
a) Quantify the proportion of species present in a new table (this will be referred to as Table 4).
b) Use the data from Table 4 to determine the abundance rank of each species, where a rank of 1 is the most abundant species. Create a new table (this will be referred to as Table 5) showing this data.
c) Based on the proportional abundance and abundance rank of each species use the data in Tables 4 and 5 to graph the proportional abundance of each species as a function of abundance rank for each community. Graph your data as a line graph (this will be referred to as Figure 3).
Table 3: Species Abundance in Different Communities
Suppose you are researching an ecological community in a new study area. You divide your study area into quadrats and sample one quadrat a day to determine the species that occupy the area and how many individuals of these species are present. Assume that by the end of your sampling efforts, you have identified all of the species that occur in the study area. Assume that each quadrat sample now reflects a separate community. Focus on samples in quadrats 5, 10, and 12, which will now be referred to as community 5, community 10, and community 12, respectively. Refer to abundances of species A-H shown in Table 3 for each of the three communities and use the data to determine the proportions of species present in different communities to answer the following questions:a) Quantify the proportion of species present in a new table (this will be referred to as Table 4).
b) Use the data from Table 4 to determine the abundance rank of each species, where a rank of 1 is the most abundant species. Create a new table (this will be referred to as Table 5) showing this data.
c) Based on the proportional abundance and abundance rank of each species use the data in Tables 4 and 5 to graph the proportional abundance of each species as a function of abundance rank for each community. Graph your data as a line graph (this will be referred to as Figure 3).
Question
Refer to the tables and the figure.
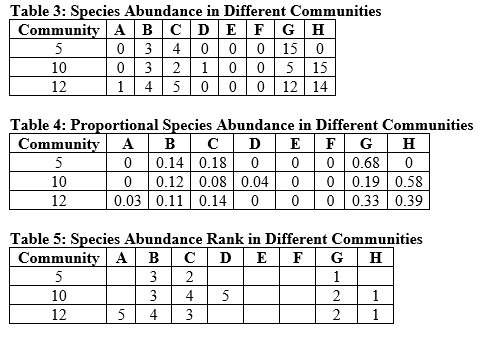 Figure 3
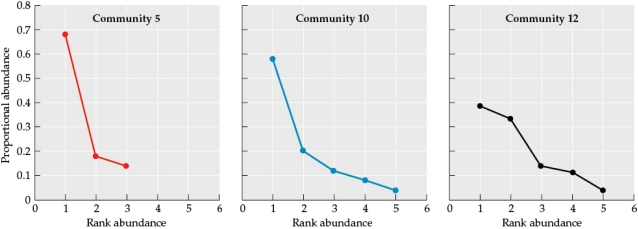 Suppose you are researching an ecological community in a new study area. You divide your study area into quadrats and sample one quadrat a day to determine the species that occupy the area and how many individuals of these species are present. Assume that by the end of your sampling efforts, you have identified all of the species that occur in the study area. Use Tables 3, 4, and 5 as well as Figure 3 to answer the following questions:
a) Which species is most common in each community?
b) Which species is the rarest in each community?
c) Are the same species always common and always rare, or is there variation?
d) How are communities 5 and 10 similar? How do they differ? Consider species composition, proportion, abundance, and richness in your answer.
e) How are communities 10 and 12 similar? How do they differ? Consider species composition, abundance, and richness in your answer.
Figure 3 Suppose you are researching an ecological community in a new study area. You divide your study area into quadrats and sample one quadrat a day to determine the species that occupy the area and how many individuals of these species are present. Assume that by the end of your sampling efforts, you have identified all of the species that occur in the study area. Use Tables 3, 4, and 5 as well as Figure 3 to answer the following questions:a) Which species is most common in each community?
b) Which species is the rarest in each community?
c) Are the same species always common and always rare, or is there variation?
d) How are communities 5 and 10 similar? How do they differ? Consider species composition, proportion, abundance, and richness in your answer.
e) How are communities 10 and 12 similar? How do they differ? Consider species composition, abundance, and richness in your answer.
Question
Refer to the table and figure.
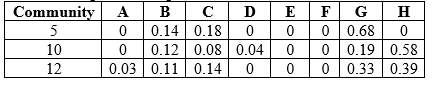 Figure 3
 Suppose you are researching an ecological community in a new study area. You divide your study area into quadrats and sample one quadrat a day to determine the species that occupy the area and how many individuals of these species are present. Assume that by the end of your sampling efforts, you have identified all of the species that occur in the study area. Use the proportional abundances of species that you calculated and graphed in Table 4 and Figure 3 to answer the following questions:
a) How are the roles of foundational species and keystone species defined? What are the similarities and differences in terms of how each functions in its community?
b) Based on just the abundance data in Table 4, create a new table (this will be referred to as Table 6) showing all of the species that could be considered foundational species or keystone species in each community.
c) What two types of additional information would you need to determine whether these species were indeed foundational species or keystone species? How could you obtain this information? Based on the definitions of foundational and keystone species, how would you use this information to determine whether the species were foundational or keystone species?
Figure 3 Suppose you are researching an ecological community in a new study area. You divide your study area into quadrats and sample one quadrat a day to determine the species that occupy the area and how many individuals of these species are present. Assume that by the end of your sampling efforts, you have identified all of the species that occur in the study area. Use the proportional abundances of species that you calculated and graphed in Table 4 and Figure 3 to answer the following questions:a) How are the roles of foundational species and keystone species defined? What are the similarities and differences in terms of how each functions in its community?
b) Based on just the abundance data in Table 4, create a new table (this will be referred to as Table 6) showing all of the species that could be considered foundational species or keystone species in each community.
c) What two types of additional information would you need to determine whether these species were indeed foundational species or keystone species? How could you obtain this information? Based on the definitions of foundational and keystone species, how would you use this information to determine whether the species were foundational or keystone species?
Question
Refer to the tables.
 Suppose you are researching an ecological community in a new study area. You divide your study area into quadrats and sample one quadrat a day to determine the species that occupy the area and how many individuals of these species are present. Assume that by the end of your sampling efforts, you have identified all of the species that occur in the study area. Now suppose that species H is an invasive species and that the samples listed in Table 1 show the presence and abundance of species in the same area across 15 years of study. Examine the patterns and impact of the invasion of species H on this community by answering the following questions:
a) Based on Table 1, in which year did species H invade the community?
b) Based on Table 1, when did populations of species H begin to grow?
c) By the end of your study period (in year 15), how does the proportional abundance of species H compare to that of other species in the community?
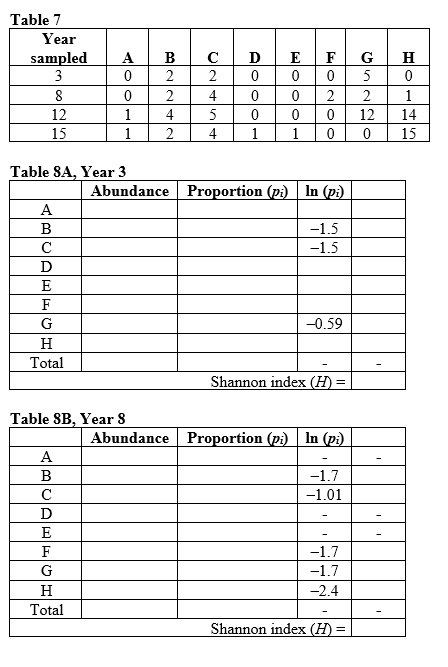
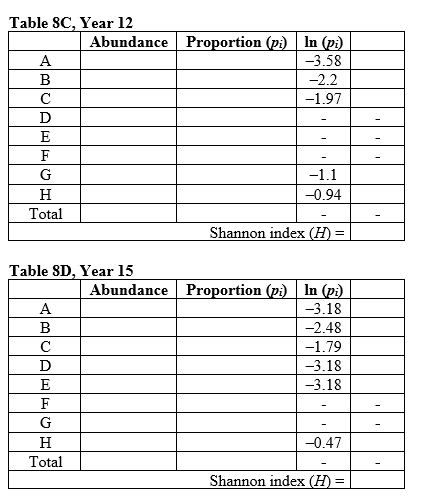
d) Calculate species richness and diversity for years 3, 8, 12, and 15 based on the data in Table 7. Calculate the Shannon index of species diversity, using Table 8 (supplied) to enter your data to create a new table (these will be referred to as Table 8A, Year 3; 8B, Year 8; 8C Year 12; and 8D, Year 15).
Suppose you are researching an ecological community in a new study area. You divide your study area into quadrats and sample one quadrat a day to determine the species that occupy the area and how many individuals of these species are present. Assume that by the end of your sampling efforts, you have identified all of the species that occur in the study area. Now suppose that species H is an invasive species and that the samples listed in Table 1 show the presence and abundance of species in the same area across 15 years of study. Examine the patterns and impact of the invasion of species H on this community by answering the following questions:a) Based on Table 1, in which year did species H invade the community?
b) Based on Table 1, when did populations of species H begin to grow?
c) By the end of your study period (in year 15), how does the proportional abundance of species H compare to that of other species in the community?
d) Calculate species richness and diversity for years 3, 8, 12, and 15 based on the data in Table 7. Calculate the Shannon index of species diversity, using Table 8 (supplied) to enter your data to create a new table (these will be referred to as Table 8A, Year 3; 8B, Year 8; 8C Year 12; and 8D, Year 15).
Question
Refer to the table.
Table 9
 Suppose you are researching an ecological community in a new study area. You divide your study area into quadrats and sample one quadrat a day to determine the species that occupy the area and how many individuals of these species are present. Assume that by the end of your sampling efforts, you have identified all of the species that occur in the study area. Use the data in Table 9 to answer the following questions:
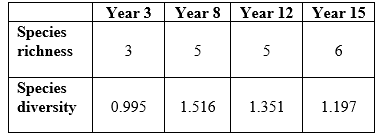
a) Create a graph (this will be referred to as Figure 4) of species richness and species diversity over the study years.
b) When was species richness lowest, and when was it highest? When was species diversity lowest, and when was it highest?
c) What is the effect of invasive species H on community structure in year 3 compared to year 8?
d) What is the overall impact of invasive species H on the species richness and species diversity of this community?
Table 9
Suppose you are researching an ecological community in a new study area. You divide your study area into quadrats and sample one quadrat a day to determine the species that occupy the area and how many individuals of these species are present. Assume that by the end of your sampling efforts, you have identified all of the species that occur in the study area. Use the data in Table 9 to answer the following questions:a) Create a graph (this will be referred to as Figure 4) of species richness and species diversity over the study years.
b) When was species richness lowest, and when was it highest? When was species diversity lowest, and when was it highest?
c) What is the effect of invasive species H on community structure in year 3 compared to year 8?
d) What is the overall impact of invasive species H on the species richness and species diversity of this community?
Question
Refer to the table.
Table 10
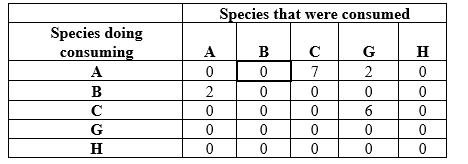 Suppose you are researching an ecological community in a new study area. You divide your study area into quadrats and sample one quadrat a day to determine the species that occupy the area and how many individuals of these species are present. Assume that by the end of your sampling efforts, you have identified all of the species that occur in the study area. You collect additional information on how biomass is transferred through your study system by determining the dietary components of each species during year 12 of your study. Table 10 shows the numbers of individuals that each other individual consumed during year 12. To read the data table, start at a species in column 1, read to the right across that row to find the number of individuals consumed, then read up to determine the species that it consumed. For example, species A consumed 0 individuals of species B (data cell outlined in bold). Refer to the data in Table 10 to understand the structure of the food web in the community in year 12.Answer the following questions:
a) Determine the composition of each species' diets and create a new table (this will be referred to as Table 11) with this data.
b) Create a food web for this system (this will be referred to as Figure 5).
c) Which species is(are) primary producer(s)?
d) Which species is(are) primary consumer(s)?
e) Which species is an omnivore?
Table 10
Suppose you are researching an ecological community in a new study area. You divide your study area into quadrats and sample one quadrat a day to determine the species that occupy the area and how many individuals of these species are present. Assume that by the end of your sampling efforts, you have identified all of the species that occur in the study area. You collect additional information on how biomass is transferred through your study system by determining the dietary components of each species during year 12 of your study. Table 10 shows the numbers of individuals that each other individual consumed during year 12. To read the data table, start at a species in column 1, read to the right across that row to find the number of individuals consumed, then read up to determine the species that it consumed. For example, species A consumed 0 individuals of species B (data cell outlined in bold). Refer to the data in Table 10 to understand the structure of the food web in the community in year 12.Answer the following questions:a) Determine the composition of each species' diets and create a new table (this will be referred to as Table 11) with this data.
b) Create a food web for this system (this will be referred to as Figure 5).
c) Which species is(are) primary producer(s)?
d) Which species is(are) primary consumer(s)?
e) Which species is an omnivore?
Question
Refer to the table and the figure.
Table 10
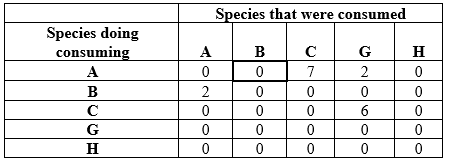 Figure 5
Food web in year 12
 Suppose you are researching an ecological community in a new study area. You divide your study area into quadrats and sample one quadrat a day to determine the species that occupy the area and how many individuals of these species are present. Assume that by the end of your sampling efforts, you have identified all of the species that occur in the study area. You collect additional information on how biomass is transferred through your study system by determining the dietary components of each species during year 12 of your study. Table 10 shows the numbers of individuals that each other individual consumed during year 12. To read the data table, start at a species in column 1, read to the right across that row to find the number of individuals consumed, then read up to determine the species that it consumed. For example, species A consumed 0 individuals of species B (data cell outlined in bold). Refer to the data in Table 10 to understand the structure of the food web in the community in year 12.Answer the following questions:
a) What role does species H play in the community in Year 12?
b) Based on Figure 5, how should the loss of species G impact community structure in year 15? Does this differ from the original observed data? What do you think caused the difference in the observed species composition for year 15, and what would you have predicted based on the food web data? If you collected data on the food web in year 15, what differences would you expect from the structure of the food web at year 12? What additional information would be needed to construct a complete food web at year 15?
Table 10
Figure 5Food web in year 12
Suppose you are researching an ecological community in a new study area. You divide your study area into quadrats and sample one quadrat a day to determine the species that occupy the area and how many individuals of these species are present. Assume that by the end of your sampling efforts, you have identified all of the species that occur in the study area. You collect additional information on how biomass is transferred through your study system by determining the dietary components of each species during year 12 of your study. Table 10 shows the numbers of individuals that each other individual consumed during year 12. To read the data table, start at a species in column 1, read to the right across that row to find the number of individuals consumed, then read up to determine the species that it consumed. For example, species A consumed 0 individuals of species B (data cell outlined in bold). Refer to the data in Table 10 to understand the structure of the food web in the community in year 12.Answer the following questions:a) What role does species H play in the community in Year 12?
b) Based on Figure 5, how should the loss of species G impact community structure in year 15? Does this differ from the original observed data? What do you think caused the difference in the observed species composition for year 15, and what would you have predicted based on the food web data? If you collected data on the food web in year 15, what differences would you expect from the structure of the food web at year 12? What additional information would be needed to construct a complete food web at year 15?
Question
Question
Question
Question
Question
Refer to the figure.
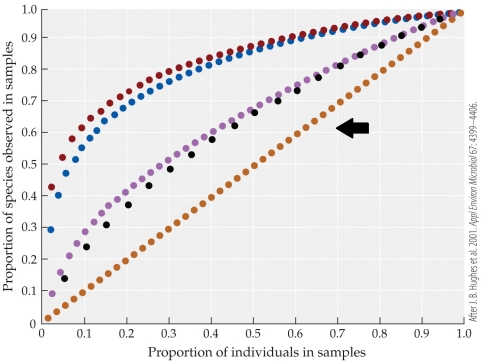 The figure is of a species accumulation curve, based on the studies of Hughes and colleagues. The orange line (indicated by the black arrow) represents the species accumulation curve for which community in the study?
A) Plants in a temperate forest in Michigan
B) Human oral bacteria
C) Costa Rica moth species
D) East Amazonian soil bacteria
The figure is of a species accumulation curve, based on the studies of Hughes and colleagues. The orange line (indicated by the black arrow) represents the species accumulation curve for which community in the study?A) Plants in a temperate forest in Michigan
B) Human oral bacteria
C) Costa Rica moth species
D) East Amazonian soil bacteria
Question
Question
Question
Question
Question
Question
Question
Question
Question
Question

Unlock Deck
Sign up to unlock the cards in this deck!
Unlock Deck
Unlock Deck
1/71
Play
Full screen (f)
Deck 16: The Nature of Communities
1
Which statement about the "killer alga," Caulerpa taxifolia, is false?
A) It was unintentionally released into the Mediterranean by the Oceanographic Museum of Monaco.
B) Its invasive range extends at least as far as Spain on the west and Croatia on the east.
C) It is toxic to humans and other mammals.
D) It has evolved cold resistance.
A) It was unintentionally released into the Mediterranean by the Oceanographic Museum of Monaco.
B) Its invasive range extends at least as far as Spain on the west and Croatia on the east.
C) It is toxic to humans and other mammals.
D) It has evolved cold resistance.
C
2
Ecologists are concerned about the establishment of invasive species in new areas because invasive species
A) can have large ecological effects in their new communities.
B) that become established are easy to control.
C) are often toxic.
D) always cause a decline in biological diversity of the communities they invade.
A) can have large ecological effects in their new communities.
B) that become established are easy to control.
C) are often toxic.
D) always cause a decline in biological diversity of the communities they invade.
A
3
Which statement best describes the difference between the theoretical concept of a community and the ways in which communities are delineated in practice?
A) In theory, a community is defined only by abiotic factors of the area; in practice, communities are delineated by biological attributes as well.
B) In theory, communities consist of all species present; in practice, biologists usually study only a subset of the species.
C) In theory, communities can be defined by physical or biological characteristics, but in practice, these characteristics are difficult to measure and are not used.
D) There is no difference between the theoretical concept of a community and how it is defined in practice.
B
4
Members of the same functional group must belong to the same
A) guild.
B) trophic level.
C) taxonomic group.
D) None of the above
A) guild.
B) trophic level.
C) taxonomic group.
D) None of the above
Unlock Deck
Unlock for access to all 71 flashcards in this deck.
Unlock Deck
k this deck
5
If a biologist wanted to study a hot spring community and were to sample the bacterial species causing its various colors, this would be an example of what type of subset?
A) Taxonomic
B) Guild
C) Functional
D) None of the above
A) Taxonomic
B) Guild
C) Functional
D) None of the above
Unlock Deck
Unlock for access to all 71 flashcards in this deck.
Unlock Deck
k this deck
6
Which value can be measured the most easily?
A) Species richness
B) Species evenness
C) Species diversity
D) Species evenness and species richness are equally easy to measure.
A) Species richness
B) Species evenness
C) Species diversity
D) Species evenness and species richness are equally easy to measure.
Unlock Deck
Unlock for access to all 71 flashcards in this deck.
Unlock Deck
k this deck
7
What is the primary difference between interaction webs and food webs?
A) Interaction webs include more trophic levels.
B) Interaction webs include fewer trophic levels.
C) Interaction webs do not consider primary producers, where food webs do.
D) Interaction webs include non-trophic interactions, where food webs do not.
A) Interaction webs include more trophic levels.
B) Interaction webs include fewer trophic levels.
C) Interaction webs do not consider primary producers, where food webs do.
D) Interaction webs include non-trophic interactions, where food webs do not.
Unlock Deck
Unlock for access to all 71 flashcards in this deck.
Unlock Deck
k this deck
8
Species that feed on more than one trophic level are called
A) tertiary consumers.
B) herbivores.
C) omnivores.
D) primary producers.
A) tertiary consumers.
B) herbivores.
C) omnivores.
D) primary producers.
Unlock Deck
Unlock for access to all 71 flashcards in this deck.
Unlock Deck
k this deck
9
Refer to the figure.
Considering the food web, imagine a circumstance where a new, mutually beneficial relationship develops between H2 and H3, increasing both of their numbers. The effects of this on P2 and C2 are best described as
A) a direct negative effect on P2 and a trophic facilitation effect on C2.
B) an indirect positive effect on P2 and a direct negative effect on C2.
C) a trophic facilitation effect on both C2 and P2.
D) a direct negative effect on both C2 and P2.
Considering the food web, imagine a circumstance where a new, mutually beneficial relationship develops between H2 and H3, increasing both of their numbers. The effects of this on P2 and C2 are best described asA) a direct negative effect on P2 and a trophic facilitation effect on C2.
B) an indirect positive effect on P2 and a direct negative effect on C2.
C) a trophic facilitation effect on both C2 and P2.
D) a direct negative effect on both C2 and P2.
Unlock Deck
Unlock for access to all 71 flashcards in this deck.
Unlock Deck
k this deck
10
Lions prey on animals such as zebras and wildebeest, which feed primarily on grasses. Thus, lions should be considered
A) primary consumers.
B) herbivores.
C) secondary consumers.
D) tertiary consumers
A) primary consumers.
B) herbivores.
C) secondary consumers.
D) tertiary consumers
Unlock Deck
Unlock for access to all 71 flashcards in this deck.
Unlock Deck
k this deck
11
Which statement about food webs is true?
A) Most food webs do not include information about symbiotic relationships.
B) All species occupy only a single trophic level in a food web.
C) Food webs generally provide information about the strengths of interactions across trophic levels.
D) Food webs provide information about trophic and non-trophic interactions.
Unlock Deck
Unlock for access to all 71 flashcards in this deck.
Unlock Deck
k this deck
12
Refer to the figure.
-Which web(s) in the figure is(are) an interaction web?
A) Web I
B) Web II
C) Web III
D) Web II and Web III
-Which web(s) in the figure is(are) an interaction web?
A) Web I
B) Web II
C) Web III
D) Web II and Web III
Unlock Deck
Unlock for access to all 71 flashcards in this deck.
Unlock Deck
k this deck
13
Refer to the figure.
- Which species in the figure is an omnivore?
A) Species A
B) Species B
C) Species C
D) Species D
- Which species in the figure is an omnivore?
A) Species A
B) Species B
C) Species C
D) Species D
Unlock Deck
Unlock for access to all 71 flashcards in this deck.
Unlock Deck
k this deck
14
Refer to the figure.
- Which species in the figure is a primary producer?
A) Species A
B) Species B
C) Species C
D) Species E
- Which species in the figure is a primary producer?
A) Species A
B) Species B
C) Species C
D) Species E
Unlock Deck
Unlock for access to all 71 flashcards in this deck.
Unlock Deck
k this deck
15
Refer to the figure.
-According to the figure, species A is a(n)
A) primary producer.
B) herbivore.
C) carnivore.
D) omnivore.
-According to the figure, species A is a(n)
A) primary producer.
B) herbivore.
C) carnivore.
D) omnivore.
Unlock Deck
Unlock for access to all 71 flashcards in this deck.
Unlock Deck
k this deck
16
How many total trophic levels are present in a food web in which the top trophic level consists of secondary consumers? (Do not consider decomposers or omnivores.)
A) 2
B) 3
C) 4
D) 5
A) 2
B) 3
C) 4
D) 5
Unlock Deck
Unlock for access to all 71 flashcards in this deck.
Unlock Deck
k this deck
17
The Shannon index is a measure of
A) interaction strength.
B) species richness alone.
C) species diversity.
D) the extent of trophic facilitation.
A) interaction strength.
B) species richness alone.
C) species diversity.
D) the extent of trophic facilitation.
Unlock Deck
Unlock for access to all 71 flashcards in this deck.
Unlock Deck
k this deck
18
Refer to the tables.
A) Community 1 > Community 2 > Community 3
B) Community 1 > Community 3 > Community 2
C) Community 2 > Community 1 > Community 3
D) Community 3 > Community 2 > Community 1
A) Community 1 > Community 2 > Community 3
B) Community 1 > Community 3 > Community 2
C) Community 2 > Community 1 > Community 3
D) Community 3 > Community 2 > Community 1
Unlock Deck
Unlock for access to all 71 flashcards in this deck.
Unlock Deck
k this deck
19
Refer to the tables.
A) 1.000
B) 1.094
C) 1.191
D) 6.519
A) 1.000
B) 1.094
C) 1.191
D) 6.519
Unlock Deck
Unlock for access to all 71 flashcards in this deck.
Unlock Deck
k this deck
20
Refer to the table.
A) ‒[0.48 (ln 0.48) + 0.32 (ln 0.32) + 0.12 (ln 0.12)]
B) ‒[0.48 (ln 0.48) + 0.32 (ln 0.32) + 0.2 (ln 0.2)]
C) 0.48 (ln 0.48) + 0.32 (ln 0.32) + 0.12 (ln 0.12)
D) 0.48 (ln 0.48) + 0.32 (ln 0.32) + 0.2 (ln 0.2)
A) ‒[0.48 (ln 0.48) + 0.32 (ln 0.32) + 0.12 (ln 0.12)]
B) ‒[0.48 (ln 0.48) + 0.32 (ln 0.32) + 0.2 (ln 0.2)]
C) 0.48 (ln 0.48) + 0.32 (ln 0.32) + 0.12 (ln 0.12)
D) 0.48 (ln 0.48) + 0.32 (ln 0.32) + 0.2 (ln 0.2)
Unlock Deck
Unlock for access to all 71 flashcards in this deck.
Unlock Deck
k this deck
21
What is the Shannon index value for an area in which only a single species is present?
A) 0
B) 1
C) ‒1
D) Infinity
A) 0
B) 1
C) ‒1
D) Infinity
Unlock Deck
Unlock for access to all 71 flashcards in this deck.
Unlock Deck
k this deck
22
Four species of fish in a pond are found in equal abundance. The Shannon index of the fish community is therefore
A) -1 [4 (ln 4)].
B) -4 [0.25 (ln 0.25)].
C) -0.25 [0.25 (ln 4)].
D) -0.25 (ln 0.25).
A) -1 [4 (ln 4)].
B) -4 [0.25 (ln 0.25)].
C) -0.25 [0.25 (ln 4)].
D) -0.25 (ln 0.25).
Unlock Deck
Unlock for access to all 71 flashcards in this deck.
Unlock Deck
k this deck
23
Suppose you wanted to determine whether you had adequately sampled the species richness of a given community. Which result would lead most strongly to the conclusion that the current sampling had adequately assessed the species diversity?
A) A high Shannon index value
B) A low Shannon index value
C) A linear species accumulation curve
D) A species accumulation curve that leveled off
A) A high Shannon index value
B) A low Shannon index value
C) A linear species accumulation curve
D) A species accumulation curve that leveled off
Unlock Deck
Unlock for access to all 71 flashcards in this deck.
Unlock Deck
k this deck
24
In the study by Jennifer Hughes and colleagues, in which community did it appear that the species richness had been adequately sampled?
A) A plant community from a forest in Michigan
B) East Amazonian soil bacteria
C) Human oral bacteria
D) Costa Rican moths
A) A plant community from a forest in Michigan
B) East Amazonian soil bacteria
C) Human oral bacteria
D) Costa Rican moths
Unlock Deck
Unlock for access to all 71 flashcards in this deck.
Unlock Deck
k this deck
25
Which statement describes a limitation of a species accumulation curve in terms of its ability to determine whether species diversity has been adequately sampled?
A) It can be used only for a community of large spatial scale.
B) It can be used only for a community of small spatial scale.
C) It assumes that the sampling methods are consistent throughout the study.
D) It assumes a high Shannon index.
A) It can be used only for a community of large spatial scale.
B) It can be used only for a community of small spatial scale.
C) It assumes that the sampling methods are consistent throughout the study.
D) It assumes a high Shannon index.
Unlock Deck
Unlock for access to all 71 flashcards in this deck.
Unlock Deck
k this deck
26
Which of the following example emphasizes the importance of species composition?
A) Knowing that there are seven tree species in a particular forest
B) Determining that a particular forest is dominated by one or two species
C) Understanding the influence of the loss of a species of trees on a particular forest
D) Measuring the total abundance of all tree species in a forest
A) Knowing that there are seven tree species in a particular forest
B) Determining that a particular forest is dominated by one or two species
C) Understanding the influence of the loss of a species of trees on a particular forest
D) Measuring the total abundance of all tree species in a forest
Unlock Deck
Unlock for access to all 71 flashcards in this deck.
Unlock Deck
k this deck
27
Cougars prey on both white-tailed deer and mule deer. Because of their shared predator, each deer's species abundance is affected by the presence of the other deer species. The white-tailed and mule deer are engaged in a(n)
A) direct interaction.
B) indirect interaction.
C) trophic facilitation.
D) predator-prey relationship.
A) direct interaction.
B) indirect interaction.
C) trophic facilitation.
D) predator-prey relationship.
Unlock Deck
Unlock for access to all 71 flashcards in this deck.
Unlock Deck
k this deck
28
Cougars prey on both white-tailed deer and mule deer. Because of their shared predator, each deer's species abundance is affected by the presence of the other deer species. The cougar and the mule deer are engaged in a(n)
A) direct interaction.
B) indirect interaction.
C) trophic facilitation.
D) trophic cascade.
A) direct interaction.
B) indirect interaction.
C) trophic facilitation.
D) trophic cascade.
Unlock Deck
Unlock for access to all 71 flashcards in this deck.
Unlock Deck
k this deck
29
Refer to the figure.
-Research has suggested that in some cases, killer whales (Orcinus orca) have increased their predation on sea otters. This would have a(n) _______ effect on kelp.
A) direct positive
B) direct negative
C) indirect positive
D) indirect negative
-Research has suggested that in some cases, killer whales (Orcinus orca) have increased their predation on sea otters. This would have a(n) _______ effect on kelp.
A) direct positive
B) direct negative
C) indirect positive
D) indirect negative
Unlock Deck
Unlock for access to all 71 flashcards in this deck.
Unlock Deck
k this deck
30
Refer to the figure.
- If another predator were to begin competing with sea otters for the urchins, they would have a(n) _______ effect on otters and a(n) _______ effect on urchins.
A) direct negative; direct positive
B) direct negative; direct negative
C) direct negative; indirect negative
D) direct positive; direct negative
Unlock Deck
Unlock for access to all 71 flashcards in this deck.
Unlock Deck
k this deck
31
Refer to the figure.
Considering the figure, which of the following scenarios would be best described as trophic facilitation?
A) A wolf feeding on deer assists aspen trees in regeneration
B) Ravens, eagles, and vultures consuming an elk carcass left behind by the wolves that made the kill
C) Two species of squirrel each consuming the same type of nut, resulting in reduced numbers of germinating seeds
D) Three species of birds that directly compete with each other for similar resources, with no one species dominating any other
Considering the figure, which of the following scenarios would be best described as trophic facilitation?A) A wolf feeding on deer assists aspen trees in regeneration
B) Ravens, eagles, and vultures consuming an elk carcass left behind by the wolves that made the kill
C) Two species of squirrel each consuming the same type of nut, resulting in reduced numbers of germinating seeds
D) Three species of birds that directly compete with each other for similar resources, with no one species dominating any other
Unlock Deck
Unlock for access to all 71 flashcards in this deck.
Unlock Deck
k this deck
32
The presence of a mutualist spider in a certain area improves the survival of an herbaceous shrub by reducing the impact of herbivorous insects. These spiders are preyed on by lizards, and lizards are eaten by birds. The removal of birds from the area would most likely have a(n) _______ effect on spiders and a(n) _______ effect on the plant.
A) indirect positive; indirect positive
B) indirect negative; indirect positive
C) direct negative; direct negative
D) indirect negative; indirect negative
A) indirect positive; indirect positive
B) indirect negative; indirect positive
C) direct negative; direct negative
D) indirect negative; indirect negative
Unlock Deck
Unlock for access to all 71 flashcards in this deck.
Unlock Deck
k this deck
33
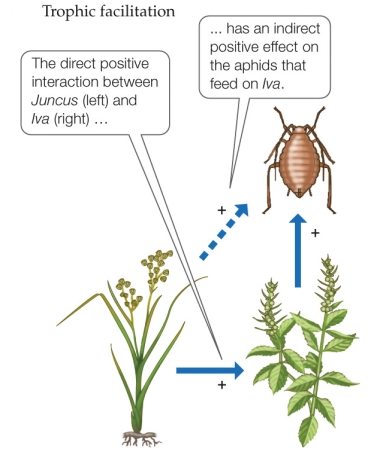
In their studies of a salt marsh community, Sally Hacker and colleagues found that removing _______ led to a(n) _______.
A) Juncus; increase in the abundance of Iva
B) Iva; increase in the abundance of Juncus
C) Juncus; increase in the abundance of aphids through indirect effects
D) Juncus; decrease in the abundance of aphids through indirect effects
A) Juncus; increase in the abundance of Iva
B) Iva; increase in the abundance of Juncus
C) Juncus; increase in the abundance of aphids through indirect effects
D) Juncus; decrease in the abundance of aphids through indirect effects
Unlock Deck
Unlock for access to all 71 flashcards in this deck.
Unlock Deck
k this deck
34
Which statement about the difference between a competitive network and a competitive hierarchy is true?
A) A competitive network comprises more species than interaction networks.
B) In a competitive hierarchy, one species dominates the interaction; in an interaction network, no one species dominates the interaction.
C) The interactions are stronger in a competitive network than in interaction networks.
D) In a competitive hierarchy, indirect species interactions always buffer strong competition; in interaction networks, they do not.
Unlock Deck
Unlock for access to all 71 flashcards in this deck.
Unlock Deck
k this deck
35
Which conclusion was the primary finding of Buss and Jackson's study of coral-associated invertebrates and algae in Jamaica?
A) Competitive networks can be circular.
B) Environmental context can change the outcome of species interactions.
C) Diversity is maintained due to the existence of keystone species.
D) Species diversity estimates vary with sampling effort.
A) Competitive networks can be circular.
B) Environmental context can change the outcome of species interactions.
C) Diversity is maintained due to the existence of keystone species.
D) Species diversity estimates vary with sampling effort.
Unlock Deck
Unlock for access to all 71 flashcards in this deck.
Unlock Deck
k this deck
36
Menge and colleagues performed experiments in which they exposed some populations of mussels to sea stars and excluded sea stars from other mussel populations. Suppose two populations of mussels are the same size prior to treatment, and after treatment there are 600 mussels in the treatment without sea stars and 200 mussels in the treatment with sea stars. Suppose further that the sea star population consists of 10 individuals. What is the per capita interaction strength of sea stars on mussels?
A) ln (3/10)
B) (ln 600)/(ln 200)
C) ln (0.33/10)
D) ln (0.33/200)
A) ln (3/10)
B) (ln 600)/(ln 200)
C) ln (0.33/10)
D) ln (0.33/200)
Unlock Deck
Unlock for access to all 71 flashcards in this deck.
Unlock Deck
k this deck
37
Suppose two populations of Anolis lizards are of equal size at the beginning of an experiment. One population (the experimental group) is exposed to a predator (16 predatory lizards), and the other (the control) is not. The final size of the experimental population is 50, and the final size of the control population is 200. What is the per capita interaction strength of predatory lizards on Anolis lizards?
A) ln (4/16)
B) ln (4/50)
C) ln (16/4)
D) ln (16/50)
A) ln (4/16)
B) ln (4/50)
C) ln (16/4)
D) ln (16/50)
Unlock Deck
Unlock for access to all 71 flashcards in this deck.
Unlock Deck
k this deck
38
When wolves were returned to Yellowstone National Park in 1995, some of the effects noted were increasing levels of berries available to black bears, stabilization of stream banks, increased nesting habitat for birds, and increasing beaver numbers as a result of rejuvenating aspen trees. These were later determined to be the results of reduced numbers and altered feeding behavior of elk as they were preyed upon by the wolves. Given this information, which of the following best describes wolves in Yellowstone National Park?
A) They are a primary consumer.
B) They are an ecosystem engineer.
C) They are a foundation species.
D) They are a keystone species.
A) They are a primary consumer.
B) They are an ecosystem engineer.
C) They are a foundation species.
D) They are a keystone species.
Unlock Deck
Unlock for access to all 71 flashcards in this deck.
Unlock Deck
k this deck
39
Refer to the figure.
- Where would a keystone species most likely be located in the figure?
A) Position A
B) Position B
C) Position D
D) Position E
- Where would a keystone species most likely be located in the figure?
A) Position A
B) Position B
C) Position D
D) Position E
Unlock Deck
Unlock for access to all 71 flashcards in this deck.
Unlock Deck
k this deck
40
Refer to the figure.
- Where would a foundation species most likely be located in the figure?
A) Position A
B) Position B
C) Position C
D) Position D
- Where would a foundation species most likely be located in the figure?
A) Position A
B) Position B
C) Position C
D) Position D
Unlock Deck
Unlock for access to all 71 flashcards in this deck.
Unlock Deck
k this deck
41
Which statement about keystone predators is true?
A) They usually are abundant in number and/or have disproportionately high biomass.
B) They usually influence primary producers directly.
C) They usually influence primary producers indirectly.
D) They are the same as foundation species.
A) They usually are abundant in number and/or have disproportionately high biomass.
B) They usually influence primary producers directly.
C) They usually influence primary producers indirectly.
D) They are the same as foundation species.
Unlock Deck
Unlock for access to all 71 flashcards in this deck.
Unlock Deck
k this deck
42
Which statement about the studies by Mary Power and colleagues on California rivers is true?
A) In drought years the number of trophic levels increased.
B) Species, such as the steelhead, that are keystone predators during normal years are minor players in the food web during drought years.
C) The alga Cladophora completely died out during droughts.
D) Species interactions remained constant despite changes in environmental conditions.
Unlock Deck
Unlock for access to all 71 flashcards in this deck.
Unlock Deck
k this deck
43
Estimates show that oceans absorb about _______ of all the atmospheric CO2.
A) 1%
B) 10%
C) 40%
D) 48%
A) 1%
B) 10%
C) 40%
D) 48%
Unlock Deck
Unlock for access to all 71 flashcards in this deck.
Unlock Deck
k this deck
44
Alsterberg and colleagues showed that with ocean acidification and warming, the biomass of benthic microalgae declined in the absence of omnivores. This was the result of increased negative interactions with its macroalgal competitors and herbivores. Given this information, the relationship between the omnivores and benthic microalgae can best be described as a(n) _______ interaction.
A) direct mutualist
B) indirect mutualist
C) direct commensal
D) indirect commensal
A) direct mutualist
B) indirect mutualist
C) direct commensal
D) indirect commensal
Unlock Deck
Unlock for access to all 71 flashcards in this deck.
Unlock Deck
k this deck
45
Which technique was used to determine the source of the alga Caulerpa taxifolia that invaded the coast of California?
A) Fluorescent dyes
B) Electron microscopy
C) Analysis of DNA sequences
D) Magnetic resonance imaging
A) Fluorescent dyes
B) Electron microscopy
C) Analysis of DNA sequences
D) Magnetic resonance imaging
Unlock Deck
Unlock for access to all 71 flashcards in this deck.
Unlock Deck
k this deck
46
Refer to the table.
Table 1
Suppose you are researching an ecological community in a new study area. You divide your study area into quadrats and sample one quadrat a day to determine the species that occupy the area and how many individuals of these species are present. Assume that by the end of your sampling efforts, you have identified all of the species that occur in the study area. Table 1 shows the data collected for each sample for species A-H and indicates the number of individuals of each species identified in each quadrat. Use the table to investigate the pattern of species discoveries in your data. Then, create a new data table (this will be referred to as Table 2) that reflects the number of new species discovered as a function of the number of samples. Include the number of new species observed in each sample and the total number of species discovered over the course of your sampling.
Table 1
Suppose you are researching an ecological community in a new study area. You divide your study area into quadrats and sample one quadrat a day to determine the species that occupy the area and how many individuals of these species are present. Assume that by the end of your sampling efforts, you have identified all of the species that occur in the study area. Table 1 shows the data collected for each sample for species A-H and indicates the number of individuals of each species identified in each quadrat. Use the table to investigate the pattern of species discoveries in your data. Then, create a new data table (this will be referred to as Table 2) that reflects the number of new species discovered as a function of the number of samples. Include the number of new species observed in each sample and the total number of species discovered over the course of your sampling. Unlock Deck
Unlock for access to all 71 flashcards in this deck.
Unlock Deck
k this deck
47
Refer to the tables.
Suppose you are researching an ecological community in a new study area. You divide your study area into quadrats and sample one quadrat a day to determine the species that occupy the area and how many individuals of these species are present. Assume that by the end of your sampling efforts, you have identified all of the species that occur in the study area. Use the numbers of individuals from Table 1 and the number of species in Table 2 to graph the relationship between total individuals and total species identified during your sampling efforts (this will be referred to as Figure 1). Graph your data as a line graph.
Suppose you are researching an ecological community in a new study area. You divide your study area into quadrats and sample one quadrat a day to determine the species that occupy the area and how many individuals of these species are present. Assume that by the end of your sampling efforts, you have identified all of the species that occur in the study area. Use the numbers of individuals from Table 1 and the number of species in Table 2 to graph the relationship between total individuals and total species identified during your sampling efforts (this will be referred to as Figure 1). Graph your data as a line graph. Unlock Deck
Unlock for access to all 71 flashcards in this deck.
Unlock Deck
k this deck
48
Refer to the tables and figure.
Figure 1
Suppose you are researching an ecological community in a new study area. You divide your study area into quadrats and sample one quadrat a day to determine the species that occupy the area and how many individuals of these species are present. Assume that by the end of your sampling efforts, you have identified all of the species that occur in the study area. Use Table 1, Table 2, and Figure 1 to answer the following questions:
a) In community ecology studies, what is the relationship that you graphed in Figure 1 commonly called?
b) Which species community measure did you plot on the y-axis of the graph?
c) What percentage of the total individuals did you have to sample before you identified all of the species in your study area?
d) How many quadrats did you have to sample before you identified all of the species in your study area?
Figure 1 Suppose you are researching an ecological community in a new study area. You divide your study area into quadrats and sample one quadrat a day to determine the species that occupy the area and how many individuals of these species are present. Assume that by the end of your sampling efforts, you have identified all of the species that occur in the study area. Use Table 1, Table 2, and Figure 1 to answer the following questions:a) In community ecology studies, what is the relationship that you graphed in Figure 1 commonly called?
b) Which species community measure did you plot on the y-axis of the graph?
c) What percentage of the total individuals did you have to sample before you identified all of the species in your study area?
d) How many quadrats did you have to sample before you identified all of the species in your study area?
Unlock Deck
Unlock for access to all 71 flashcards in this deck.
Unlock Deck
k this deck
49
Refer to the table and the figure.
Table 1
Figure 2
Suppose you are researching an ecological community in a new study area. You divide your study area into quadrats and sample one quadrat a day to determine the species that occupy the area and how many individuals of these species are present. Assume that by the end of your sampling efforts, you have identified all of the species that occur in the study area. Suppose that in addition to finding individuals and identifying species, you also collect information on abiotic factors and environmental conditions in the study area. Figure 2 shows how abiotic factors vary across the quadrats sampled. Based on your samples of the numbers of individuals of each species that occur in these quadrats (Table 1), which species is most affected by quadrat-level differences in soil water content? Based on both Table 1 and Figure 2, how would you define communities and determine the number of communities in your study area? How might this information influence how you categorize your quadrats into communities?
Table 1
Figure 2 Suppose you are researching an ecological community in a new study area. You divide your study area into quadrats and sample one quadrat a day to determine the species that occupy the area and how many individuals of these species are present. Assume that by the end of your sampling efforts, you have identified all of the species that occur in the study area. Suppose that in addition to finding individuals and identifying species, you also collect information on abiotic factors and environmental conditions in the study area. Figure 2 shows how abiotic factors vary across the quadrats sampled. Based on your samples of the numbers of individuals of each species that occur in these quadrats (Table 1), which species is most affected by quadrat-level differences in soil water content? Based on both Table 1 and Figure 2, how would you define communities and determine the number of communities in your study area? How might this information influence how you categorize your quadrats into communities? Unlock Deck
Unlock for access to all 71 flashcards in this deck.
Unlock Deck
k this deck
50
Refer to the table.
Table 3: Species Abundance in Different Communities
Suppose you are researching an ecological community in a new study area. You divide your study area into quadrats and sample one quadrat a day to determine the species that occupy the area and how many individuals of these species are present. Assume that by the end of your sampling efforts, you have identified all of the species that occur in the study area. Assume that each quadrat sample now reflects a separate community. Focus on samples in quadrats 5, 10, and 12, which will now be referred to as community 5, community 10, and community 12, respectively. Refer to abundances of species A-H shown in Table 3 for each of the three communities and use the data to determine the proportions of species present in different communities to answer the following questions:
a) Quantify the proportion of species present in a new table (this will be referred to as Table 4).
b) Use the data from Table 4 to determine the abundance rank of each species, where a rank of 1 is the most abundant species. Create a new table (this will be referred to as Table 5) showing this data.
c) Based on the proportional abundance and abundance rank of each species use the data in Tables 4 and 5 to graph the proportional abundance of each species as a function of abundance rank for each community. Graph your data as a line graph (this will be referred to as Figure 3).
Table 3: Species Abundance in Different Communities
Suppose you are researching an ecological community in a new study area. You divide your study area into quadrats and sample one quadrat a day to determine the species that occupy the area and how many individuals of these species are present. Assume that by the end of your sampling efforts, you have identified all of the species that occur in the study area. Assume that each quadrat sample now reflects a separate community. Focus on samples in quadrats 5, 10, and 12, which will now be referred to as community 5, community 10, and community 12, respectively. Refer to abundances of species A-H shown in Table 3 for each of the three communities and use the data to determine the proportions of species present in different communities to answer the following questions:a) Quantify the proportion of species present in a new table (this will be referred to as Table 4).
b) Use the data from Table 4 to determine the abundance rank of each species, where a rank of 1 is the most abundant species. Create a new table (this will be referred to as Table 5) showing this data.
c) Based on the proportional abundance and abundance rank of each species use the data in Tables 4 and 5 to graph the proportional abundance of each species as a function of abundance rank for each community. Graph your data as a line graph (this will be referred to as Figure 3).
Unlock Deck
Unlock for access to all 71 flashcards in this deck.
Unlock Deck
k this deck
51
Refer to the tables and the figure.
Figure 3
Suppose you are researching an ecological community in a new study area. You divide your study area into quadrats and sample one quadrat a day to determine the species that occupy the area and how many individuals of these species are present. Assume that by the end of your sampling efforts, you have identified all of the species that occur in the study area. Use Tables 3, 4, and 5 as well as Figure 3 to answer the following questions:
a) Which species is most common in each community?
b) Which species is the rarest in each community?
c) Are the same species always common and always rare, or is there variation?
d) How are communities 5 and 10 similar? How do they differ? Consider species composition, proportion, abundance, and richness in your answer.
e) How are communities 10 and 12 similar? How do they differ? Consider species composition, abundance, and richness in your answer.
Figure 3 Suppose you are researching an ecological community in a new study area. You divide your study area into quadrats and sample one quadrat a day to determine the species that occupy the area and how many individuals of these species are present. Assume that by the end of your sampling efforts, you have identified all of the species that occur in the study area. Use Tables 3, 4, and 5 as well as Figure 3 to answer the following questions:a) Which species is most common in each community?
b) Which species is the rarest in each community?
c) Are the same species always common and always rare, or is there variation?
d) How are communities 5 and 10 similar? How do they differ? Consider species composition, proportion, abundance, and richness in your answer.
e) How are communities 10 and 12 similar? How do they differ? Consider species composition, abundance, and richness in your answer.
Unlock Deck
Unlock for access to all 71 flashcards in this deck.
Unlock Deck
k this deck
52
Refer to the table and figure.
Figure 3
Suppose you are researching an ecological community in a new study area. You divide your study area into quadrats and sample one quadrat a day to determine the species that occupy the area and how many individuals of these species are present. Assume that by the end of your sampling efforts, you have identified all of the species that occur in the study area. Use the proportional abundances of species that you calculated and graphed in Table 4 and Figure 3 to answer the following questions:
a) How are the roles of foundational species and keystone species defined? What are the similarities and differences in terms of how each functions in its community?
b) Based on just the abundance data in Table 4, create a new table (this will be referred to as Table 6) showing all of the species that could be considered foundational species or keystone species in each community.
c) What two types of additional information would you need to determine whether these species were indeed foundational species or keystone species? How could you obtain this information? Based on the definitions of foundational and keystone species, how would you use this information to determine whether the species were foundational or keystone species?
Figure 3 Suppose you are researching an ecological community in a new study area. You divide your study area into quadrats and sample one quadrat a day to determine the species that occupy the area and how many individuals of these species are present. Assume that by the end of your sampling efforts, you have identified all of the species that occur in the study area. Use the proportional abundances of species that you calculated and graphed in Table 4 and Figure 3 to answer the following questions:a) How are the roles of foundational species and keystone species defined? What are the similarities and differences in terms of how each functions in its community?
b) Based on just the abundance data in Table 4, create a new table (this will be referred to as Table 6) showing all of the species that could be considered foundational species or keystone species in each community.
c) What two types of additional information would you need to determine whether these species were indeed foundational species or keystone species? How could you obtain this information? Based on the definitions of foundational and keystone species, how would you use this information to determine whether the species were foundational or keystone species?
Unlock Deck
Unlock for access to all 71 flashcards in this deck.
Unlock Deck
k this deck
53
Refer to the tables.
Suppose you are researching an ecological community in a new study area. You divide your study area into quadrats and sample one quadrat a day to determine the species that occupy the area and how many individuals of these species are present. Assume that by the end of your sampling efforts, you have identified all of the species that occur in the study area. Now suppose that species H is an invasive species and that the samples listed in Table 1 show the presence and abundance of species in the same area across 15 years of study. Examine the patterns and impact of the invasion of species H on this community by answering the following questions:
a) Based on Table 1, in which year did species H invade the community?
b) Based on Table 1, when did populations of species H begin to grow?
c) By the end of your study period (in year 15), how does the proportional abundance of species H compare to that of other species in the community?
d) Calculate species richness and diversity for years 3, 8, 12, and 15 based on the data in Table 7. Calculate the Shannon index of species diversity, using Table 8 (supplied) to enter your data to create a new table (these will be referred to as Table 8A, Year 3; 8B, Year 8; 8C Year 12; and 8D, Year 15).
Suppose you are researching an ecological community in a new study area. You divide your study area into quadrats and sample one quadrat a day to determine the species that occupy the area and how many individuals of these species are present. Assume that by the end of your sampling efforts, you have identified all of the species that occur in the study area. Now suppose that species H is an invasive species and that the samples listed in Table 1 show the presence and abundance of species in the same area across 15 years of study. Examine the patterns and impact of the invasion of species H on this community by answering the following questions:a) Based on Table 1, in which year did species H invade the community?
b) Based on Table 1, when did populations of species H begin to grow?
c) By the end of your study period (in year 15), how does the proportional abundance of species H compare to that of other species in the community?
d) Calculate species richness and diversity for years 3, 8, 12, and 15 based on the data in Table 7. Calculate the Shannon index of species diversity, using Table 8 (supplied) to enter your data to create a new table (these will be referred to as Table 8A, Year 3; 8B, Year 8; 8C Year 12; and 8D, Year 15).
Unlock Deck
Unlock for access to all 71 flashcards in this deck.
Unlock Deck
k this deck
54
Refer to the table.
Table 9
Suppose you are researching an ecological community in a new study area. You divide your study area into quadrats and sample one quadrat a day to determine the species that occupy the area and how many individuals of these species are present. Assume that by the end of your sampling efforts, you have identified all of the species that occur in the study area. Use the data in Table 9 to answer the following questions:
a) Create a graph (this will be referred to as Figure 4) of species richness and species diversity over the study years.
b) When was species richness lowest, and when was it highest? When was species diversity lowest, and when was it highest?
c) What is the effect of invasive species H on community structure in year 3 compared to year 8?
d) What is the overall impact of invasive species H on the species richness and species diversity of this community?
Table 9
Suppose you are researching an ecological community in a new study area. You divide your study area into quadrats and sample one quadrat a day to determine the species that occupy the area and how many individuals of these species are present. Assume that by the end of your sampling efforts, you have identified all of the species that occur in the study area. Use the data in Table 9 to answer the following questions:a) Create a graph (this will be referred to as Figure 4) of species richness and species diversity over the study years.
b) When was species richness lowest, and when was it highest? When was species diversity lowest, and when was it highest?
c) What is the effect of invasive species H on community structure in year 3 compared to year 8?
d) What is the overall impact of invasive species H on the species richness and species diversity of this community?
Unlock Deck
Unlock for access to all 71 flashcards in this deck.
Unlock Deck
k this deck
55
Refer to the table.
Table 10
Suppose you are researching an ecological community in a new study area. You divide your study area into quadrats and sample one quadrat a day to determine the species that occupy the area and how many individuals of these species are present. Assume that by the end of your sampling efforts, you have identified all of the species that occur in the study area. You collect additional information on how biomass is transferred through your study system by determining the dietary components of each species during year 12 of your study. Table 10 shows the numbers of individuals that each other individual consumed during year 12. To read the data table, start at a species in column 1, read to the right across that row to find the number of individuals consumed, then read up to determine the species that it consumed. For example, species A consumed 0 individuals of species B (data cell outlined in bold). Refer to the data in Table 10 to understand the structure of the food web in the community in year 12.Answer the following questions:
a) Determine the composition of each species' diets and create a new table (this will be referred to as Table 11) with this data.
b) Create a food web for this system (this will be referred to as Figure 5).
c) Which species is(are) primary producer(s)?
d) Which species is(are) primary consumer(s)?
e) Which species is an omnivore?
Table 10
Suppose you are researching an ecological community in a new study area. You divide your study area into quadrats and sample one quadrat a day to determine the species that occupy the area and how many individuals of these species are present. Assume that by the end of your sampling efforts, you have identified all of the species that occur in the study area. You collect additional information on how biomass is transferred through your study system by determining the dietary components of each species during year 12 of your study. Table 10 shows the numbers of individuals that each other individual consumed during year 12. To read the data table, start at a species in column 1, read to the right across that row to find the number of individuals consumed, then read up to determine the species that it consumed. For example, species A consumed 0 individuals of species B (data cell outlined in bold). Refer to the data in Table 10 to understand the structure of the food web in the community in year 12.Answer the following questions:a) Determine the composition of each species' diets and create a new table (this will be referred to as Table 11) with this data.
b) Create a food web for this system (this will be referred to as Figure 5).
c) Which species is(are) primary producer(s)?
d) Which species is(are) primary consumer(s)?
e) Which species is an omnivore?
Unlock Deck
Unlock for access to all 71 flashcards in this deck.
Unlock Deck
k this deck
56
Refer to the table and the figure.
Table 10
Figure 5
Food web in year 12
Suppose you are researching an ecological community in a new study area. You divide your study area into quadrats and sample one quadrat a day to determine the species that occupy the area and how many individuals of these species are present. Assume that by the end of your sampling efforts, you have identified all of the species that occur in the study area. You collect additional information on how biomass is transferred through your study system by determining the dietary components of each species during year 12 of your study. Table 10 shows the numbers of individuals that each other individual consumed during year 12. To read the data table, start at a species in column 1, read to the right across that row to find the number of individuals consumed, then read up to determine the species that it consumed. For example, species A consumed 0 individuals of species B (data cell outlined in bold). Refer to the data in Table 10 to understand the structure of the food web in the community in year 12.Answer the following questions:
a) What role does species H play in the community in Year 12?
b) Based on Figure 5, how should the loss of species G impact community structure in year 15? Does this differ from the original observed data? What do you think caused the difference in the observed species composition for year 15, and what would you have predicted based on the food web data? If you collected data on the food web in year 15, what differences would you expect from the structure of the food web at year 12? What additional information would be needed to construct a complete food web at year 15?
Table 10
Figure 5Food web in year 12
Suppose you are researching an ecological community in a new study area. You divide your study area into quadrats and sample one quadrat a day to determine the species that occupy the area and how many individuals of these species are present. Assume that by the end of your sampling efforts, you have identified all of the species that occur in the study area. You collect additional information on how biomass is transferred through your study system by determining the dietary components of each species during year 12 of your study. Table 10 shows the numbers of individuals that each other individual consumed during year 12. To read the data table, start at a species in column 1, read to the right across that row to find the number of individuals consumed, then read up to determine the species that it consumed. For example, species A consumed 0 individuals of species B (data cell outlined in bold). Refer to the data in Table 10 to understand the structure of the food web in the community in year 12.Answer the following questions:a) What role does species H play in the community in Year 12?
b) Based on Figure 5, how should the loss of species G impact community structure in year 15? Does this differ from the original observed data? What do you think caused the difference in the observed species composition for year 15, and what would you have predicted based on the food web data? If you collected data on the food web in year 15, what differences would you expect from the structure of the food web at year 12? What additional information would be needed to construct a complete food web at year 15?
Unlock Deck
Unlock for access to all 71 flashcards in this deck.
Unlock Deck
k this deck
57
A group of interacting species that occur together at the same place and time is known as a
A) population.
B) species network.
C) community.
D) metapopulation.
A) population.
B) species network.
C) community.
D) metapopulation.
Unlock Deck
Unlock for access to all 71 flashcards in this deck.
Unlock Deck
k this deck
58
Suppose you are wanting to study a tropical rainforest community. You choose to use a guild subset to study this community. Which of the following would be appropriate as this subset?
A) All bird species in the rainforest
B) All nitrogen fixing plants in the rainforest
C) All granivores in the rainforest
D) All canopy trees in the rainforest
A) All bird species in the rainforest
B) All nitrogen fixing plants in the rainforest
C) All granivores in the rainforest
D) All canopy trees in the rainforest
Unlock Deck
Unlock for access to all 71 flashcards in this deck.
Unlock Deck
k this deck
59
The lowest possible value of the Shannon index is _______. Low values indicate _______ species diversity.
A) -1; low
B) 0; low
C) 0; high
D) 1; low
A) -1; low
B) 0; low
C) 0; high
D) 1; low
Unlock Deck
Unlock for access to all 71 flashcards in this deck.
Unlock Deck
k this deck
60
Suppose you wanted to determine whether you had adequately sampled the species richness of a given amphibian community. Which result would most likely lead to the conclusion that more sampling was needed to assess the species richness?
A) A high Shannon index value
B) A low Shannon index value
C) A linear species accumulation curve
D) A species accumulation curve that reached a threshold
A) A high Shannon index value
B) A low Shannon index value
C) A linear species accumulation curve
D) A species accumulation curve that reached a threshold
Unlock Deck
Unlock for access to all 71 flashcards in this deck.
Unlock Deck
k this deck
61
Refer to the figure.
The figure is of a species accumulation curve, based on the studies of Hughes and colleagues. The orange line (indicated by the black arrow) represents the species accumulation curve for which community in the study?
A) Plants in a temperate forest in Michigan
B) Human oral bacteria
C) Costa Rica moth species
D) East Amazonian soil bacteria
The figure is of a species accumulation curve, based on the studies of Hughes and colleagues. The orange line (indicated by the black arrow) represents the species accumulation curve for which community in the study?A) Plants in a temperate forest in Michigan
B) Human oral bacteria
C) Costa Rica moth species
D) East Amazonian soil bacteria
Unlock Deck
Unlock for access to all 71 flashcards in this deck.
Unlock Deck
k this deck
62
Consider two tropical forests, each of which has 2,700 species. Both forests possess 2,500 of the same species, but 200 of the species are present in either one or the other tropical forest, but not both. This consideration is a measure of
A) species richness.
B) species evenness.
C) species composition.
D) species diversity.
A) species richness.
B) species evenness.
C) species composition.
D) species diversity.
Unlock Deck
Unlock for access to all 71 flashcards in this deck.
Unlock Deck
k this deck
63
The trophic facilitation phenomenon described by Hacker and colleagues involves direct interactions between two plant species in the form of _______, with indirect effects benefiting a(n) _______ of one of the plants.
A) commensalism; parasite
B) commensalism; herbivore
C) commensalism; competitor
D) competition; parasite
A) commensalism; parasite
B) commensalism; herbivore
C) commensalism; competitor
D) competition; parasite
Unlock Deck
Unlock for access to all 71 flashcards in this deck.
Unlock Deck
k this deck
64
Which scenario is a competitive network?
Scenario I: Species 1 outcompetes species 2, which outcompetes species 3, which outcompetes species 4.
Scenario II: Species 5 outcompetes species 6, which outcompetes species 7.
Scenario III: Species 8 outcompetes species 9.
A) Scenario I
B) Scenario II
C) Scenario III
D) None of the above
Scenario I: Species 1 outcompetes species 2, which outcompetes species 3, which outcompetes species 4.
Scenario II: Species 5 outcompetes species 6, which outcompetes species 7.
Scenario III: Species 8 outcompetes species 9.
A) Scenario I
B) Scenario II
C) Scenario III
D) None of the above
Unlock Deck
Unlock for access to all 71 flashcards in this deck.
Unlock Deck
k this deck
65
Steelhead fish are predators of predatory insects, which in turn feed on midge larvae. The midge larvae feed on algae. By indirect effects, a reduction in the number of steelhead fish should lead to a(n) _______ in midges and a(n) _______ in algae.
A) increase; increase
B) increase; decrease
C) decrease; increase
D) decrease; decrease
A) increase; increase
B) increase; decrease
C) decrease; increase
D) decrease; decrease
Unlock Deck
Unlock for access to all 71 flashcards in this deck.
Unlock Deck
k this deck
66
The studies by Power and colleagues of northern California river ecosystems demonstrated
A) that the strengths of species interactions can vary depending on the environmental context.
B) the importance of trophic facilitation.
C) that species diversity estimates can vary depending on the sampling effort.
D) that species can shift from foundation species to ecosystem engineers and back again depending on the environmental conditions.
Unlock Deck
Unlock for access to all 71 flashcards in this deck.
Unlock Deck
k this deck
67
Which statement about foundation species is true?
A) They cannot be ecosystem engineers.
B) They have low abundance but strong effects on the community.
C) They are also keystone species.
D) They have strong community effects due to their high abundance.
A) They cannot be ecosystem engineers.
B) They have low abundance but strong effects on the community.
C) They are also keystone species.
D) They have strong community effects due to their high abundance.
Unlock Deck
Unlock for access to all 71 flashcards in this deck.
Unlock Deck
k this deck
68
Menge and colleagues performed experiments in which they exposed some populations of mussels to sea stars and excluded sea stars from other mussel populations. Suppose that the sea star population consists of 20 individuals and the two populations of mussels are of the same size prior to the mussel treatment. In the treatment condition, there are 500 individuals without sea stars and 100 individuals with sea stars. What is the per capita interaction strength of sea stars on mussels?
A) ln (0.2/20)
B) ln (0.5/20)
C) ln (100/20)
D) ln (500/100)
A) ln (0.2/20)
B) ln (0.5/20)
C) ln (100/20)
D) ln (500/100)
Unlock Deck
Unlock for access to all 71 flashcards in this deck.
Unlock Deck
k this deck
69
Despite having a relatively small biomass, populations of grizzly bears often have strong effects on their communities. The grizzly bear is therefore an example of a
A) foundation species.
B) keystone species.
C) dominant species.
D) trophic facilitator.
A) foundation species.
B) keystone species.
C) dominant species.
D) trophic facilitator.
Unlock Deck
Unlock for access to all 71 flashcards in this deck.
Unlock Deck
k this deck
70
Estimates show that oceans absorb about _______ of the atmospheric CO2.
A) 1%
B) 10%
C) 40%
D) 48%
A) 1%
B) 10%
C) 40%
D) 48%
Unlock Deck
Unlock for access to all 71 flashcards in this deck.
Unlock Deck
k this deck
71
Which statement about the seagrass Posidonia oceanica is false?
A) It has been likened to an underwater tree due to its long life.
B) It supports a multitude of species that use its vegetation as habitat.
C) It has a growth pattern that is similar to that of the invasive alga Caulerpa taxifolia.
D) Its abundance has declined in places where Caulerpa taxifolia has invaded.
Unlock Deck
Unlock for access to all 71 flashcards in this deck.
Unlock Deck
k this deck
Unlock Deck
Unlock for access to all 71 flashcards in this deck.


