Exam 16: The Nature of Communities
Which statement about foundation species is true?
D
Refer to the figure.
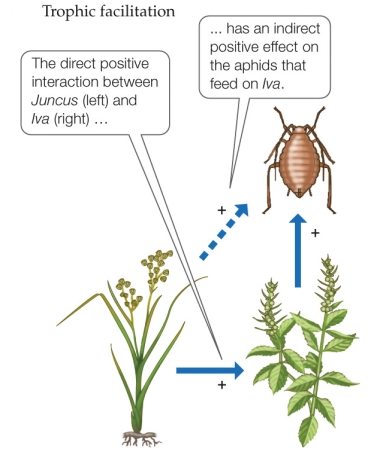 Considering the figure, which of the following scenarios would be best described as trophic facilitation?
B
Refer to the table and the figure.
Table 10
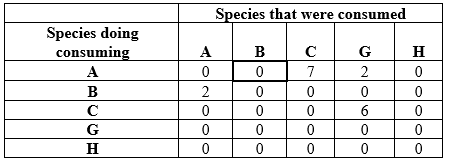 Figure 5
Food web in year 12
Figure 5
Food web in year 12
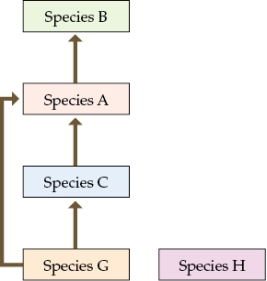 Suppose you are researching an ecological community in a new study area. You divide your study area into quadrats and sample one quadrat a day to determine the species that occupy the area and how many individuals of these species are present. Assume that by the end of your sampling efforts, you have identified all of the species that occur in the study area. You collect additional information on how biomass is transferred through your study system by determining the dietary components of each species during year 12 of your study. Table 10 shows the numbers of individuals that each other individual consumed during year 12. To read the data table, start at a species in column 1, read to the right across that row to find the number of individuals consumed, then read up to determine the species that it consumed. For example, species A consumed 0 individuals of species B (data cell outlined in bold). Refer to the data in Table 10 to understand the structure of the food web in the community in year 12.Answer the following questions:
a) What role does species H play in the community in Year 12?
b) Based on Figure 5, how should the loss of species G impact community structure in year 15? Does this differ from the original observed data? What do you think caused the difference in the observed species composition for year 15, and what would you have predicted based on the food web data? If you collected data on the food web in year 15, what differences would you expect from the structure of the food web at year 12? What additional information would be needed to construct a complete food web at year 15?
Suppose you are researching an ecological community in a new study area. You divide your study area into quadrats and sample one quadrat a day to determine the species that occupy the area and how many individuals of these species are present. Assume that by the end of your sampling efforts, you have identified all of the species that occur in the study area. You collect additional information on how biomass is transferred through your study system by determining the dietary components of each species during year 12 of your study. Table 10 shows the numbers of individuals that each other individual consumed during year 12. To read the data table, start at a species in column 1, read to the right across that row to find the number of individuals consumed, then read up to determine the species that it consumed. For example, species A consumed 0 individuals of species B (data cell outlined in bold). Refer to the data in Table 10 to understand the structure of the food web in the community in year 12.Answer the following questions:
a) What role does species H play in the community in Year 12?
b) Based on Figure 5, how should the loss of species G impact community structure in year 15? Does this differ from the original observed data? What do you think caused the difference in the observed species composition for year 15, and what would you have predicted based on the food web data? If you collected data on the food web in year 15, what differences would you expect from the structure of the food web at year 12? What additional information would be needed to construct a complete food web at year 15?
a) In the community during year 12, species H is a primary producer but is not actually consumed by any of the other species in the community, so it is not actually part of the food web at year 12.
b) None of the other species in year 12 consumed species H, so we would have predicted that the community should have completely collapsed after losing the only primary producer that was actually consumed (species G). However, based on data in year 15, we see that the community has persisted, and abundances of the other species have not changed much, which is contrary to these predictions. If the primary consumers switched from consuming species G to consuming species H once species G disappeared, the community could have persisted. If the food web was constructed at year 15, it would likely be very similar to the web for year 12, except that species H would occupy the role of primary producer and be consumed by the primary consumers, instead of species G, and species G would no longer appear in the food web. Species D and E would also appear in the food web at year 15, but their roles would have to be determined by their consumption patterns and a complete year 15 food web; without this data, we cannot determine how they would fit into the food web.
Refer to the table and figure.
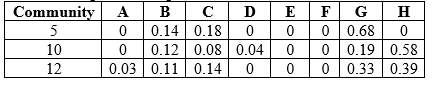 Figure 3
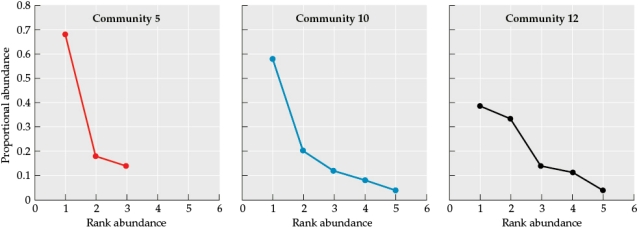 Suppose you are researching an ecological community in a new study area. You divide your study area into quadrats and sample one quadrat a day to determine the species that occupy the area and how many individuals of these species are present. Assume that by the end of your sampling efforts, you have identified all of the species that occur in the study area. Use the proportional abundances of species that you calculated and graphed in Table 4 and Figure 3 to answer the following questions:
a) How are the roles of foundational species and keystone species defined? What are the similarities and differences in terms of how each functions in its community?
b) Based on just the abundance data in Table 4, create a new table (this will be referred to as Table 6) showing all of the species that could be considered foundational species or keystone species in each community.
c) What two types of additional information would you need to determine whether these species were indeed foundational species or keystone species? How could you obtain this information? Based on the definitions of foundational and keystone species, how would you use this information to determine whether the species were foundational or keystone species?
Suppose you are researching an ecological community in a new study area. You divide your study area into quadrats and sample one quadrat a day to determine the species that occupy the area and how many individuals of these species are present. Assume that by the end of your sampling efforts, you have identified all of the species that occur in the study area. Use the proportional abundances of species that you calculated and graphed in Table 4 and Figure 3 to answer the following questions:
a) How are the roles of foundational species and keystone species defined? What are the similarities and differences in terms of how each functions in its community?
b) Based on just the abundance data in Table 4, create a new table (this will be referred to as Table 6) showing all of the species that could be considered foundational species or keystone species in each community.
c) What two types of additional information would you need to determine whether these species were indeed foundational species or keystone species? How could you obtain this information? Based on the definitions of foundational and keystone species, how would you use this information to determine whether the species were foundational or keystone species?
Refer to the figure.
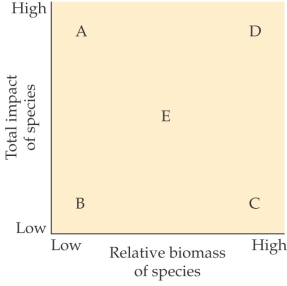 - Where would a keystone species most likely be located in the figure?
Refer to the tables.
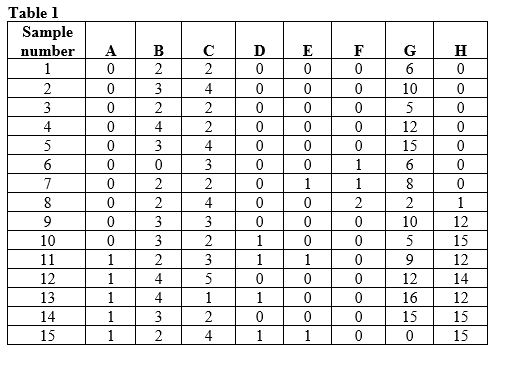
 Suppose you are researching an ecological community in a new study area. You divide your study area into quadrats and sample one quadrat a day to determine the species that occupy the area and how many individuals of these species are present. Assume that by the end of your sampling efforts, you have identified all of the species that occur in the study area. Now suppose that species H is an invasive species and that the samples listed in Table 1 show the presence and abundance of species in the same area across 15 years of study. Examine the patterns and impact of the invasion of species H on this community by answering the following questions:
a) Based on Table 1, in which year did species H invade the community?
b) Based on Table 1, when did populations of species H begin to grow?
c) By the end of your study period (in year 15), how does the proportional abundance of species H compare to that of other species in the community?
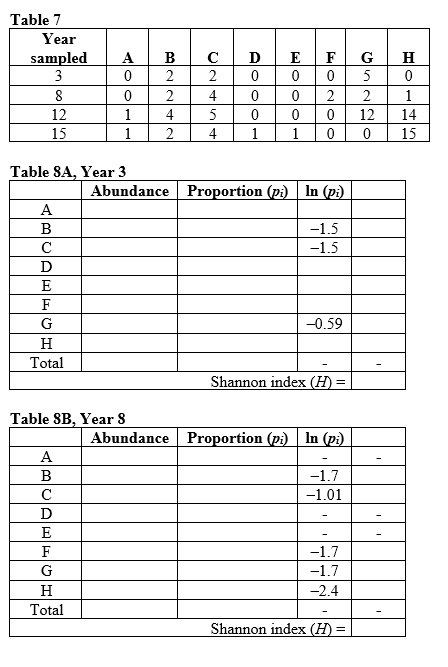
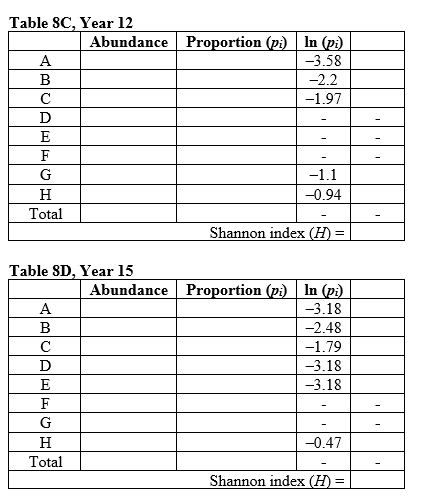
d) Calculate species richness and diversity for years 3, 8, 12, and 15 based on the data in Table 7. Calculate the Shannon index of species diversity, using Table 8 (supplied) to enter your data to create a new table (these will be referred to as Table 8A, Year 3; 8B, Year 8; 8C Year 12; and 8D, Year 15).
Suppose you are researching an ecological community in a new study area. You divide your study area into quadrats and sample one quadrat a day to determine the species that occupy the area and how many individuals of these species are present. Assume that by the end of your sampling efforts, you have identified all of the species that occur in the study area. Now suppose that species H is an invasive species and that the samples listed in Table 1 show the presence and abundance of species in the same area across 15 years of study. Examine the patterns and impact of the invasion of species H on this community by answering the following questions:
a) Based on Table 1, in which year did species H invade the community?
b) Based on Table 1, when did populations of species H begin to grow?
c) By the end of your study period (in year 15), how does the proportional abundance of species H compare to that of other species in the community?
d) Calculate species richness and diversity for years 3, 8, 12, and 15 based on the data in Table 7. Calculate the Shannon index of species diversity, using Table 8 (supplied) to enter your data to create a new table (these will be referred to as Table 8A, Year 3; 8B, Year 8; 8C Year 12; and 8D, Year 15).
Refer to the figure.
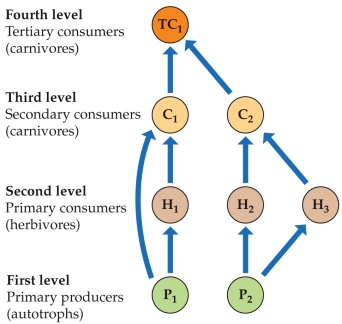 Considering the food web, imagine a circumstance where a new, mutually beneficial relationship develops between H2 and H3, increasing both of their numbers. The effects of this on P2 and C2 are best described as
Which conclusion was the primary finding of Buss and Jackson's study of coral-associated invertebrates and algae in Jamaica?
How many total trophic levels are present in a food web in which the top trophic level consists of secondary consumers? (Do not consider decomposers or omnivores.)
Which statement best describes the difference between the theoretical concept of a community and the ways in which communities are delineated in practice?
Refer to the table.
Table 9
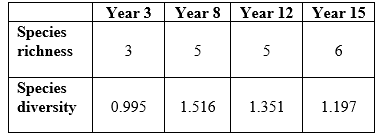 Suppose you are researching an ecological community in a new study area. You divide your study area into quadrats and sample one quadrat a day to determine the species that occupy the area and how many individuals of these species are present. Assume that by the end of your sampling efforts, you have identified all of the species that occur in the study area. Use the data in Table 9 to answer the following questions:
a) Create a graph (this will be referred to as Figure 4) of species richness and species diversity over the study years.
b) When was species richness lowest, and when was it highest? When was species diversity lowest, and when was it highest?
c) What is the effect of invasive species H on community structure in year 3 compared to year 8?
d) What is the overall impact of invasive species H on the species richness and species diversity of this community?
Suppose you are researching an ecological community in a new study area. You divide your study area into quadrats and sample one quadrat a day to determine the species that occupy the area and how many individuals of these species are present. Assume that by the end of your sampling efforts, you have identified all of the species that occur in the study area. Use the data in Table 9 to answer the following questions:
a) Create a graph (this will be referred to as Figure 4) of species richness and species diversity over the study years.
b) When was species richness lowest, and when was it highest? When was species diversity lowest, and when was it highest?
c) What is the effect of invasive species H on community structure in year 3 compared to year 8?
d) What is the overall impact of invasive species H on the species richness and species diversity of this community?
Refer to the tables and figure.
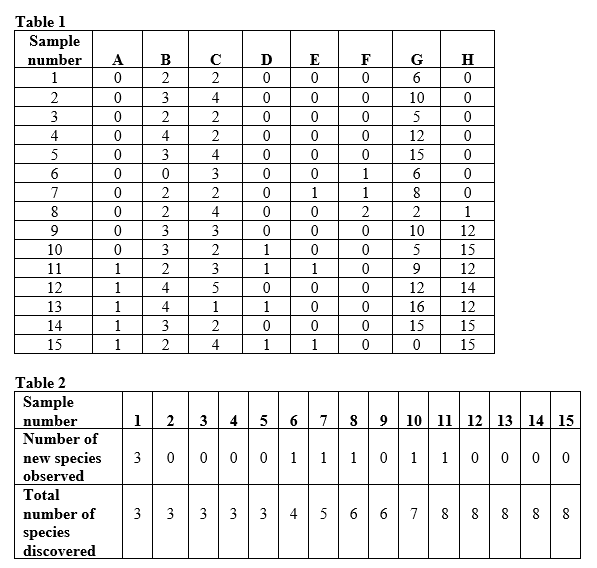 Figure 1
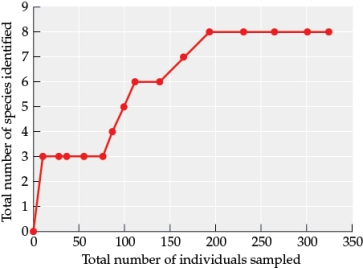 Suppose you are researching an ecological community in a new study area. You divide your study area into quadrats and sample one quadrat a day to determine the species that occupy the area and how many individuals of these species are present. Assume that by the end of your sampling efforts, you have identified all of the species that occur in the study area. Use Table 1, Table 2, and Figure 1 to answer the following questions:
a) In community ecology studies, what is the relationship that you graphed in Figure 1 commonly called?
b) Which species community measure did you plot on the y-axis of the graph?
c) What percentage of the total individuals did you have to sample before you identified all of the species in your study area?
d) How many quadrats did you have to sample before you identified all of the species in your study area?
Suppose you are researching an ecological community in a new study area. You divide your study area into quadrats and sample one quadrat a day to determine the species that occupy the area and how many individuals of these species are present. Assume that by the end of your sampling efforts, you have identified all of the species that occur in the study area. Use Table 1, Table 2, and Figure 1 to answer the following questions:
a) In community ecology studies, what is the relationship that you graphed in Figure 1 commonly called?
b) Which species community measure did you plot on the y-axis of the graph?
c) What percentage of the total individuals did you have to sample before you identified all of the species in your study area?
d) How many quadrats did you have to sample before you identified all of the species in your study area?
Refer to the figure.
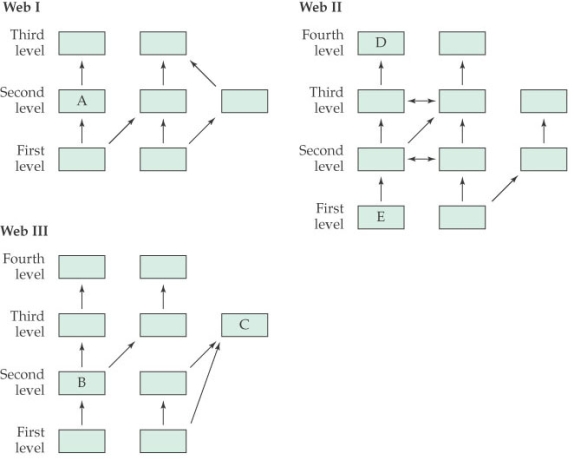 - Which species in the figure is a primary producer?
Menge and colleagues performed experiments in which they exposed some populations of mussels to sea stars and excluded sea stars from other mussel populations. Suppose that the sea star population consists of 20 individuals and the two populations of mussels are of the same size prior to the mussel treatment. In the treatment condition, there are 500 individuals without sea stars and 100 individuals with sea stars. What is the per capita interaction strength of sea stars on mussels?
Alsterberg and colleagues showed that with ocean acidification and warming, the biomass of benthic microalgae declined in the absence of omnivores. This was the result of increased negative interactions with its macroalgal competitors and herbivores. Given this information, the relationship between the omnivores and benthic microalgae can best be described as a(n) _______ interaction.
Refer to the figure.
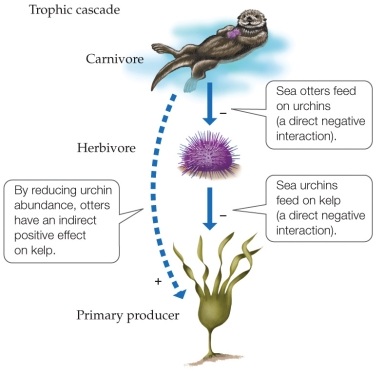 - If another predator were to begin competing with sea otters for the urchins, they would have a(n) _______ effect on otters and a(n) _______ effect on urchins.
Which scenario is a competitive network?
Scenario I: Species 1 outcompetes species 2, which outcompetes species 3, which outcompetes species 4.
Scenario II: Species 5 outcompetes species 6, which outcompetes species 7.
Scenario III: Species 8 outcompetes species 9.
Four species of fish in a pond are found in equal abundance. The Shannon index of the fish community is therefore
Estimates show that oceans absorb about _______ of all the atmospheric CO2.
Filters
- Essay(0)
- Multiple Choice(0)
- Short Answer(0)
- True False(0)
- Matching(0)