Deck 10: Population Dynamics
Full screen (f)
Question
Question
Question
Question
Refer to the figure.
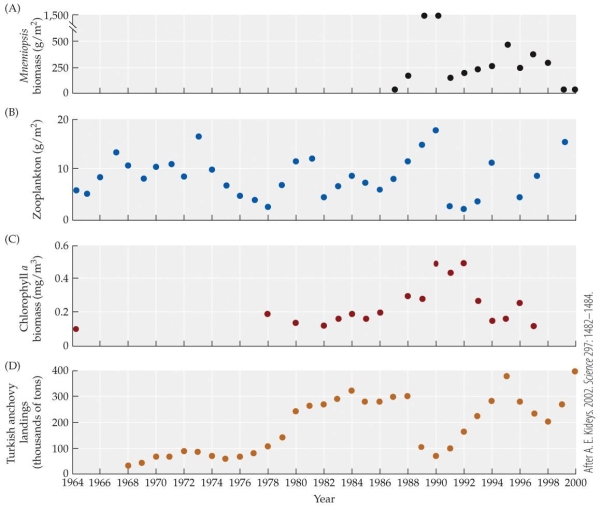
-Between 1988 and 1990, the Turkish anchovy population was _______ and the zooplankton population was _______.
A) increasing; increasing
B) decreasing; decreasing
C) decreasing; increasing
D) increasing; decreasing
-Between 1988 and 1990, the Turkish anchovy population was _______ and the zooplankton population was _______.
A) increasing; increasing
B) decreasing; decreasing
C) decreasing; increasing
D) increasing; decreasing
Question
Refer to the figure.
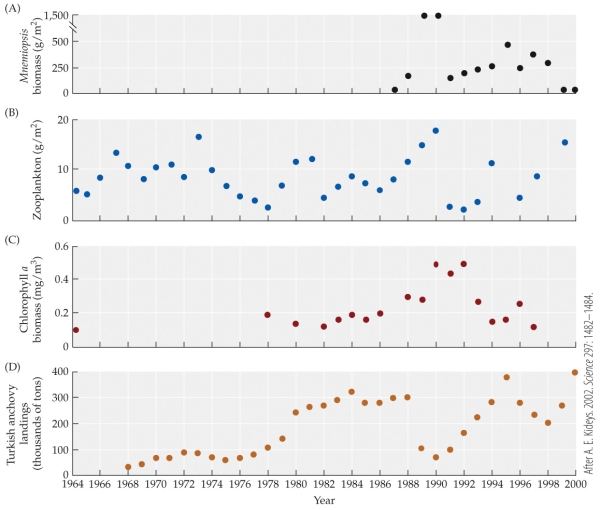
- Based on the figure, which of the following most likely explains the rapid increase in zooplankton between 1996 and 1999?
A) Rapid decrease in chlorophyll a
B) Rapid increase in anchovies
C) Rapid decrease in Mnemiopsis
D) Rapid increase in Mnemiopsis
- Based on the figure, which of the following most likely explains the rapid increase in zooplankton between 1996 and 1999?
A) Rapid decrease in chlorophyll a
B) Rapid increase in anchovies
C) Rapid decrease in Mnemiopsis
D) Rapid increase in Mnemiopsis
Question
Question
Question
Question
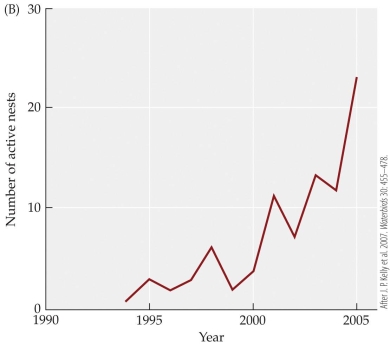
Refer to the figure.
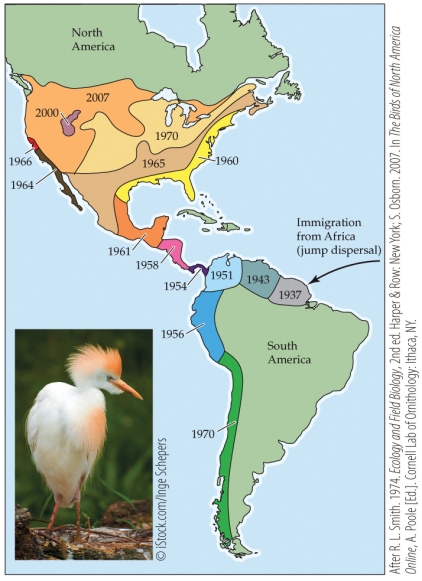 Based on the pattern seen in the figure, you could suggest that _______ growth and _______ population expansion was occurring.
A) exponential; north and west
B) exponential; south and east
C) logistic; south and east
D) logistic; north and east
Based on the pattern seen in the figure, you could suggest that _______ growth and _______ population expansion was occurring.A) exponential; north and west
B) exponential; south and east
C) logistic; south and east
D) logistic; north and east
Question
Refer to the figure.
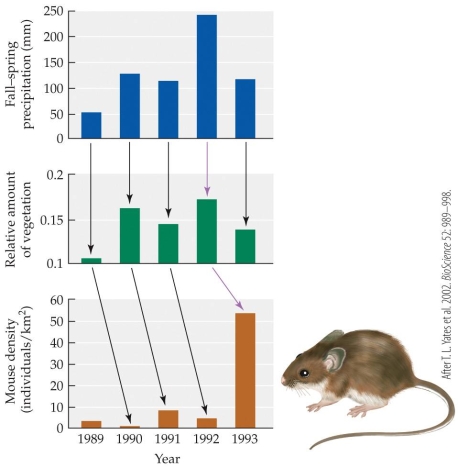 What was the ultimate cause of the increase in mouse density according to this figure?
A) Increased rainfall
B) Decreased rainfall
C) Increased plant growth
D) Decreased plant growth
What was the ultimate cause of the increase in mouse density according to this figure?A) Increased rainfall
B) Decreased rainfall
C) Increased plant growth
D) Decreased plant growth
Question
Question
Question
Question
Question
Question
Question
Question
Question
Question
Question
Refer to the figure.
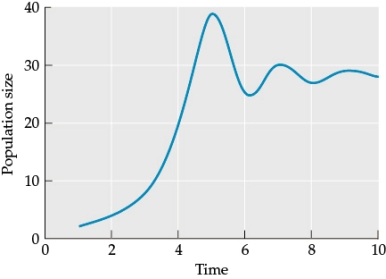 Based on the data in the figure, what is the carrying capacity in this environment?
A) 5
B) 10
C) 28
D) 39
Based on the data in the figure, what is the carrying capacity in this environment?A) 5
B) 10
C) 28
D) 39
Question
Question
Question
Suppose a population of weevils that experiences logistic growth has an initial size of 1,563 and follows the standard equation for delayed density dependence with a 5-week delay and an intrinsic growth rate of 0.15 per week. If these conditions remain constant and the population is tracked for a long time, what type of population dynamics should it display? (Note: The cutoff r value for dampened oscillations is 0.368, and the cutoff for a stable limit cycle is 1.57.)
A) Exponential growth
B) Logistic growth
C) Dampened oscillations
D) A stable limit cycle
value for dampened oscillations is 0.368, and the cutoff for a stable limit cycle is 1.57.)A) Exponential growth
B) Logistic growth
C) Dampened oscillations
D) A stable limit cycle
Question
Question
Question
Question
Question
Question
Question
Question
Question
Question
Refer to the figure.
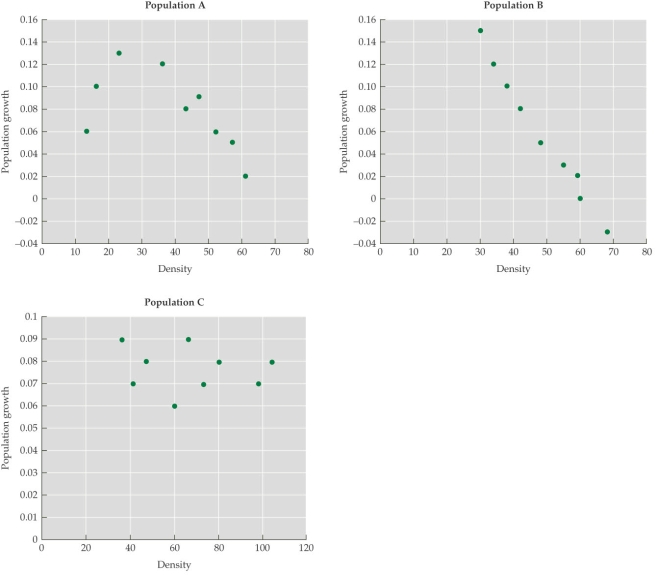 The figure is derived from studies of the populations and per-individual growth rates of three species of rodents in the U.S. desert southwest. According to the figure, which population(s) show(s) evidence of Allee effects?
A) Population A only
B) Population B only
C) Population C only
D) Populations A and B
The figure is derived from studies of the populations and per-individual growth rates of three species of rodents in the U.S. desert southwest. According to the figure, which population(s) show(s) evidence of Allee effects?A) Population A only
B) Population B only
C) Population C only
D) Populations A and B
Question
Question
Refer to the figure.
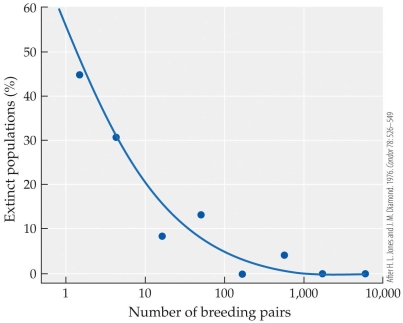 Based on the figure, extinction was a possible outcome for _______ breeding pairs.
A) 10
B) 100
C) 1,000
D) 10,000
Based on the figure, extinction was a possible outcome for _______ breeding pairs.A) 10
B) 100
C) 1,000
D) 10,000
Question
Question
Question
Question
Question
Question
Question
Question
Question
Question
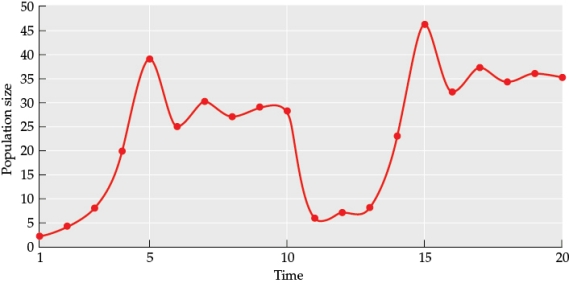
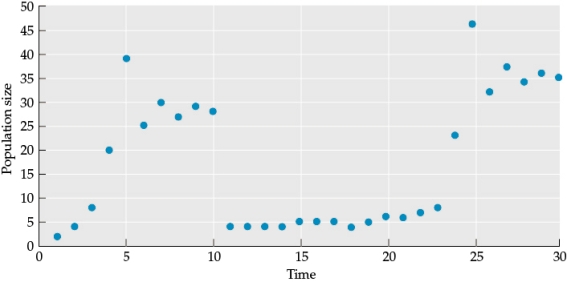
Refer to the figure.
Figure 1
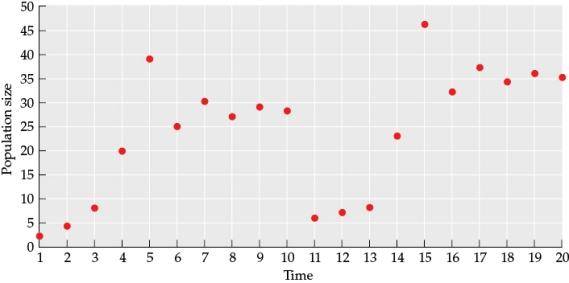 Use the data from the figure to draw a line graph (this will be referred to as Figure 2) that illustrates how population size changes over time. From time 1 to time 10, what type of logistic curve best fits this data? In your answer, address both the pattern of the line and the underlying cause of these patterns.
Figure 1
Use the data from the figure to draw a line graph (this will be referred to as Figure 2) that illustrates how population size changes over time. From time 1 to time 10, what type of logistic curve best fits this data? In your answer, address both the pattern of the line and the underlying cause of these patterns. Question
Refer to the figures.
Figure 1
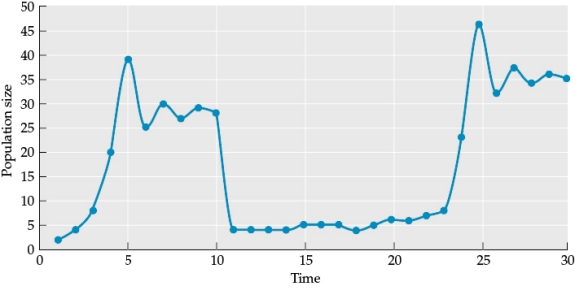
 Figure 2

-What happened to the population between time 10 and 11? Based on the data prior to this point, what type of event most likely caused the change in the population size seen at that time? What additional data would you need to determine the underlying cause of the event?
Figure 1
Figure 2 -What happened to the population between time 10 and 11? Based on the data prior to this point, what type of event most likely caused the change in the population size seen at that time? What additional data would you need to determine the underlying cause of the event?
Question
Refer to the figures.
Figure 1
 Figure 2

- What is the carrying capacity (K) of the population prior to the event that occurred between times 10 and 11? What is the carrying capacity after the event? Why is the carrying capacity different for these times? What could have caused this change?
Figure 1
Figure 2- What is the carrying capacity (K) of the population prior to the event that occurred between times 10 and 11? What is the carrying capacity after the event? Why is the carrying capacity different for these times? What could have caused this change?
Question
Refer to the figures.
Figure 1
 Figure 2

-Based on the changes in population size, during which time period(s) do you expect birth rates to be highest? During which time period(s) do you expect death rates to be highest? When should birth and death rates be most similar?
Figure 1
Figure 2 -Based on the changes in population size, during which time period(s) do you expect birth rates to be highest? During which time period(s) do you expect death rates to be highest? When should birth and death rates be most similar?
Question
Refer to the figures.
Figure 1
 Figure 2
- How did the genetic diversity of this population change over time? How diverse do you think the initial population was, and how diverse do you think the population was after time 11? How would you describe the overall genetic diversity of this population?
Figure 1
Figure 2- How did the genetic diversity of this population change over time? How diverse do you think the initial population was, and how diverse do you think the population was after time 11? How would you describe the overall genetic diversity of this population?
Question
Refer to the figures.
Figure 1
 Figure 2
 Figure 3
 Suppose the population shows the pattern in Figure 3. Draw a new figure (this will be referred to as Figure 4) with a line that indicates how population size changed over time. What is the major difference between this pattern and the pattern in Figure 2? What are two factors that might be causing the pattern in Figure 4?
Figure 1
Figure 2 Figure 3 Suppose the population shows the pattern in Figure 3. Draw a new figure (this will be referred to as Figure 4) with a line that indicates how population size changed over time. What is the major difference between this pattern and the pattern in Figure 2? What are two factors that might be causing the pattern in Figure 4? Question
Refer to the figures.
Figure 2
 Figure 4
 In which figure, Figure 2 or Figure 4, is the population at greater risk of extinction? Why?
Figure 2
Figure 4 In which figure, Figure 2 or Figure 4, is the population at greater risk of extinction? Why? Question
Question
Question
Question
Question
Question
Question
Question
Refer to the figure.
 What type of growth does this population appear to be showing?
A) Logistic
B) Negative
C) Exponential
D) Cycling
What type of growth does this population appear to be showing?A) Logistic
B) Negative
C) Exponential
D) Cycling
Question
Question
Question
Question
Question
Question
Question
Question

Unlock Deck
Sign up to unlock the cards in this deck!
Unlock Deck
Unlock Deck
1/68
Play
Full screen (f)
Deck 10: Population Dynamics
1
The addition of excess nutrients into aquatic systems often disrupts the ecosystem. This phenomenon is known as
A) environmental stochasticity.
B) eutrophication.
C) dampened oscillations.
D) Allee effects.
A) environmental stochasticity.
B) eutrophication.
C) dampened oscillations.
D) Allee effects.
B
2
Which statement about the effects of the comb jelly, Mnemiopsis leidyi, on the Black Sea is false?
A) At the peak of its outbreak in 1989, the biomass of this comb jelly was far greater than the world's entire annual commercial fish catch.
B) This comb jelly is a voracious predator of young fish and fish eggs.
C) By reducing the population sizes of zooplankton, this comb jelly indirectly caused phytoplankton population sizes to increase.
D) The comb jelly immigrated to the black sea naturally.
D
3
Which statement about the Black Sea is false?
A) Its waters are well oxygenated from the surface to the floor of the sea.
B) Because it is nearly land-locked, it exchanges little of its water with other ocean waters.
C) Native predators and parasites failed to regulate its sea comb population.
D) The state of its ecosystem improved between the early 1990s and the late 1990s.
A
4
Refer to the figure.
-Between 1988 and 1990, the Turkish anchovy population was _______ and the zooplankton population was _______.
A) increasing; increasing
B) decreasing; decreasing
C) decreasing; increasing
D) increasing; decreasing
-Between 1988 and 1990, the Turkish anchovy population was _______ and the zooplankton population was _______.
A) increasing; increasing
B) decreasing; decreasing
C) decreasing; increasing
D) increasing; decreasing
Unlock Deck
Unlock for access to all 68 flashcards in this deck.
Unlock Deck
k this deck
5
Refer to the figure.
- Based on the figure, which of the following most likely explains the rapid increase in zooplankton between 1996 and 1999?
A) Rapid decrease in chlorophyll a
B) Rapid increase in anchovies
C) Rapid decrease in Mnemiopsis
D) Rapid increase in Mnemiopsis
- Based on the figure, which of the following most likely explains the rapid increase in zooplankton between 1996 and 1999?
A) Rapid decrease in chlorophyll a
B) Rapid increase in anchovies
C) Rapid decrease in Mnemiopsis
D) Rapid increase in Mnemiopsis
Unlock Deck
Unlock for access to all 68 flashcards in this deck.
Unlock Deck
k this deck
6
During a hurricane, a large segment of an insect population is carried to a distant island where there are abundant resources and minimal predators. What type of growth would you likely expect in the time immediately following this colonization event?
A) Logistic
B) Linear
C) Declining
D) Exponential
A) Logistic
B) Linear
C) Declining
D) Exponential
Unlock Deck
Unlock for access to all 68 flashcards in this deck.
Unlock Deck
k this deck
7
During the 1950s and 1960s, the cattle egret was quickly colonizing Florida. What pattern of population growth best describes that of the cattle egret at that time?
A) Deterministic stochasticity
B) Large, random fluctuations
C) Exponential growth
D) Logistic growth
A) Deterministic stochasticity
B) Large, random fluctuations
C) Exponential growth
D) Logistic growth
Unlock Deck
Unlock for access to all 68 flashcards in this deck.
Unlock Deck
k this deck
8
Which statement about cattle egrets in the Americas is false?
A) Its arrival in South America was the result of a jump dispersal event.
B) It continues to grow exponentially in Florida and other states in the southeastern United States.
C) Its current distribution includes virtually all of the United States (except for Hawaii and Alaska).
D) The patterns observed in the cattle egret are typical of species that disperse to new regions.
Unlock Deck
Unlock for access to all 68 flashcards in this deck.
Unlock Deck
k this deck
9
Refer to the figure.
Based on the pattern seen in the figure, you could suggest that _______ growth and _______ population expansion was occurring.
A) exponential; north and west
B) exponential; south and east
C) logistic; south and east
D) logistic; north and east
Based on the pattern seen in the figure, you could suggest that _______ growth and _______ population expansion was occurring.A) exponential; north and west
B) exponential; south and east
C) logistic; south and east
D) logistic; north and east
Unlock Deck
Unlock for access to all 68 flashcards in this deck.
Unlock Deck
k this deck
10
Refer to the figure.
What was the ultimate cause of the increase in mouse density according to this figure?
A) Increased rainfall
B) Decreased rainfall
C) Increased plant growth
D) Decreased plant growth
What was the ultimate cause of the increase in mouse density according to this figure?A) Increased rainfall
B) Decreased rainfall
C) Increased plant growth
D) Decreased plant growth
Unlock Deck
Unlock for access to all 68 flashcards in this deck.
Unlock Deck
k this deck
11
Which pattern of population dynamics best describes the one exhibited by sheep introduced to the island of Tasmania?
A) Logistic growth
B) Population cycles
C) Exponential growth
D) Outbreaks
A) Logistic growth
B) Population cycles
C) Exponential growth
D) Outbreaks
Unlock Deck
Unlock for access to all 68 flashcards in this deck.
Unlock Deck
k this deck
12
Which equation best describes the pattern of population dynamics of the sheep in Tasmania from their introduction to the present day?
A) dN/dt = rN
B) dN/dt = rN(1 ‒ N/K)
C) dN/dt = rK(1 ‒ K/N)
D) dN/dt = rK(1 ‒ N/K)
A) dN/dt = rN
B) dN/dt = rN(1 ‒ N/K)
C) dN/dt = rK(1 ‒ K/N)
D) dN/dt = rK(1 ‒ N/K)
Unlock Deck
Unlock for access to all 68 flashcards in this deck.
Unlock Deck
k this deck
13
Consider a population of birds that land on an island. Their numbers rise exponentially until they reach a population of 1,000 birds, after which they crash to 700 due to resource limitations. Over time, the population rises and falls until it stabilizes around a population of 850. What does this population size likely represent in terms of population growth?
A) Fluctuation
B) Outbreak
C) Carrying capacity
D) Maximum population size
A) Fluctuation
B) Outbreak
C) Carrying capacity
D) Maximum population size
Unlock Deck
Unlock for access to all 68 flashcards in this deck.
Unlock Deck
k this deck
14
Which statement about logistic growth is false?
A) The standard logistic equation assumes that the carrying capacity is not constant.
B) Changes in environmental conditions can cause the carrying capacity to fluctuate.
C) The term "logistic growth" is used broadly to indicate any population whose numbers rise initially but then level off at a maximum population size.
D) Variation in the birth rate that occurs at a particular density can lead to variation in the carrying capacity.
Unlock Deck
Unlock for access to all 68 flashcards in this deck.
Unlock Deck
k this deck
15
Which of the following is an extreme case of population fluctuations?
A) Logistic growth
B) Demographic stochasticity
C) Population outbreaks
D) Delayed density dependence
A) Logistic growth
B) Demographic stochasticity
C) Population outbreaks
D) Delayed density dependence
Unlock Deck
Unlock for access to all 68 flashcards in this deck.
Unlock Deck
k this deck
16
Which statement about population fluctuations is false?
A) Population fluctuations can be caused by changes in density-dependent factors.
B) Population fluctuations can be caused by changes in density-independent factors.
C) All natural populations fluctuate in size.
D) With abundant resources, a population can increase indefinitely.
A) Population fluctuations can be caused by changes in density-dependent factors.
B) Population fluctuations can be caused by changes in density-independent factors.
C) All natural populations fluctuate in size.
D) With abundant resources, a population can increase indefinitely.
Unlock Deck
Unlock for access to all 68 flashcards in this deck.
Unlock Deck
k this deck
17
In which organism can one best observe the phenomenon of population cycles?
A) Collared lemmings in Greenland
B) Cattle egrets in Florida
C) The comb jelly, Mnemiopsis leidyi, in the Black Sea
D) The bordered white moth in German forests
A) Collared lemmings in Greenland
B) Cattle egrets in Florida
C) The comb jelly, Mnemiopsis leidyi, in the Black Sea
D) The bordered white moth in German forests
Unlock Deck
Unlock for access to all 68 flashcards in this deck.
Unlock Deck
k this deck
18
Population cycles in all small rodents are driven by
A) predators.
B) parasites.
C) competitors.
D) None of the above; no universal cause of population cycles in small rodents has been identified.
A) predators.
B) parasites.
C) competitors.
D) None of the above; no universal cause of population cycles in small rodents has been identified.
Unlock Deck
Unlock for access to all 68 flashcards in this deck.
Unlock Deck
k this deck
19
Allstadt et al. (2013) found that population cycle collapse in Canadian populations of gypsy moths resulted from
A) an attack by a specialist pathogen.
B) climate change.
C) lack of food.
D) drought.
A) an attack by a specialist pathogen.
B) climate change.
C) lack of food.
D) drought.
Unlock Deck
Unlock for access to all 68 flashcards in this deck.
Unlock Deck
k this deck
20
Which of the following is a plausible consequence of delayed density dependence in a population that would otherwise have logistic growth?
A) Increased environmental stochasticity
B) Heightened oscillations
C) Population cycles
D) Exponential growth
A) Increased environmental stochasticity
B) Heightened oscillations
C) Population cycles
D) Exponential growth
Unlock Deck
Unlock for access to all 68 flashcards in this deck.
Unlock Deck
k this deck
21
Refer to the figure.
Based on the data in the figure, what is the carrying capacity in this environment?
A) 5
B) 10
C) 28
D) 39
Based on the data in the figure, what is the carrying capacity in this environment?A) 5
B) 10
C) 28
D) 39
Unlock Deck
Unlock for access to all 68 flashcards in this deck.
Unlock Deck
k this deck
22
A population of wolves predates a population of moose on Isle Royale, Michigan, where there are fewer wolves than moose to start. The wolves prey on the moose and eat well, allowing them to have abundant offspring. However, as the wolf population rises, the moose population drops, and over time, the wolf population begins to drop also because of the reduced availability of resources. As the wolf population drops, moose are able to better survive and reproduce, causing the moose population to rise. With this abundance of moose, the wolf population is able to rebound until their population exceeds the moose population's ability to support the number of wolves. Which population dynamic does this series of oscillations represent?
A) Delayed density dependence
B) Delayed density independence
C) Extinction vortex
D) Carrying capacity
A) Delayed density dependence
B) Delayed density independence
C) Extinction vortex
D) Carrying capacity
Unlock Deck
Unlock for access to all 68 flashcards in this deck.
Unlock Deck
k this deck
23
Which of the following is most likely to lead to population cycles?
A) Demographic stochasticity
B) Delayed density dependence
C) Habitat fragmentation
D) Logistic growth
A) Demographic stochasticity
B) Delayed density dependence
C) Habitat fragmentation
D) Logistic growth
Unlock Deck
Unlock for access to all 68 flashcards in this deck.
Unlock Deck
k this deck
24
Suppose a population of weevils that experiences logistic growth has an initial size of 1,563 and follows the standard equation for delayed density dependence with a 5-week delay and an intrinsic growth rate of 0.15 per week. If these conditions remain constant and the population is tracked for a long time, what type of population dynamics should it display? (Note: The cutoff r value for dampened oscillations is 0.368, and the cutoff for a stable limit cycle is 1.57.)
A) Exponential growth
B) Logistic growth
C) Dampened oscillations
D) A stable limit cycle
value for dampened oscillations is 0.368, and the cutoff for a stable limit cycle is 1.57.)A) Exponential growth
B) Logistic growth
C) Dampened oscillations
D) A stable limit cycle
Unlock Deck
Unlock for access to all 68 flashcards in this deck.
Unlock Deck
k this deck
25
In the 1950s, Nicholson's experiments with blowflies showed that delayed density dependence can produce population cycles. If the experimental subjects in these studies had been blowflies with somewhat lower growth rates, he most likely would have observed which pattern of population dynamics?
A) Dampened oscillations
B) Exponential growth
C) Population outbreaks at unpredictable intervals
D) Demographic stochasticity
A) Dampened oscillations
B) Exponential growth
C) Population outbreaks at unpredictable intervals
D) Demographic stochasticity
Unlock Deck
Unlock for access to all 68 flashcards in this deck.
Unlock Deck
k this deck
26
Nicholson (1957) found that when adult sheep blowfly populations are high, egg production by blowflies
A) increases dramatically.
B) increases slightly.
C) stays the same as when populations are low.
D) decreases and few or no eggs are produced.
A) increases dramatically.
B) increases slightly.
C) stays the same as when populations are low.
D) decreases and few or no eggs are produced.
Unlock Deck
Unlock for access to all 68 flashcards in this deck.
Unlock Deck
k this deck
27
Which statement about Nicholson's experiments with blowflies is true?
A) Population cycles occurred when adults had limited food and maggots had unlimited food.
B) Population cycles occurred when both maggots and adults had unlimited food.
C) Population cycles occurred when both maggots and adults had limited food.
D) Population cycles occurred when adults had unlimited food and maggots had limited food.
Unlock Deck
Unlock for access to all 68 flashcards in this deck.
Unlock Deck
k this deck
28
Assuming that their average population growth rates and all other factors are equal, which population would most likely be at risk for extinction?
A) A large population with low variation in its growth rate
B) A large population with high variation in its growth rate
C) A small population with high variation in its growth rate
D) A small population with low variation in its growth rate
A) A large population with low variation in its growth rate
B) A large population with high variation in its growth rate
C) A small population with high variation in its growth rate
D) A small population with low variation in its growth rate
Unlock Deck
Unlock for access to all 68 flashcards in this deck.
Unlock Deck
k this deck
29
A small population of 100 organisms is only able to contribute 25 offspring to the next generation, but during that time, 30 individuals in the population die. In the next iteration, the remaining 95 individuals generate only 20 offspring, but during that time, 30 individuals of the population die. The remaining 85 individuals generate only 15 offspring, but during that time, 30 individuals of the population die. Which of the following terms best describes what this population is experiencing?
A) Ineffective population size
B) Negative exponential growth
C) Carrying capacity
D) Extinction vortex
A) Ineffective population size
B) Negative exponential growth
C) Carrying capacity
D) Extinction vortex
Unlock Deck
Unlock for access to all 68 flashcards in this deck.
Unlock Deck
k this deck
30
Which of the following statements about effective population size is true?
A) It is the minimum number of organisms needed for a population to survive.
B) It is the number of individuals needed to maximize genetic diversity.
C) It is the maximum number of individuals an ecosystem can support.
D) It is the number of individuals that can contribute offspring to the next generation.
Unlock Deck
Unlock for access to all 68 flashcards in this deck.
Unlock Deck
k this deck
31
Which of the following statements is a conclusion of Jones and Diamond's studies of extinction in bird populations in the Channel Islands?
A) Larger populations are at less risk of going extinct than smaller ones are.
B) Genetic drift is the most important factor in determining extinction risk.
C) Genetic drift is not an important factor in determining extinction risk.
D) Demographic stochasticity is the most important factor in determining extinction risk.
Unlock Deck
Unlock for access to all 68 flashcards in this deck.
Unlock Deck
k this deck
32
Suppose that only two females and a small number of males are left in a population of a highly endangered bird. Although all of these birds are healthy, by chance, both females fail to reproduce and the population goes extinct. This extinction is best described as a consequence of
A) inbreeding.
B) genetic drift.
C) environmental stochasticity.
D) demographic stochasticity.
A) inbreeding.
B) genetic drift.
C) environmental stochasticity.
D) demographic stochasticity.
Unlock Deck
Unlock for access to all 68 flashcards in this deck.
Unlock Deck
k this deck
33
At low population densities, the flocking behavior of some species of birds is disrupted to the extent that the population growth rate is lower at very low densities than it is at somewhat higher densities. This is an example of
A) an Allee effect.
B) genetic drift.
C) environmental stochasticity.
D) dampened oscillations.
A) an Allee effect.
B) genetic drift.
C) environmental stochasticity.
D) dampened oscillations.
Unlock Deck
Unlock for access to all 68 flashcards in this deck.
Unlock Deck
k this deck
34
Refer to the figure.
The figure is derived from studies of the populations and per-individual growth rates of three species of rodents in the U.S. desert southwest. According to the figure, which population(s) show(s) evidence of Allee effects?
A) Population A only
B) Population B only
C) Population C only
D) Populations A and B
The figure is derived from studies of the populations and per-individual growth rates of three species of rodents in the U.S. desert southwest. According to the figure, which population(s) show(s) evidence of Allee effects?A) Population A only
B) Population B only
C) Population C only
D) Populations A and B
Unlock Deck
Unlock for access to all 68 flashcards in this deck.
Unlock Deck
k this deck
35
Which statement about genetic drift is false?
A) It can rapidly reduce the genetic variability of small populations.
B) It is a process by which chance events influence which alleles are transmitted to the next generation.
C) It is an Allee effect.
D) It can cause harmful alleles to occur at high frequency.
A) It can rapidly reduce the genetic variability of small populations.
B) It is a process by which chance events influence which alleles are transmitted to the next generation.
C) It is an Allee effect.
D) It can cause harmful alleles to occur at high frequency.
Unlock Deck
Unlock for access to all 68 flashcards in this deck.
Unlock Deck
k this deck
36
Refer to the figure.
Based on the figure, extinction was a possible outcome for _______ breeding pairs.
A) 10
B) 100
C) 1,000
D) 10,000
Based on the figure, extinction was a possible outcome for _______ breeding pairs.A) 10
B) 100
C) 1,000
D) 10,000
Unlock Deck
Unlock for access to all 68 flashcards in this deck.
Unlock Deck
k this deck
37
Imagine a moose in Grand Teton National Park, Wyoming is wandering around in a field of flowers. As it walks, it crushes and kills several flowers that turn out to be the last of their kind, causing that species of flower to go extinct. What is this an example of?
A) Extinction vortex
B) Genetic drift
C) Density dependent factor
D) Allee effects
A) Extinction vortex
B) Genetic drift
C) Density dependent factor
D) Allee effects
Unlock Deck
Unlock for access to all 68 flashcards in this deck.
Unlock Deck
k this deck
38
Although there are approximately 10,000 cheetahs left in the wild, biologists think that their numbers were much lower at some time in the past because cheetah populations have very little genetic variation. What is the most likely reason for the lack of genetic variability in cheetahs?
A) Environmental stochasticity
B) Demographic stochasticity
C) Genetic stochasticity
D) Genetic drift
A) Environmental stochasticity
B) Demographic stochasticity
C) Genetic stochasticity
D) Genetic drift
Unlock Deck
Unlock for access to all 68 flashcards in this deck.
Unlock Deck
k this deck
39
Which of the following could be considered the opposite of the density dependence seen in the standard logistic equation?
A) Genetic drift
B) An Allee effect
C) Environmental stochasticity
D) Delayed density dependence
A) Genetic drift
B) An Allee effect
C) Environmental stochasticity
D) Delayed density dependence
Unlock Deck
Unlock for access to all 68 flashcards in this deck.
Unlock Deck
k this deck
40
Which of the following would be least likely to cause the extinction of a population comprising 20 individuals within a single generation?
A) A natural catastrophe
B) Environmental stochasticity
C) Demographic stochasticity
D) Allee effects
A) A natural catastrophe
B) Environmental stochasticity
C) Demographic stochasticity
D) Allee effects
Unlock Deck
Unlock for access to all 68 flashcards in this deck.
Unlock Deck
k this deck
41
Which statement about environmental stochasticity is true?
A) Environmental stochasticity places grizzly bears in Yellowstone National Park at risk for extinction despite the average positive growth rate of this population.
B) There is no fundamental difference between environmental stochasticity and demographic stochasticity.
C) In a situation of environmental stochasticity, the underlying birth and death rates of individuals are constant across years.
D) Extinction is much less likely to occur during periods of environmental stochasticity.
Unlock Deck
Unlock for access to all 68 flashcards in this deck.
Unlock Deck
k this deck
42
A population of lions in the Ngorongoro Crater of Tanzania is struggling to survive as a result of
A) climate change.
B) inbreeding.
C) population explosion.
D) environmental stochasticity.
A) climate change.
B) inbreeding.
C) population explosion.
D) environmental stochasticity.
Unlock Deck
Unlock for access to all 68 flashcards in this deck.
Unlock Deck
k this deck
43
Which event did not contribute to the recovery of the Black Sea during the 1990s?
A) Reduction in eutrophication
B) The arrival of another comb jelly that ate Mnemiopsis
C) Changes in bottom-up control
D) Allee effects
A) Reduction in eutrophication
B) The arrival of another comb jelly that ate Mnemiopsis
C) Changes in bottom-up control
D) Allee effects
Unlock Deck
Unlock for access to all 68 flashcards in this deck.
Unlock Deck
k this deck
44
Suppose you are studying two small lakes (lake 1 and lake 2) and how they change over time. A nearby farm accidentally spills fertilizer into lake 1. Around the same time, a non-native fish-eating turtle is introduced into lake 2. The ecosystems of both lakes are affected by these changes. What processes most likely explain how the lakes were affected?
A) Bottom-up control in lake 1; top-down control in lake 2
B) Top-down control in lake 1; bottom-up control in lake 2
C) Top-down control in both lakes
D) Bottom-up control in both lakes
A) Bottom-up control in lake 1; top-down control in lake 2
B) Top-down control in lake 1; bottom-up control in lake 2
C) Top-down control in both lakes
D) Bottom-up control in both lakes
Unlock Deck
Unlock for access to all 68 flashcards in this deck.
Unlock Deck
k this deck
45
Lionfish (Pterois spp.) arrived in the Caribbean in the 1980s, most likely as a result of unintentional release. On the island of Bonaire, Municipality of the Netherlands, the lionfish population exploded initially, but over time, appeared to stabilize. Part of the reason for this stabilization was the popularity of spear fishing. As the population of lionfish at shallow depths (5-30 meters) were vastly reduced by spear fishing, the popularity of hunting lionfish declined. Over time, the lionfish recovered and spearfishing recommenced. Another possible reason for the lionfish population's decline is an emerging ulcerative skin disease. Use this story of Bonaire to discuss the following types of observed patterns of population growth: exponential growth, logistic growth, and regular population cycles.
Unlock Deck
Unlock for access to all 68 flashcards in this deck.
Unlock Deck
k this deck
46
Refer to the figure.
Figure 1
Use the data from the figure to draw a line graph (this will be referred to as Figure 2) that illustrates how population size changes over time. From time 1 to time 10, what type of logistic curve best fits this data? In your answer, address both the pattern of the line and the underlying cause of these patterns.
Figure 1
Use the data from the figure to draw a line graph (this will be referred to as Figure 2) that illustrates how population size changes over time. From time 1 to time 10, what type of logistic curve best fits this data? In your answer, address both the pattern of the line and the underlying cause of these patterns. Unlock Deck
Unlock for access to all 68 flashcards in this deck.
Unlock Deck
k this deck
47
Refer to the figures.
Figure 1
Figure 2
-What happened to the population between time 10 and 11? Based on the data prior to this point, what type of event most likely caused the change in the population size seen at that time? What additional data would you need to determine the underlying cause of the event?
Figure 1
Figure 2 -What happened to the population between time 10 and 11? Based on the data prior to this point, what type of event most likely caused the change in the population size seen at that time? What additional data would you need to determine the underlying cause of the event?
Unlock Deck
Unlock for access to all 68 flashcards in this deck.
Unlock Deck
k this deck
48
Refer to the figures.
Figure 1
Figure 2
- What is the carrying capacity (K) of the population prior to the event that occurred between times 10 and 11? What is the carrying capacity after the event? Why is the carrying capacity different for these times? What could have caused this change?
Figure 1
Figure 2- What is the carrying capacity (K) of the population prior to the event that occurred between times 10 and 11? What is the carrying capacity after the event? Why is the carrying capacity different for these times? What could have caused this change?
Unlock Deck
Unlock for access to all 68 flashcards in this deck.
Unlock Deck
k this deck
49
Refer to the figures.
Figure 1
Figure 2
-Based on the changes in population size, during which time period(s) do you expect birth rates to be highest? During which time period(s) do you expect death rates to be highest? When should birth and death rates be most similar?
Figure 1
Figure 2 -Based on the changes in population size, during which time period(s) do you expect birth rates to be highest? During which time period(s) do you expect death rates to be highest? When should birth and death rates be most similar?
Unlock Deck
Unlock for access to all 68 flashcards in this deck.
Unlock Deck
k this deck
50
Refer to the figures.
Figure 1
Figure 2
- How did the genetic diversity of this population change over time? How diverse do you think the initial population was, and how diverse do you think the population was after time 11? How would you describe the overall genetic diversity of this population?
Figure 1
Figure 2- How did the genetic diversity of this population change over time? How diverse do you think the initial population was, and how diverse do you think the population was after time 11? How would you describe the overall genetic diversity of this population?
Unlock Deck
Unlock for access to all 68 flashcards in this deck.
Unlock Deck
k this deck
51
Refer to the figures.
Figure 1
Figure 2
Figure 3
Suppose the population shows the pattern in Figure 3. Draw a new figure (this will be referred to as Figure 4) with a line that indicates how population size changed over time. What is the major difference between this pattern and the pattern in Figure 2? What are two factors that might be causing the pattern in Figure 4?
Figure 1
Figure 2 Figure 3 Suppose the population shows the pattern in Figure 3. Draw a new figure (this will be referred to as Figure 4) with a line that indicates how population size changed over time. What is the major difference between this pattern and the pattern in Figure 2? What are two factors that might be causing the pattern in Figure 4? Unlock Deck
Unlock for access to all 68 flashcards in this deck.
Unlock Deck
k this deck
52
Refer to the figures.
Figure 2
Figure 4
In which figure, Figure 2 or Figure 4, is the population at greater risk of extinction? Why?
Figure 2
Figure 4 In which figure, Figure 2 or Figure 4, is the population at greater risk of extinction? Why? Unlock Deck
Unlock for access to all 68 flashcards in this deck.
Unlock Deck
k this deck
53
When wolves were returned to Yellowstone National Park in 1995, they immediately began feeding on elk, reducing their numbers. This allowed aspen trees to increase in abundance, which ushered in the return of beaver populations. As beaver populations dammed streams, they slowed water flow and stabilized streambanks. The stabilization of streambanks increased riparian habitat in which songbirds could nest, and the ponds provided breeding habitat for amphibians. Explain this story using the concepts of top-down and bottom-up control.
Unlock Deck
Unlock for access to all 68 flashcards in this deck.
Unlock Deck
k this deck
54
Which statement about the Black Sea is false?
A) Because it is nearly land-locked, it exchanges little of its water with other ocean waters.
B) Only the top layer (about a tenth of its average depth) contains oxygen.
C) Native predators regulate the sea comb population.
D) The state of its ecosystem improved between the early and late 1990s.
A) Because it is nearly land-locked, it exchanges little of its water with other ocean waters.
B) Only the top layer (about a tenth of its average depth) contains oxygen.
C) Native predators regulate the sea comb population.
D) The state of its ecosystem improved between the early and late 1990s.
Unlock Deck
Unlock for access to all 68 flashcards in this deck.
Unlock Deck
k this deck
55
Eutrophication occurs when
A) there is a decrease in available nutrients in an ecosystem.
B) there are no nutrients in an ecosystem.
C) there is a minimum amount of nutrients in an ecosystem for survival.
D) there is an increase in the nutrient content of an ecosystem.
A) there is a decrease in available nutrients in an ecosystem.
B) there are no nutrients in an ecosystem.
C) there is a minimum amount of nutrients in an ecosystem for survival.
D) there is an increase in the nutrient content of an ecosystem.
Unlock Deck
Unlock for access to all 68 flashcards in this deck.
Unlock Deck
k this deck
56
A population of rodents contained 703 individuals at the end of March. During the month of April, 47 died, 17 were born, 57 immigrated, and 16 emigrated. What was the population size after those events?
A) 673
B) 692
C) 714
D) 730
A) 673
B) 692
C) 714
D) 730
Unlock Deck
Unlock for access to all 68 flashcards in this deck.
Unlock Deck
k this deck
57
Which pattern of population dynamics best describes that exhibited by collared lemmings in Greenland?
A) Outbreaks
B) Population cycles
C) Exponential growth
D) Logistic growth
A) Outbreaks
B) Population cycles
C) Exponential growth
D) Logistic growth
Unlock Deck
Unlock for access to all 68 flashcards in this deck.
Unlock Deck
k this deck
58
Which of the following is not an observed pattern of population growth observed in nature?
A) Infinite population growth
B) Exponential growth
C) Logistic growth
D) Population cycling
A) Infinite population growth
B) Exponential growth
C) Logistic growth
D) Population cycling
Unlock Deck
Unlock for access to all 68 flashcards in this deck.
Unlock Deck
k this deck
59
Which of the following provides a clear demonstration of logistic growth?
A) Sheep introduced to Tasmania
B) Blowflies in which the adults are given unlimited supplies of liver but maggots are given a limited supply
C) Most natural populations of lemmings
D) Cattle egrets in Florida
A) Sheep introduced to Tasmania
B) Blowflies in which the adults are given unlimited supplies of liver but maggots are given a limited supply
C) Most natural populations of lemmings
D) Cattle egrets in Florida
Unlock Deck
Unlock for access to all 68 flashcards in this deck.
Unlock Deck
k this deck
60
Refer to the figure.
What type of growth does this population appear to be showing?
A) Logistic
B) Negative
C) Exponential
D) Cycling
What type of growth does this population appear to be showing?A) Logistic
B) Negative
C) Exponential
D) Cycling
Unlock Deck
Unlock for access to all 68 flashcards in this deck.
Unlock Deck
k this deck
61
Which of the following best describes an explosion of the number of individuals in a population?
A) Logistic growth
B) Carrying capacity
C) Outbreak
D) Population fluctuation
A) Logistic growth
B) Carrying capacity
C) Outbreak
D) Population fluctuation
Unlock Deck
Unlock for access to all 68 flashcards in this deck.
Unlock Deck
k this deck
62
A population that experiences delayed density dependence will exhibit particular patterns of population dynamics depending upon r (the population growth rate under ideal conditions the time lag in the effects of density dependence). At low levels of this interaction, the population should exhibit _______; at intermediate levels, it should display _______; and at still higher levels, it should exhibit _______.
A) exponential growth; stable limit cycles; demographic stochasticity
B) logistic growth; stable limit cycles; dampened oscillations
C) logistic growth; dampened oscillations; stable limit cycles
D) demographic stochasticity; stable limit cycles; genetic drift
A) exponential growth; stable limit cycles; demographic stochasticity
B) logistic growth; stable limit cycles; dampened oscillations
C) logistic growth; dampened oscillations; stable limit cycles
D) demographic stochasticity; stable limit cycles; genetic drift
Unlock Deck
Unlock for access to all 68 flashcards in this deck.
Unlock Deck
k this deck
63
In Nicholson's experiments with blowflies, population cycles most often occurred when adults
A) and maggots both had an unlimited food supply.
B) and maggots both had a limited food supply.
C) had a limited food supply and maggots had an unlimited food supply.
D) had an unlimited food supply and maggots had a limited food supply.
A) and maggots both had an unlimited food supply.
B) and maggots both had a limited food supply.
C) had a limited food supply and maggots had an unlimited food supply.
D) had an unlimited food supply and maggots had a limited food supply.
Unlock Deck
Unlock for access to all 68 flashcards in this deck.
Unlock Deck
k this deck
64
A population of blowflies experiences logistic growth with delayed density dependence. Suppose that this population has an initial size of 4,295 and follows the standard equation for delayed density dependence with a 10-week delay and an intrinsic growth rate of 0.2 per week. If these conditions remain constant and the population is tracked for a long time, what type of population dynamics should it display? (Note: The cutoff r value for dampened oscillations is 0.368, and the cutoff for a stable limit cycle is 1.57.)
A) A stable limit cycle
B) Logistic growth
C) Dampened oscillations
D) Exponential growth
A) A stable limit cycle
B) Logistic growth
C) Dampened oscillations
D) Exponential growth
Unlock Deck
Unlock for access to all 68 flashcards in this deck.
Unlock Deck
k this deck
65
In a population of three asexual lizards, each lizard has a 40% probability of not producing any offspring. What is the probability that all three lizards will produce no offspring, thus ensuring the population's extinction?
A) 1%
B) 6.4%
C) 21.6%
D) 83.4%
A) 1%
B) 6.4%
C) 21.6%
D) 83.4%
Unlock Deck
Unlock for access to all 68 flashcards in this deck.
Unlock Deck
k this deck
66
Due to their low density, females of a species of turtles have difficulty finding mates. As a result, the population's growth rate has been low, despite ample resources. This is an example of
A) an Allee effect.
B) environmental stochasticity.
C) genetic drift.
D) isolation by distance.
A) an Allee effect.
B) environmental stochasticity.
C) genetic drift.
D) isolation by distance.
Unlock Deck
Unlock for access to all 68 flashcards in this deck.
Unlock Deck
k this deck
67
Which of the following would be an example of genetic drift?
A) Natural selection
B) Disease
C) Inbreeding
D) Lightning strike
A) Natural selection
B) Disease
C) Inbreeding
D) Lightning strike
Unlock Deck
Unlock for access to all 68 flashcards in this deck.
Unlock Deck
k this deck
68
Which of the following helped the Black Sea recover during the 1990s?
A) The rescue effect
B) Reduction in eutrophication
C) The arrival of another comb jelly that Mnemiopsis used as a food source
D) Warming of the ocean
A) The rescue effect
B) Reduction in eutrophication
C) The arrival of another comb jelly that Mnemiopsis used as a food source
D) Warming of the ocean
Unlock Deck
Unlock for access to all 68 flashcards in this deck.
Unlock Deck
k this deck
Unlock Deck
Unlock for access to all 68 flashcards in this deck.


