Exam 10: Population Dynamics
Exam 1: The Web of Life68 Questions
Exam 2: The Physical Environment76 Questions
Exam 3: The Biosphere73 Questions
Exam 4: Coping With Environmental Variation:74 Questions
Exam 5: Coping With Environmental Variation: Energy71 Questions
Exam 6: Evolution and Ecology68 Questions
Exam 7: Life History69 Questions
Exam 8: Behavioral Ecology71 Questions
Exam 9: Population Distribution and Abundance80 Questions
Exam 10: Population Dynamics68 Questions
Exam 11: Population Growth and Regulation69 Questions
Exam 12: Predation70 Questions
Exam 13: Parasitism72 Questions
Exam 14: Competition74 Questions
Exam 15: Mutualism and Commensalism71 Questions
Exam 16: The Nature of Communities71 Questions
Exam 17: Change in Communities73 Questions
Exam 18: Biogeography70 Questions
Exam 19: Species Diversity in Communities72 Questions
Exam 20: Production73 Questions
Exam 21: Energy Flow and Food Webs76 Questions
Exam 22: Nutrient Supply and Cycling76 Questions
Exam 23: Conservation Biology73 Questions
Exam 24: Landscape Ecology and Ecosystem Management71 Questions
Exam 25: Global Ecology74 Questions
Select questions type
Refer to the figures.
Figure 1
 Figure 2
 -Based on the changes in population size, during which time period(s) do you expect birth rates to be highest? During which time period(s) do you expect death rates to be highest? When should birth and death rates be most similar?
Free
(Essay)
4.9/5  (39)
(39)
Correct Answer: Verified
Periods of highest birth rate occur when population size is increasing most rapidly: times 3-5 and times 13-15. Periods of highest death rate occur when population size is decreasing most rapidly: between times 10 and 11. Periods where birth and death rates are similar occur when population size is closest to carrying capacity: times 8-10 and 18-20.
A population of lions in the Ngorongoro Crater of Tanzania is struggling to survive as a result of
Free
(Multiple Choice)
4.8/5 (39)
Correct Answer:Verified
B
In a population of three asexual lizards, each lizard has a 40% probability of not producing any offspring. What is the probability that all three lizards will produce no offspring, thus ensuring the population's extinction?
Free
(Multiple Choice)
4.9/5 (30)
Correct Answer:Verified
B
Refer to the figures.
Figure 1
 Figure 2
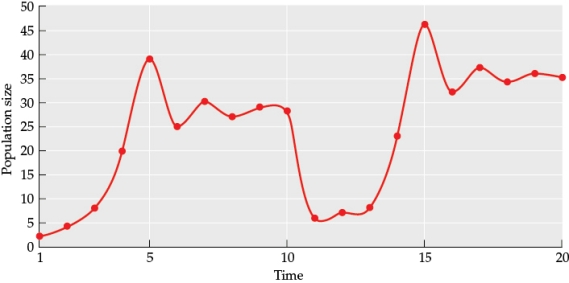 Figure 3
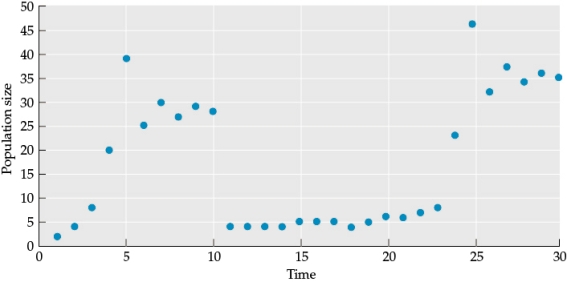 Suppose the population shows the pattern in Figure 3. Draw a new figure (this will be referred to as Figure 4) with a line that indicates how population size changed over time. What is the major difference between this pattern and the pattern in Figure 2? What are two factors that might be causing the pattern in Figure 4?
(Essay)
4.8/5 (33)
Suppose that only two females and a small number of males are left in a population of a highly endangered bird. Although all of these birds are healthy, by chance, both females fail to reproduce and the population goes extinct. This extinction is best described as a consequence of
(Multiple Choice)
4.8/5 (40)
Which of the following best describes an explosion of the number of individuals in a population?
(Multiple Choice)
4.9/5 (38)
Suppose you are studying two small lakes (lake 1 and lake 2) and how they change over time. A nearby farm accidentally spills fertilizer into lake 1. Around the same time, a non-native fish-eating turtle is introduced into lake 2. The ecosystems of both lakes are affected by these changes. What processes most likely explain how the lakes were affected?
(Multiple Choice)
5.0/5 (31)
During a hurricane, a large segment of an insect population is carried to a distant island where there are abundant resources and minimal predators. What type of growth would you likely expect in the time immediately following this colonization event?
(Multiple Choice)
4.9/5 (39)
Which pattern of population dynamics best describes the one exhibited by sheep introduced to the island of Tasmania?
(Multiple Choice)
4.8/5 (34)
Allstadt et al. (2013) found that population cycle collapse in Canadian populations of gypsy moths resulted from
(Multiple Choice)
4.8/5 (35)
When wolves were returned to Yellowstone National Park in 1995, they immediately began feeding on elk, reducing their numbers. This allowed aspen trees to increase in abundance, which ushered in the return of beaver populations. As beaver populations dammed streams, they slowed water flow and stabilized streambanks. The stabilization of streambanks increased riparian habitat in which songbirds could nest, and the ponds provided breeding habitat for amphibians. Explain this story using the concepts of top-down and bottom-up control.
(Essay)
4.9/5 (28)
The addition of excess nutrients into aquatic systems often disrupts the ecosystem. This phenomenon is known as
(Multiple Choice)
4.8/5 (28)
At low population densities, the flocking behavior of some species of birds is disrupted to the extent that the population growth rate is lower at very low densities than it is at somewhat higher densities. This is an example of
(Multiple Choice)
4.9/5 (37)
A population that experiences delayed density dependence will exhibit particular patterns of population dynamics depending upon r (the population growth rate under ideal conditions the time lag in the effects of density dependence). At low levels of this interaction, the population should exhibit _______; at intermediate levels, it should display _______; and at still higher levels, it should exhibit _______.
(Multiple Choice)
4.8/5 (36)
A population of blowflies experiences logistic growth with delayed density dependence. Suppose that this population has an initial size of 4,295 and follows the standard equation for delayed density dependence with a 10-week delay and an intrinsic growth rate of 0.2 per week. If these conditions remain constant and the population is tracked for a long time, what type of population dynamics should it display? (Note: The cutoff r value for dampened oscillations is 0.368, and the cutoff for a stable limit cycle is 1.57.)
(Multiple Choice)
4.7/5 (32)
Refer to the figure.
Figure 1
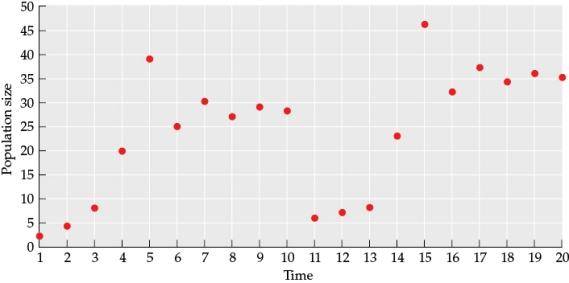 Use the data from the figure to draw a line graph (this will be referred to as Figure 2) that illustrates how population size changes over time. From time 1 to time 10, what type of logistic curve best fits this data? In your answer, address both the pattern of the line and the underlying cause of these patterns.
(Essay)
4.9/5 (38)
Although there are approximately 10,000 cheetahs left in the wild, biologists think that their numbers were much lower at some time in the past because cheetah populations have very little genetic variation. What is the most likely reason for the lack of genetic variability in cheetahs?
(Multiple Choice)
4.8/5 (25)
Refer to the figure.
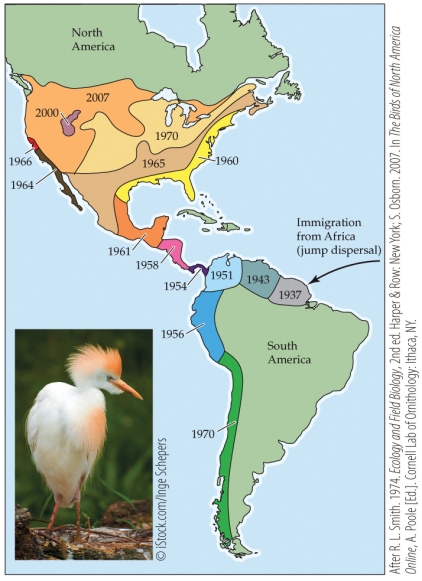 Based on the pattern seen in the figure, you could suggest that _______ growth and _______ population expansion was occurring.
(Multiple Choice)
4.8/5 (44)
In Nicholson's experiments with blowflies, population cycles most often occurred when adults
(Multiple Choice)
4.8/5 (36)
Filters
- Essay(0)
- Multiple Choice(0)
- Short Answer(0)
- True False(0)
- Matching(0)