Deck 9: Analyzing Inequalities in the Economy and at Work
Full screen (f)
Question
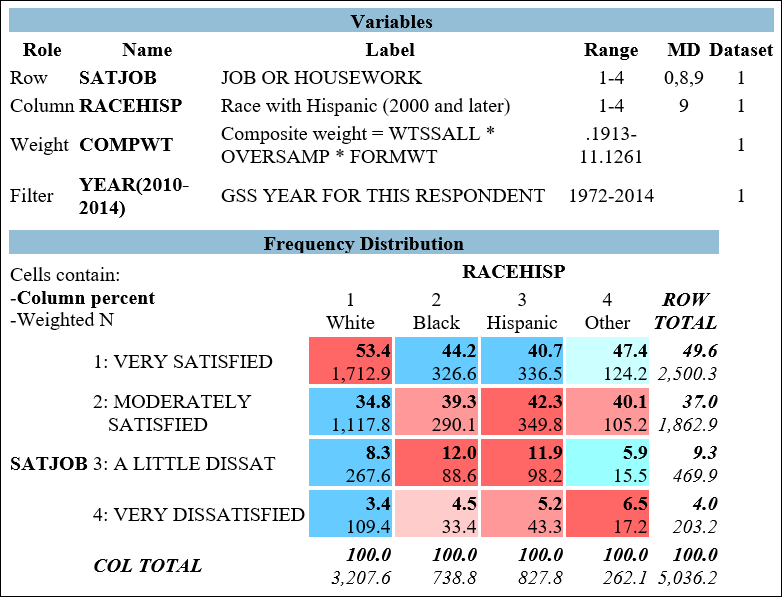 Figure 9.1 shows the relationship between respondents' racial/ethnic identity (RACEHISP) and their job satisfaction (SATJOB). produce a cross-tab that examines the relationship between the variables SATJOB and RACEHISP. Put SATJOB in the "Row" field and RACEHISP in the "Column" field. In the "Filter" field, type "YEAR (2010-2014)."
-The variable SATJOB is best described as:
A) a categorical-level variable.
B) an ordinal-level variable.
C) an interval-ratio-level variable.
D) a dummy variable.
Question
Figure 9.1 shows the relationship between respondents' racial/ethnic identity (RACEHISP) and their job satisfaction (SATJOB). produce a cross-tab that examines the relationship between the variables SATJOB and RACEHISP. Put SATJOB in the "Row" field and RACEHISP in the "Column" field. In the "Filter" field, type "YEAR (2010-2014)."-Scoring a 1 on the variable SATJOB indicates ____ levels of satisfaction, and scoring a 4 indicates ____ levels of satisfaction.
A) very high; very low
B) moderately high; moderately low
C) moderately low; moderately high
D) very low; very high
Question
Figure 9.1 shows the relationship between respondents' racial/ethnic identity (RACEHISP) and their job satisfaction (SATJOB). produce a cross-tab that examines the relationship between the variables SATJOB and RACEHISP. Put SATJOB in the "Row" field and RACEHISP in the "Column" field. In the "Filter" field, type "YEAR (2010-2014)."-What percentage of non-Hispanic white respondents are very satisfied with the work they do?
A) 49.6%
B) 53.4%
C) 63.7%
D) 68.5%
Question
Figure 9.1 shows the relationship between respondents' racial/ethnic identity (RACEHISP) and their job satisfaction (SATJOB). produce a cross-tab that examines the relationship between the variables SATJOB and RACEHISP. Put SATJOB in the "Row" field and RACEHISP in the "Column" field. In the "Filter" field, type "YEAR (2010-2014)."-What percentage of Hispanic respondents are very satisfied with the work they do?
A) 13.5%
B) 16.4%
C) 40.7%
D) 43.4%
Question
Figure 9.1 shows the relationship between respondents' racial/ethnic identity (RACEHISP) and their job satisfaction (SATJOB). produce a cross-tab that examines the relationship between the variables SATJOB and RACEHISP. Put SATJOB in the "Row" field and RACEHISP in the "Column" field. In the "Filter" field, type "YEAR (2010-2014)."-The modal category for the variable SATJOB is "very satisfied" for all racial/ethnic groups considered here, with the exception of:
A) whites
B) Blacks
C) Hispanics
D) others
Question
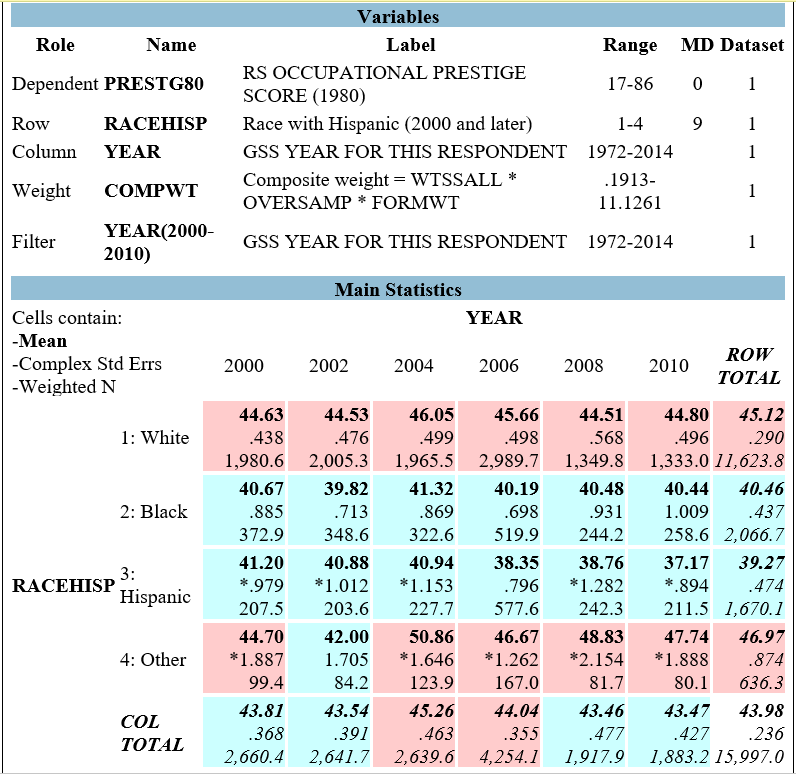 Figure 9.2 shows the results from a comparison of means, using occupational prestige (PRESTG80) as the dependent variable and respondents' racial-ethnic group (RACEHISP) as the independent variable. PRESTG80 is measured on a scale of 17 to 86, with higher scores representing higher levels of prestige.
-The variable RACEHISP is best described as:
A) a categorical-level variable.
B) an ordinal-level variable.
C) an interval-ratio-level variable.
D) a dummy variable.
Question
Figure 9.2 shows the results from a comparison of means, using occupational prestige (PRESTG80) as the dependent variable and respondents' racial-ethnic group (RACEHISP) as the independent variable. PRESTG80 is measured on a scale of 17 to 86, with higher scores representing higher levels of prestige.-In 2010, the average occupational prestige score for non-Hispanic white respondents was approximately:
A) 40.42
B) 44.80
C) 46.93
D) 49.38
Question
Figure 9.2 shows the results from a comparison of means, using occupational prestige (PRESTG80) as the dependent variable and respondents' racial-ethnic group (RACEHISP) as the independent variable. PRESTG80 is measured on a scale of 17 to 86, with higher scores representing higher levels of prestige.-In 2010, the average occupational prestige score for Hispanic/Latino/a respondents was approximately:
A) 37.17
B) 39.27
C) 42.4
D) 44.8
Question
Figure 9.2 shows the results from a comparison of means, using occupational prestige (PRESTG80) as the dependent variable and respondents' racial-ethnic group (RACEHISP) as the independent variable. PRESTG80 is measured on a scale of 17 to 86, with higher scores representing higher levels of prestige.-Which of the following sentences is true, based on the information presented in Figure 9.2?
A) For every year examined, non-Hispanic White respondents had mean occupational prestige scores higher than those of all Blacks, Hispanics and those identifying with other racial-ethnic groups?
B) The data represents approximately equal numbers of White, Black, and Hispanic respondents.
C) For every year examined, Black respondents had mean occupational prestige scores lower than those of non-Hispanic white respondents.
D) 44.63% of respondents surveyed in 2000 identified as being non-Hispanic and white.
Question
Figure 9.2 shows the results from a comparison of means, using occupational prestige (PRESTG80) as the dependent variable and respondents' racial-ethnic group (RACEHISP) as the independent variable. PRESTG80 is measured on a scale of 17 to 86, with higher scores representing higher levels of prestige.-The right-most column of the table shows that, for Black respondents, the "Row Total" is 40.46. Which of the following sentences best describes the meaning of this number?
A) From 2000 to 2010, the average occupational prestige score for Black respondents was 40.46.
B) From 2000 to 2010, the average occupational prestige of Black respondents was 40.46 units lower than the average occupational prestige of white respondents.
C) From 2000 to 2010, approximately 40.46% of Black respondents were working in jobs that had high levels of occupational prestige.
D) From 2000 to 2010, approximately 40.46% of Black respondents were working in jobs that had low levels of occupational prestige.

Unlock Deck
Sign up to unlock the cards in this deck!
Unlock Deck
Unlock Deck
1/10
Play
Full screen (f)
Deck 9: Analyzing Inequalities in the Economy and at Work
1
Figure 9.1 shows the relationship between respondents' racial/ethnic identity (RACEHISP) and their job satisfaction (SATJOB). produce a cross-tab that examines the relationship between the variables SATJOB and RACEHISP. Put SATJOB in the "Row" field and RACEHISP in the "Column" field. In the "Filter" field, type "YEAR (2010-2014)."-The variable SATJOB is best described as:
A) a categorical-level variable.
B) an ordinal-level variable.
C) an interval-ratio-level variable.
D) a dummy variable.
B
2
Figure 9.1 shows the relationship between respondents' racial/ethnic identity (RACEHISP) and their job satisfaction (SATJOB). produce a cross-tab that examines the relationship between the variables SATJOB and RACEHISP. Put SATJOB in the "Row" field and RACEHISP in the "Column" field. In the "Filter" field, type "YEAR (2010-2014)."-Scoring a 1 on the variable SATJOB indicates ____ levels of satisfaction, and scoring a 4 indicates ____ levels of satisfaction.
A) very high; very low
B) moderately high; moderately low
C) moderately low; moderately high
D) very low; very high
A
3
Figure 9.1 shows the relationship between respondents' racial/ethnic identity (RACEHISP) and their job satisfaction (SATJOB). produce a cross-tab that examines the relationship between the variables SATJOB and RACEHISP. Put SATJOB in the "Row" field and RACEHISP in the "Column" field. In the "Filter" field, type "YEAR (2010-2014)."-What percentage of non-Hispanic white respondents are very satisfied with the work they do?
A) 49.6%
B) 53.4%
C) 63.7%
D) 68.5%
B
4
Figure 9.1 shows the relationship between respondents' racial/ethnic identity (RACEHISP) and their job satisfaction (SATJOB). produce a cross-tab that examines the relationship between the variables SATJOB and RACEHISP. Put SATJOB in the "Row" field and RACEHISP in the "Column" field. In the "Filter" field, type "YEAR (2010-2014)."-What percentage of Hispanic respondents are very satisfied with the work they do?
A) 13.5%
B) 16.4%
C) 40.7%
D) 43.4%
Unlock Deck
Unlock for access to all 10 flashcards in this deck.
Unlock Deck
k this deck
5
Figure 9.1 shows the relationship between respondents' racial/ethnic identity (RACEHISP) and their job satisfaction (SATJOB). produce a cross-tab that examines the relationship between the variables SATJOB and RACEHISP. Put SATJOB in the "Row" field and RACEHISP in the "Column" field. In the "Filter" field, type "YEAR (2010-2014)."-The modal category for the variable SATJOB is "very satisfied" for all racial/ethnic groups considered here, with the exception of:
A) whites
B) Blacks
C) Hispanics
D) others
Unlock Deck
Unlock for access to all 10 flashcards in this deck.
Unlock Deck
k this deck
6
Figure 9.2 shows the results from a comparison of means, using occupational prestige (PRESTG80) as the dependent variable and respondents' racial-ethnic group (RACEHISP) as the independent variable. PRESTG80 is measured on a scale of 17 to 86, with higher scores representing higher levels of prestige.-The variable RACEHISP is best described as:
A) a categorical-level variable.
B) an ordinal-level variable.
C) an interval-ratio-level variable.
D) a dummy variable.
Unlock Deck
Unlock for access to all 10 flashcards in this deck.
Unlock Deck
k this deck
7
Figure 9.2 shows the results from a comparison of means, using occupational prestige (PRESTG80) as the dependent variable and respondents' racial-ethnic group (RACEHISP) as the independent variable. PRESTG80 is measured on a scale of 17 to 86, with higher scores representing higher levels of prestige.-In 2010, the average occupational prestige score for non-Hispanic white respondents was approximately:
A) 40.42
B) 44.80
C) 46.93
D) 49.38
Unlock Deck
Unlock for access to all 10 flashcards in this deck.
Unlock Deck
k this deck
8
Figure 9.2 shows the results from a comparison of means, using occupational prestige (PRESTG80) as the dependent variable and respondents' racial-ethnic group (RACEHISP) as the independent variable. PRESTG80 is measured on a scale of 17 to 86, with higher scores representing higher levels of prestige.-In 2010, the average occupational prestige score for Hispanic/Latino/a respondents was approximately:
A) 37.17
B) 39.27
C) 42.4
D) 44.8
Unlock Deck
Unlock for access to all 10 flashcards in this deck.
Unlock Deck
k this deck
9
Figure 9.2 shows the results from a comparison of means, using occupational prestige (PRESTG80) as the dependent variable and respondents' racial-ethnic group (RACEHISP) as the independent variable. PRESTG80 is measured on a scale of 17 to 86, with higher scores representing higher levels of prestige.-Which of the following sentences is true, based on the information presented in Figure 9.2?
A) For every year examined, non-Hispanic White respondents had mean occupational prestige scores higher than those of all Blacks, Hispanics and those identifying with other racial-ethnic groups?
B) The data represents approximately equal numbers of White, Black, and Hispanic respondents.
C) For every year examined, Black respondents had mean occupational prestige scores lower than those of non-Hispanic white respondents.
D) 44.63% of respondents surveyed in 2000 identified as being non-Hispanic and white.
Unlock Deck
Unlock for access to all 10 flashcards in this deck.
Unlock Deck
k this deck
10
Figure 9.2 shows the results from a comparison of means, using occupational prestige (PRESTG80) as the dependent variable and respondents' racial-ethnic group (RACEHISP) as the independent variable. PRESTG80 is measured on a scale of 17 to 86, with higher scores representing higher levels of prestige.-The right-most column of the table shows that, for Black respondents, the "Row Total" is 40.46. Which of the following sentences best describes the meaning of this number?
A) From 2000 to 2010, the average occupational prestige score for Black respondents was 40.46.
B) From 2000 to 2010, the average occupational prestige of Black respondents was 40.46 units lower than the average occupational prestige of white respondents.
C) From 2000 to 2010, approximately 40.46% of Black respondents were working in jobs that had high levels of occupational prestige.
D) From 2000 to 2010, approximately 40.46% of Black respondents were working in jobs that had low levels of occupational prestige.
Unlock Deck
Unlock for access to all 10 flashcards in this deck.
Unlock Deck
k this deck
Unlock Deck
Unlock for access to all 10 flashcards in this deck.


