Exam 9: Analyzing Inequalities in the Economy and at Work
Exam 1: An Introduction to Analyzing Inequalities10 Questions
Exam 2: Understanding Data: Critical Concepts10 Questions
Exam 3: Analyzing Gender With the GSS10 Questions
Exam 4: Analyzing Race and Ethnicity With the GSS10 Questions
Exam 5: Analyzing Class With the GSS10 Questions
Exam 6: Analyzing Sexuality With the GSS10 Questions
Exam 7: Analyzing Inequalities in Families10 Questions
Exam 8: Analyzing Inequalities in Education10 Questions
Exam 9: Analyzing Inequalities in the Economy and at Work10 Questions
Select questions type
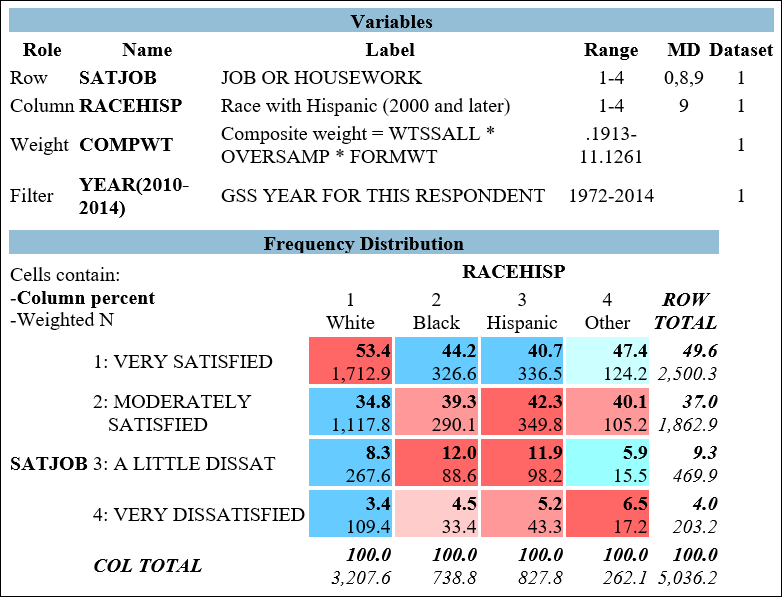 Figure 9.1 shows the relationship between respondents' racial/ethnic identity (RACEHISP) and their job satisfaction (SATJOB). produce a cross-tab that examines the relationship between the variables SATJOB and RACEHISP. Put SATJOB in the "Row" field and RACEHISP in the "Column" field. In the "Filter" field, type "YEAR (2010-2014)."
-What percentage of Hispanic respondents are very satisfied with the work they do?
Figure 9.1 shows the relationship between respondents' racial/ethnic identity (RACEHISP) and their job satisfaction (SATJOB). produce a cross-tab that examines the relationship between the variables SATJOB and RACEHISP. Put SATJOB in the "Row" field and RACEHISP in the "Column" field. In the "Filter" field, type "YEAR (2010-2014)."
-What percentage of Hispanic respondents are very satisfied with the work they do?
Free
(Multiple Choice)
4.9/5  (41)
(41)
Correct Answer: Verified
C
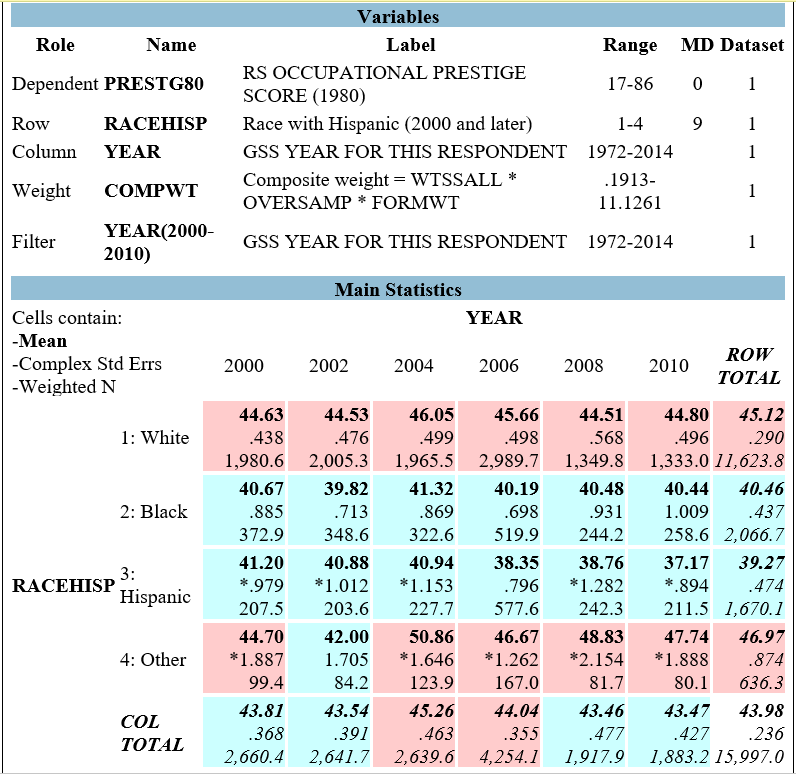 Figure 9.2 shows the results from a comparison of means, using occupational prestige (PRESTG80) as the dependent variable and respondents' racial-ethnic group (RACEHISP) as the independent variable. PRESTG80 is measured on a scale of 17 to 86, with higher scores representing higher levels of prestige.
-In 2010, the average occupational prestige score for non-Hispanic white respondents was approximately:
Figure 9.2 shows the results from a comparison of means, using occupational prestige (PRESTG80) as the dependent variable and respondents' racial-ethnic group (RACEHISP) as the independent variable. PRESTG80 is measured on a scale of 17 to 86, with higher scores representing higher levels of prestige.
-In 2010, the average occupational prestige score for non-Hispanic white respondents was approximately:
Free
(Multiple Choice)
4.8/5 (31)
Correct Answer:Verified
B
Figure 9.1 shows the relationship between respondents' racial/ethnic identity (RACEHISP) and their job satisfaction (SATJOB). produce a cross-tab that examines the relationship between the variables SATJOB and RACEHISP. Put SATJOB in the "Row" field and RACEHISP in the "Column" field. In the "Filter" field, type "YEAR (2010-2014)."
-What percentage of non-Hispanic white respondents are very satisfied with the work they do?
Free
(Multiple Choice)
4.8/5 (33)
Correct Answer:Verified
B
Figure 9.1 shows the relationship between respondents' racial/ethnic identity (RACEHISP) and their job satisfaction (SATJOB). produce a cross-tab that examines the relationship between the variables SATJOB and RACEHISP. Put SATJOB in the "Row" field and RACEHISP in the "Column" field. In the "Filter" field, type "YEAR (2010-2014)."
-The variable SATJOB is best described as:
(Multiple Choice)
4.8/5 (32)
Figure 9.2 shows the results from a comparison of means, using occupational prestige (PRESTG80) as the dependent variable and respondents' racial-ethnic group (RACEHISP) as the independent variable. PRESTG80 is measured on a scale of 17 to 86, with higher scores representing higher levels of prestige.
-In 2010, the average occupational prestige score for Hispanic/Latino/a respondents was approximately:
(Multiple Choice)
4.8/5 (33)
Figure 9.1 shows the relationship between respondents' racial/ethnic identity (RACEHISP) and their job satisfaction (SATJOB). produce a cross-tab that examines the relationship between the variables SATJOB and RACEHISP. Put SATJOB in the "Row" field and RACEHISP in the "Column" field. In the "Filter" field, type "YEAR (2010-2014)."
-The modal category for the variable SATJOB is "very satisfied" for all racial/ethnic groups considered here, with the exception of:
(Multiple Choice)
4.8/5 (32)
Figure 9.2 shows the results from a comparison of means, using occupational prestige (PRESTG80) as the dependent variable and respondents' racial-ethnic group (RACEHISP) as the independent variable. PRESTG80 is measured on a scale of 17 to 86, with higher scores representing higher levels of prestige.
-Which of the following sentences is true, based on the information presented in Figure 9.2?
(Multiple Choice)
4.7/5 (36)
Figure 9.2 shows the results from a comparison of means, using occupational prestige (PRESTG80) as the dependent variable and respondents' racial-ethnic group (RACEHISP) as the independent variable. PRESTG80 is measured on a scale of 17 to 86, with higher scores representing higher levels of prestige.
-The right-most column of the table shows that, for Black respondents, the "Row Total" is 40.46. Which of the following sentences best describes the meaning of this number?
(Multiple Choice)
4.7/5 (40)
Figure 9.1 shows the relationship between respondents' racial/ethnic identity (RACEHISP) and their job satisfaction (SATJOB). produce a cross-tab that examines the relationship between the variables SATJOB and RACEHISP. Put SATJOB in the "Row" field and RACEHISP in the "Column" field. In the "Filter" field, type "YEAR (2010-2014)."
-Scoring a 1 on the variable SATJOB indicates ____ levels of satisfaction, and scoring a 4 indicates ____ levels of satisfaction.
(Multiple Choice)
4.8/5 (47)
Figure 9.2 shows the results from a comparison of means, using occupational prestige (PRESTG80) as the dependent variable and respondents' racial-ethnic group (RACEHISP) as the independent variable. PRESTG80 is measured on a scale of 17 to 86, with higher scores representing higher levels of prestige.
-The variable RACEHISP is best described as:
(Multiple Choice)
4.8/5 (33)
Filters
- Essay(0)
- Multiple Choice(0)
- Short Answer(0)
- True False(0)
- Matching(0)