Deck 4: Estimating With Uncertainty
Full screen (f)
Question
Question
Question
Question
Question
Question
Question
Question
Question
Question
Question
Question
Question
Question
Question
Question
Question
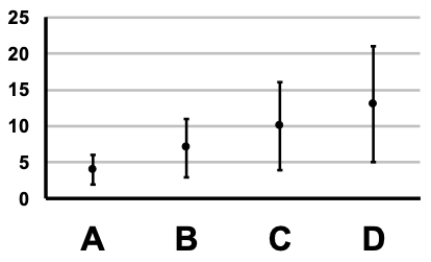
The mean and standard error bars for four data sets are shown in the figure. Which of the data sets most likely has a standard deviation of 40 and a sample size of 25?

A) Plot A
B) Plot B
C) Plot C
D) Plot D
A) Plot A
B) Plot B
C) Plot C
D) Plot D
Question
The mean and standard error bars for four data sets are shown in the figure. Which of the data sets most likely has a standard deviation of 56 and a sample size of 47?

A) Plot A
B) Plot B
C) Plot C
D) Plot D
A) Plot A
B) Plot B
C) Plot C
D) Plot D
Question
The mean and standard error bars for four data sets are shown in the figure. Which of the data sets most likely has a variance of 64 and a sample size of 16?
A) Plot A
B) Plot B
C) Plot C
D) Plot D
A) Plot A
B) Plot B
C) Plot C
D) Plot D
Question
The mean and standard error bars for four data sets are shown in the figure. Which of the data sets most likely has a variance of 144 and a sample size of 4?

A) Plot A
B) Plot B
C) Plot C
D) Plot D
A) Plot A
B) Plot B
C) Plot C
D) Plot D
Question
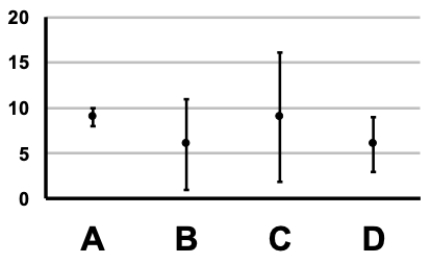
The mean and 95% confidence interval bars for four data sets are shown in the figure. Which of the data sets most likely has a standard deviation of 4 and a sample size of 64?

A) Plot A
B) Plot B
C) Plot C
D) Plot D
A) Plot A
B) Plot B
C) Plot C
D) Plot D
Question
The mean and 95% confidence interval bars for four data sets are shown in the figure. Which of the data sets most likely has a standard deviation of 32 and a sample size of 81?
A) Plot A
B) Plot B
C) Plot C
D) Plot D
A) Plot A
B) Plot B
C) Plot C
D) Plot D
Question
The mean and 95% confidence interval bars for four data sets are shown in the figure. Which of the data sets most likely has a variance of 81 and a sample size of 36?

A) Plot A
B) Plot B
C) Plot C
D) Plot D
A) Plot A
B) Plot B
C) Plot C
D) Plot D
Question
The mean and 95% confidence interval bars for four data sets are shown in the figure. Which of the data sets most likely has a variance of 100 and a sample size of 16?

A) Plot A
B) Plot B
C) Plot C
D) Plot D
A) Plot A
B) Plot B
C) Plot C
D) Plot D
Question
Question
Question
Question
Question
Question
Question
Question
Question
Question
Question
Question
Question
Question
Question
Question
Question
Question
Question
Question
Question
Question
Question

Unlock Deck
Sign up to unlock the cards in this deck!
Unlock Deck
Unlock Deck
1/47
Play
Full screen (f)
Deck 4: Estimating With Uncertainty
1
The population of all sample means that could be obtained from a population is called which of the following?
A) The estimation distribution of a population's mean.
B) The population distribution of a mean.
C) The sampling distribution of a population's mean.
D) The universe of probabilities.
A) The estimation distribution of a population's mean.
B) The population distribution of a mean.
C) The sampling distribution of a population's mean.
D) The universe of probabilities.
C
2
Which of the following describes the width of the sampling distribution of the population mean?
A) Sampling deviation.
B) Sampling error.
C) Standard deviation.
D) Standard error.
A) Sampling deviation.
B) Sampling error.
C) Standard deviation.
D) Standard error.
D
3
What is the standard error for a sample of size 20 that has a standard deviation of 40?
A) 1.00
B) 3.16
C) 4.47
D) 8.94
A) 1.00
B) 3.16
C) 4.47
D) 8.94
D
4
What is the standard error for a sample of size 33 that has a standard deviation of 56?
A) 1.70
B) 9.75
C) 12.24
D) 42.99
A) 1.70
B) 9.75
C) 12.24
D) 42.99
Unlock Deck
Unlock for access to all 47 flashcards in this deck.
Unlock Deck
k this deck
5
If a sample with 40 values has a standard deviation of 16, what would the standard error be?
A) 2.5
B) 5.0
C) 7.5
D) 10.0
A) 2.5
B) 5.0
C) 7.5
D) 10.0
Unlock Deck
Unlock for access to all 47 flashcards in this deck.
Unlock Deck
k this deck
6
If a sample with 16 values has a standard deviation of 47, what would the standard error be?
A) 2.29
B) 2.94
C) 11.75
D) 11.98
A) 2.29
B) 2.94
C) 11.75
D) 11.98
Unlock Deck
Unlock for access to all 47 flashcards in this deck.
Unlock Deck
k this deck
7
If a sample with a standard deviation of 16 has a standard error of approximately 4.62, what would the most likely sample size be?
A) 8
B) 10
C) 12
D) 14
A) 8
B) 10
C) 12
D) 14
Unlock Deck
Unlock for access to all 47 flashcards in this deck.
Unlock Deck
k this deck
8
If a sample with a standard deviation of 25 has a standard error of approximately 5.6, what would the most likely sample size be?
A) 14
B) 16
C) 18
D) 20
A) 14
B) 16
C) 18
D) 20
Unlock Deck
Unlock for access to all 47 flashcards in this deck.
Unlock Deck
k this deck
9
Which of the following best describes a confidence interval?
A) A range of values around a population parameter that is likely to contain the sample estimate.
B) A range of values around a sample estimate that is likely to contain the population parameter.
C) The width of the region within which the population mean lies.
D) The width of the region within which the sample mean lies.
Unlock Deck
Unlock for access to all 47 flashcards in this deck.
Unlock Deck
k this deck
10
Which of the following is the best statement regarding the confidence interval for a mean with a lower limit of 20 and an upper limit of 30?
A) We are 95% confident that the population mean lies between 20 and 30.
B) We are 95% confident that the sample mean lies between 20 and 30.
C) There is a 95% probability that the population mean lies between 20 and 30.
D) There is a 95% probability that the sample mean lies between 20 and 30.
A) We are 95% confident that the population mean lies between 20 and 30.
B) We are 95% confident that the sample mean lies between 20 and 30.
C) There is a 95% probability that the population mean lies between 20 and 30.
D) There is a 95% probability that the sample mean lies between 20 and 30.
Unlock Deck
Unlock for access to all 47 flashcards in this deck.
Unlock Deck
k this deck
11
For a sample with a mean of 32 and a standard error of 5, which of the following is the best approximation for the 95% confidence interval of the population mean?
A) 22 < μ < 42
B) 27 < μ < 37
C) 27 < μ < 47
D) 32 < μ < 42
A) 22 < μ < 42
B) 27 < μ < 37
C) 27 < μ < 47
D) 32 < μ < 42
Unlock Deck
Unlock for access to all 47 flashcards in this deck.
Unlock Deck
k this deck
12
For a sample with a mean of 16 and a standard error of 4, which of the following is the best approximation for the 95% confidence interval of the population mean?
A) 4 < μ < 16
B) 8 < μ < 20
C) 8 < μ < 24
D) 12 < μ < 20
A) 4 < μ < 16
B) 8 < μ < 20
C) 8 < μ < 24
D) 12 < μ < 20
Unlock Deck
Unlock for access to all 47 flashcards in this deck.
Unlock Deck
k this deck
13
If a sample with a standard deviation of 16 has a confidence interval of approximately 3.2 < μ < 16.8, what would the most likely sample size be?
A) 20
B) 22
C) 24
D) 26
A) 20
B) 22
C) 24
D) 26
Unlock Deck
Unlock for access to all 47 flashcards in this deck.
Unlock Deck
k this deck
14
If a sample with a standard deviation of 20 has a confidence interval of approximately 11.14 < μ < 24.86, what would the most likely sample size be?
A) 34
B) 36
C) 38
D) 10
A) 34
B) 36
C) 38
D) 10
Unlock Deck
Unlock for access to all 47 flashcards in this deck.
Unlock Deck
k this deck
15
If a sample of size of 20 has a confidence interval of approximately 15.8 < μ < 38.2, what would the most likely standard deviation be?
A) 19
B) 21
C) 23
D) 25
A) 19
B) 21
C) 23
D) 25
Unlock Deck
Unlock for access to all 47 flashcards in this deck.
Unlock Deck
k this deck
16
If a sample of size of 30 has a confidence interval of approximately 10.58 < μ < 16.42, what would the most likely standard deviation be?
A) 6
B) 7
C) 8
D) 9
A) 6
B) 7
C) 8
D) 9
Unlock Deck
Unlock for access to all 47 flashcards in this deck.
Unlock Deck
k this deck
17
The mean and standard error bars for four data sets are shown in the figure. Which of the data sets most likely has a standard deviation of 40 and a sample size of 25?
A) Plot A
B) Plot B
C) Plot C
D) Plot D
A) Plot A
B) Plot B
C) Plot C
D) Plot D
Unlock Deck
Unlock for access to all 47 flashcards in this deck.
Unlock Deck
k this deck
18
The mean and standard error bars for four data sets are shown in the figure. Which of the data sets most likely has a standard deviation of 56 and a sample size of 47?
A) Plot A
B) Plot B
C) Plot C
D) Plot D
A) Plot A
B) Plot B
C) Plot C
D) Plot D
Unlock Deck
Unlock for access to all 47 flashcards in this deck.
Unlock Deck
k this deck
19
The mean and standard error bars for four data sets are shown in the figure. Which of the data sets most likely has a variance of 64 and a sample size of 16?
A) Plot A
B) Plot B
C) Plot C
D) Plot D
A) Plot A
B) Plot B
C) Plot C
D) Plot D
Unlock Deck
Unlock for access to all 47 flashcards in this deck.
Unlock Deck
k this deck
20
The mean and standard error bars for four data sets are shown in the figure. Which of the data sets most likely has a variance of 144 and a sample size of 4?
A) Plot A
B) Plot B
C) Plot C
D) Plot D
A) Plot A
B) Plot B
C) Plot C
D) Plot D
Unlock Deck
Unlock for access to all 47 flashcards in this deck.
Unlock Deck
k this deck
21
The mean and 95% confidence interval bars for four data sets are shown in the figure. Which of the data sets most likely has a standard deviation of 4 and a sample size of 64?
A) Plot A
B) Plot B
C) Plot C
D) Plot D
A) Plot A
B) Plot B
C) Plot C
D) Plot D
Unlock Deck
Unlock for access to all 47 flashcards in this deck.
Unlock Deck
k this deck
22
The mean and 95% confidence interval bars for four data sets are shown in the figure. Which of the data sets most likely has a standard deviation of 32 and a sample size of 81?
A) Plot A
B) Plot B
C) Plot C
D) Plot D
A) Plot A
B) Plot B
C) Plot C
D) Plot D
Unlock Deck
Unlock for access to all 47 flashcards in this deck.
Unlock Deck
k this deck
23
The mean and 95% confidence interval bars for four data sets are shown in the figure. Which of the data sets most likely has a variance of 81 and a sample size of 36?
A) Plot A
B) Plot B
C) Plot C
D) Plot D
A) Plot A
B) Plot B
C) Plot C
D) Plot D
Unlock Deck
Unlock for access to all 47 flashcards in this deck.
Unlock Deck
k this deck
24
The mean and 95% confidence interval bars for four data sets are shown in the figure. Which of the data sets most likely has a variance of 100 and a sample size of 16?
A) Plot A
B) Plot B
C) Plot C
D) Plot D
A) Plot A
B) Plot B
C) Plot C
D) Plot D
Unlock Deck
Unlock for access to all 47 flashcards in this deck.
Unlock Deck
k this deck
25
The symbol Ȳ represents the population mean.
Unlock Deck
Unlock for access to all 47 flashcards in this deck.
Unlock Deck
k this deck
26
The symbol σ represents the population standard deviation.
Unlock Deck
Unlock for access to all 47 flashcards in this deck.
Unlock Deck
k this deck
27
The term estimation describes the process of inferring a sample value from population data.
Unlock Deck
Unlock for access to all 47 flashcards in this deck.
Unlock Deck
k this deck
28
The sampling distribution of an estimate is the mean and variance of the sample.
Unlock Deck
Unlock for access to all 47 flashcards in this deck.
Unlock Deck
k this deck
29
The larger the sample size, the narrower the sampling distribution of the population mean.
Unlock Deck
Unlock for access to all 47 flashcards in this deck.
Unlock Deck
k this deck
30
The standard error of the mean is the standard deviation of the sampling distribution for a population mean.
Unlock Deck
Unlock for access to all 47 flashcards in this deck.
Unlock Deck
k this deck
31
The 95% confidence interval is best thought of as the region within which there is a 95% probability that the population mean lies.
Unlock Deck
Unlock for access to all 47 flashcards in this deck.
Unlock Deck
k this deck
32
The 95% confidence interval is best thought of as the region within which we are 95% confident the population mean lies.
Unlock Deck
Unlock for access to all 47 flashcards in this deck.
Unlock Deck
k this deck
33
A quick and dirty approximation for the 95% confidence interval is to add and subtract the standard error from the sample mean.
Unlock Deck
Unlock for access to all 47 flashcards in this deck.
Unlock Deck
k this deck
34
Error bars on a graph typically indicate the variance of the data values.
Unlock Deck
Unlock for access to all 47 flashcards in this deck.
Unlock Deck
k this deck
35
If a sample has a standard deviation of 7 and a sample size of 4, it will have a standard error of 3.5.
Unlock Deck
Unlock for access to all 47 flashcards in this deck.
Unlock Deck
k this deck
36
If a sample has a standard deviation of 9 and a sample size of 9, it will have a standard error of 1.0.
Unlock Deck
Unlock for access to all 47 flashcards in this deck.
Unlock Deck
k this deck
37
The standard deviation measures the spread of the data values, whereas the standard error measures the uncertainty in our estimate of the population mean.
Unlock Deck
Unlock for access to all 47 flashcards in this deck.
Unlock Deck
k this deck
38
It is possible for the standard deviation and standard error values in a data set with multiple values to be equal.
Unlock Deck
Unlock for access to all 47 flashcards in this deck.
Unlock Deck
k this deck
39
It is possible for the variance and standard error values in a data set with multiple values to be equal.
Unlock Deck
Unlock for access to all 47 flashcards in this deck.
Unlock Deck
k this deck
40
Describe the relationship between a population and a sample with respect to how the word "estimation" is used.
Unlock Deck
Unlock for access to all 47 flashcards in this deck.
Unlock Deck
k this deck
41
Compare and contrast the terms standard deviation and standard error. What is their relationship, and what do they represent?
Unlock Deck
Unlock for access to all 47 flashcards in this deck.
Unlock Deck
k this deck
42
Describe, using technical terms, why a larger sample size results in a more precise estimate of the population mean.
Unlock Deck
Unlock for access to all 47 flashcards in this deck.
Unlock Deck
k this deck
43
Sketch a figure showing the mean and standard error values for two data sets using filled black circles and error bars. For the first, the mean is 25, the standard deviation is 9, and the sample size is 9. For the second, the mean is 20, the standard deviation is 35, and the sample size is 25.
Unlock Deck
Unlock for access to all 47 flashcards in this deck.
Unlock Deck
k this deck
44
Sketch a figure showing the mean and 95% confidence intervals for two data sets using filled black circles and error bars. For the first, the mean is 30, the standard deviation is 10, and the sample size is 16. For the second, the mean is 40, the standard deviation is 18, and the sample size is 36.
Unlock Deck
Unlock for access to all 47 flashcards in this deck.
Unlock Deck
k this deck
45
If a data set is reported as having a 95% confidence interval from 15 to 23, what does that mean?
Unlock Deck
Unlock for access to all 47 flashcards in this deck.
Unlock Deck
k this deck
46
If the 95% confidence interval for a data set with a variance of 1600 is approximately 5 < μ < 25, what is the most likely sample size?
Unlock Deck
Unlock for access to all 47 flashcards in this deck.
Unlock Deck
k this deck
47
In your own words, describe a pair of similar experiments in which one suffers from pseudoreplication while the other does not.
Unlock Deck
Unlock for access to all 47 flashcards in this deck.
Unlock Deck
k this deck
Unlock Deck
Unlock for access to all 47 flashcards in this deck.


