Exam 4: Estimating With Uncertainty
Exam 1: Statistics and Samples36 Questions
Exam 2: Displaying Data55 Questions
Exam 3: Describing Data49 Questions
Exam 4: Estimating With Uncertainty47 Questions
Exam 5: Probability50 Questions
Exam 6: Hypothesis Testing40 Questions
Exam 7: Analyzing Proportions54 Questions
Exam 8: Fitting Probability Models to Frequency Data53 Questions
Exam 9: Contingency Analysis: Associations Between56 Questions
Exam 10: The Normal Distribution51 Questions
Exam 11: Inference for a Normal Population46 Questions
Exam 12: Comparing Two Means53 Questions
Exam 13: Handling Violations of Assumptions38 Questions
Exam 14: Designing Experiments56 Questions
Exam 15: Comparing Means of More Than Two Groups54 Questions
Exam 16: Correlation Between Numerical Variables49 Questions
Exam 17: Regression54 Questions
Exam 18: Multiple Explanatory Variables47 Questions
Exam 19: Computer-Intensive Methods25 Questions
Exam 20: Likelihood33 Questions
Exam 21: Meta-Analysis: Combining Information From38 Questions
Select questions type
It is possible for the standard deviation and standard error values in a data set with multiple values to be equal.
Free
(True/False)
4.9/5  (47)
(47)
Correct Answer: Verified
False
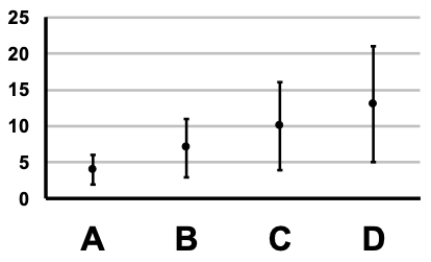
The mean and standard error bars for four data sets are shown in the figure. Which of the data sets most likely has a variance of 64 and a sample size of 16?
Free
(Multiple Choice)
4.9/5 (40)
Correct Answer:Verified
A
If a sample with 40 values has a standard deviation of 16, what would the standard error be?
Free
(Multiple Choice)
4.9/5 (39)
Correct Answer:Verified
A
Sketch a figure showing the mean and standard error values for two data sets using filled black circles and error bars. For the first, the mean is 25, the standard deviation is 9, and the sample size is 9. For the second, the mean is 20, the standard deviation is 35, and the sample size is 25.
(Essay)
4.9/5 (30)
The standard deviation measures the spread of the data values, whereas the standard error measures the uncertainty in our estimate of the population mean.
(True/False)
4.8/5 (25)
If a sample with 16 values has a standard deviation of 47, what would the standard error be?
(Multiple Choice)
4.9/5 (30)
The sampling distribution of an estimate is the mean and variance of the sample.
(True/False)
4.8/5 (34)
The 95% confidence interval is best thought of as the region within which there is a 95% probability that the population mean lies.
(True/False)
4.9/5 (37)
Describe the relationship between a population and a sample with respect to how the word "estimation" is used.
(Essay)
4.7/5 (37)
What is the standard error for a sample of size 20 that has a standard deviation of 40?
(Multiple Choice)
4.9/5 (24)
If a sample with a standard deviation of 20 has a confidence interval of approximately 11.14 < μ < 24.86, what would the most likely sample size be?
(Multiple Choice)
4.8/5 (31)
Which of the following best describes a confidence interval?
(Multiple Choice)
4.8/5 (30)
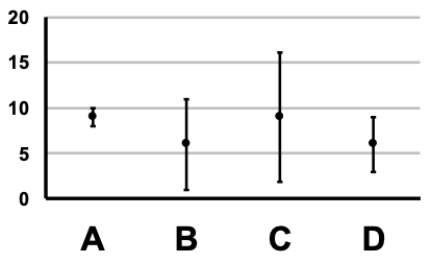
The mean and 95% confidence interval bars for four data sets are shown in the figure. Which of the data sets most likely has a variance of 81 and a sample size of 36?
(Multiple Choice)
4.8/5 (32)
If a sample with a standard deviation of 25 has a standard error of approximately 5.6, what would the most likely sample size be?
(Multiple Choice)
4.9/5 (30)
The 95% confidence interval is best thought of as the region within which we are 95% confident the population mean lies.
(True/False)
4.9/5 (37)
If a sample of size of 30 has a confidence interval of approximately 10.58 < μ < 16.42, what would the most likely standard deviation be?
(Multiple Choice)
4.8/5 (43)
It is possible for the variance and standard error values in a data set with multiple values to be equal.
(True/False)
4.9/5 (29)
Which of the following is the best statement regarding the confidence interval for a mean with a lower limit of 20 and an upper limit of 30?
(Multiple Choice)
4.8/5 (36)
Filters
- Essay(0)
- Multiple Choice(0)
- Short Answer(0)
- True False(0)
- Matching(0)