Deck 19: Computer-Intensive Methods
Full screen (f)
Question
Question
Question
Question
Question
Question
Question
Question
Question
Question
Question
Question
Question
Question
Question
Question
Question
Question
Question
Question
Question
Question
Question
Question
Consider the two data sets shown. Imagine that we are interested if the mean of the second population is larger than the mean of the first population and we wish to test this using the bootstrap procedure. We will use a one-tailed approach with the alternative hypothesis being a situation in which the mean of the second population exceeds the first.
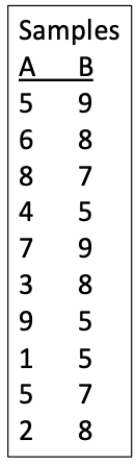
a.Calculate the difference in means between the two data sets. Is this consistent with the null hypothesis or the alternative hypothesis?
b.Perform a single bootstrap and calculate the difference between the means of the two groups. Use the first set of digits from π below as a method to generate the appropriate random numbers for each group (treat zeroes as a 10) and then sequentially choose the appropriate number of bootstrap values from each sample, starting with the first sample. Clearly show which values you use and how (i.e., show your work).
c.Is the difference in means from part (b) consistent with the null or alternative hypothesis?
d.What would our conclusion be if we performed 99 more replicates and they showed the same general pattern (i.e., the sign of the difference) as in part (c)?
π = 31415926535897932384626433
Question
Consider the two data sets shown. Imagine that we are interested if the mean of the second population is larger than the mean of the first population and we wish to test this using the bootstrap procedure. We will use a one-tailed approach with the alternative hypothesis being a situation in which the mean of the second population exceeds the first.
a.Calculate the difference in means between the two data sets. Is this consistent with the null hypothesis or the alternative hypothesis?
b.Perform a single bootstrap and calculate the difference between the means of the two groups. Use the first set of digits from π below as a method to generate the appropriate random numbers for each group (treat zeroes as a 10) and then sequentially choose the appropriate number of bootstrap values from each sample, starting with the first sample. Clearly show which values you use and how (i.e., show your work).
c.Is the difference in means from part (b) consistent with the null or alternative hypothesis?
d.What would our conclusion be if we performed 99 more replicates and they showed the same general pattern (i.e., the sign of the difference) as in part (c)?
π = 31415926535897932384626433

Unlock Deck
Sign up to unlock the cards in this deck!
Unlock Deck
Unlock Deck
1/25
Play
Full screen (f)
Deck 19: Computer-Intensive Methods
1
In general, simulations are used to create an approximation of which of the following?
A) The distribution of parameter values when the null hypothesis is false
B) The distribution of parameter values when the null hypothesis is true
C) The distribution of test statistic values when the null hypothesis is false
D) The distribution of test statistic values when the null hypothesis is true
D
2
The null distribution is best described as which of the following?
A) The test statistic's mean value
B) The test statistic's distribution
C) The test statistic's sum of squares
D) The test statistic's variance
A) The test statistic's mean value
B) The test statistic's distribution
C) The test statistic's sum of squares
D) The test statistic's variance
B
3
What is the common situation in which we would use simulation methods to analyze our data?
A) For normally distributed data values
B) For small sample sizes
C) When the data violates the assumptions of all the standard tests
D) When the estimated population parameter differs greatly from the sample statistic
A) For normally distributed data values
B) For small sample sizes
C) When the data violates the assumptions of all the standard tests
D) When the estimated population parameter differs greatly from the sample statistic
C
4
When doing a simulation, after you assume the null hypothesis is true, what is the key value that you calculate over and over?
A) The probability of getting the original sample statistic
B) The probability of getting the original test statistic
C) The value of the sample statistic
D) The value of the test statistic
A) The probability of getting the original sample statistic
B) The probability of getting the original test statistic
C) The value of the sample statistic
D) The value of the test statistic
Unlock Deck
Unlock for access to all 25 flashcards in this deck.
Unlock Deck
k this deck
5
Bootstrapping involves sampling the original data set without replacement to create new data sets that are analyzed under which conditions?
A) When the mean of the estimated value is unknown
B) When the sampling distribution of the estimated value is unknown
C) When the standard deviation of the estimated value is unknown
D) When the variance of the estimated value is unknown
A) When the mean of the estimated value is unknown
B) When the sampling distribution of the estimated value is unknown
C) When the standard deviation of the estimated value is unknown
D) When the variance of the estimated value is unknown
Unlock Deck
Unlock for access to all 25 flashcards in this deck.
Unlock Deck
k this deck
6
When deciding if we can use the bootstrapping procedure, which of the following is a requirement of our data?
A) The sample distribution must be normal
B) The sample distribution must be symmetric
C) The sample must have a large sample size
D) The sample must have a small sample bias
A) The sample distribution must be normal
B) The sample distribution must be symmetric
C) The sample must have a large sample size
D) The sample must have a small sample bias
Unlock Deck
Unlock for access to all 25 flashcards in this deck.
Unlock Deck
k this deck
7
The bootstrapping procedure is used to approximate which of the following distributions based on the data in the sample?
A) Normal distribution of the mean
B) Poisson distribution of the median
C) Sampling distribution of an estimate
D) Distribution of values for a statistical test
A) Normal distribution of the mean
B) Poisson distribution of the median
C) Sampling distribution of an estimate
D) Distribution of values for a statistical test
Unlock Deck
Unlock for access to all 25 flashcards in this deck.
Unlock Deck
k this deck
8
To generate a bootstrap standard error of an estimate, there are four steps. Which of these is not one of them?
A) First, use a computer to randomly sample the original data, without replacement, to make a new data set.
B) Second, calculate the estimate using the sampled values in the first step.
C) Third, repeat the first two steps a large number of times.
D) Fourth, the bootstrap standard error is the standard deviation of the set of values from step three.
Unlock Deck
Unlock for access to all 25 flashcards in this deck.
Unlock Deck
k this deck
9
To generate a bootstrap standard error of an estimate, there are four steps. Which of these is not one of them?
A) First, obtain a random sample from the original data using a computer.
B) Second, using the values in the first step, calculate the variance of the estimate.
C) Third, perform the first and second steps over and over again.
D) Fourth, calculate the standard deviation of all the values from step three; this is the bootstrap standard error.
Unlock Deck
Unlock for access to all 25 flashcards in this deck.
Unlock Deck
k this deck
10
To generate a bootstrap standard error of an estimate, there are four steps. Which of these is not one of them?
A) First, obtain a random sample from the original data using a computer.
B) Second, using the values in the first step, calculate the estimate.
C) Third, perform the first two steps over and over again until the cumulative value no longer changes.
D) Fourth, calculate the standard deviation of all the values from step three; this is the bootstrap standard error.
Unlock Deck
Unlock for access to all 25 flashcards in this deck.
Unlock Deck
k this deck
11
When doing a bootstrap, if we use a sample size that is too small, how does this bias our results?
A) The confidence intervals are too narrow and the standard errors are too large.
B) The confidence intervals are too narrow and the standard errors are too small.
C) The confidence intervals are too wide and the standard errors are too large.
D) The confidence intervals are too wide and the standard errors are too small.
Unlock Deck
Unlock for access to all 25 flashcards in this deck.
Unlock Deck
k this deck
12
When we do a simulation, we typically sample from the population many times and calculate the test statistic each time.
Unlock Deck
Unlock for access to all 25 flashcards in this deck.
Unlock Deck
k this deck
13
Simulation involves sampling the original data set with replacement to create new data sets that are analyzed.
Unlock Deck
Unlock for access to all 25 flashcards in this deck.
Unlock Deck
k this deck
14
When doing a simulation study, we calculate a test statistic over and over to create a distribution of values for comparison to our original test statistic value.
Unlock Deck
Unlock for access to all 25 flashcards in this deck.
Unlock Deck
k this deck
15
When doing a simulation study, if any of our test statistic values are more extreme than the original value, then we would not reject the null hypothesis.
Unlock Deck
Unlock for access to all 25 flashcards in this deck.
Unlock Deck
k this deck
16
When we do a simulation, the distribution of test statistic values is used to calculate a P-value for our original value.
Unlock Deck
Unlock for access to all 25 flashcards in this deck.
Unlock Deck
k this deck
17
The first step in a simulation analysis is to create a theoretical population with values matching a null hypothesis.
Unlock Deck
Unlock for access to all 25 flashcards in this deck.
Unlock Deck
k this deck
18
Bootstrapping involves sampling the original data set without replacement to create new data sets that are analyzed.
Unlock Deck
Unlock for access to all 25 flashcards in this deck.
Unlock Deck
k this deck
19
When performing a bootstrap, some values from the original data set may get chosen far more than others in a replicate.
Unlock Deck
Unlock for access to all 25 flashcards in this deck.
Unlock Deck
k this deck
20
Bootstrapping involves sampling the original population many times to create new data sets that are analyzed.
Unlock Deck
Unlock for access to all 25 flashcards in this deck.
Unlock Deck
k this deck
21
Bootstrapping is most commonly used to estimate the mean of a population.
Unlock Deck
Unlock for access to all 25 flashcards in this deck.
Unlock Deck
k this deck
22
Bootstrapping can be used to calculate the standard error of almost any estimate.
Unlock Deck
Unlock for access to all 25 flashcards in this deck.
Unlock Deck
k this deck
23
The bootstrap standard error tends to be smaller than the standard deviation.
Unlock Deck
Unlock for access to all 25 flashcards in this deck.
Unlock Deck
k this deck
24
Consider the two data sets shown. Imagine that we are interested if the mean of the second population is larger than the mean of the first population and we wish to test this using the bootstrap procedure. We will use a one-tailed approach with the alternative hypothesis being a situation in which the mean of the second population exceeds the first.
a.Calculate the difference in means between the two data sets. Is this consistent with the null hypothesis or the alternative hypothesis?
b.Perform a single bootstrap and calculate the difference between the means of the two groups. Use the first set of digits from π below as a method to generate the appropriate random numbers for each group (treat zeroes as a 10) and then sequentially choose the appropriate number of bootstrap values from each sample, starting with the first sample. Clearly show which values you use and how (i.e., show your work).
c.Is the difference in means from part (b) consistent with the null or alternative hypothesis?
d.What would our conclusion be if we performed 99 more replicates and they showed the same general pattern (i.e., the sign of the difference) as in part (c)?
π = 31415926535897932384626433
a.Calculate the difference in means between the two data sets. Is this consistent with the null hypothesis or the alternative hypothesis?
b.Perform a single bootstrap and calculate the difference between the means of the two groups. Use the first set of digits from π below as a method to generate the appropriate random numbers for each group (treat zeroes as a 10) and then sequentially choose the appropriate number of bootstrap values from each sample, starting with the first sample. Clearly show which values you use and how (i.e., show your work).
c.Is the difference in means from part (b) consistent with the null or alternative hypothesis?
d.What would our conclusion be if we performed 99 more replicates and they showed the same general pattern (i.e., the sign of the difference) as in part (c)?
π = 31415926535897932384626433
Unlock Deck
Unlock for access to all 25 flashcards in this deck.
Unlock Deck
k this deck
25
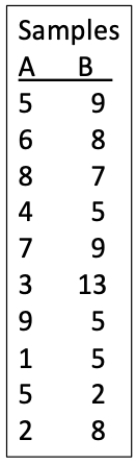
Consider the two data sets shown. Imagine that we are interested if the mean of the second population is larger than the mean of the first population and we wish to test this using the bootstrap procedure. We will use a one-tailed approach with the alternative hypothesis being a situation in which the mean of the second population exceeds the first.
a.Calculate the difference in means between the two data sets. Is this consistent with the null hypothesis or the alternative hypothesis?
b.Perform a single bootstrap and calculate the difference between the means of the two groups. Use the first set of digits from π below as a method to generate the appropriate random numbers for each group (treat zeroes as a 10) and then sequentially choose the appropriate number of bootstrap values from each sample, starting with the first sample. Clearly show which values you use and how (i.e., show your work).
c.Is the difference in means from part (b) consistent with the null or alternative hypothesis?
d.What would our conclusion be if we performed 99 more replicates and they showed the same general pattern (i.e., the sign of the difference) as in part (c)?
π = 31415926535897932384626433
a.Calculate the difference in means between the two data sets. Is this consistent with the null hypothesis or the alternative hypothesis?
b.Perform a single bootstrap and calculate the difference between the means of the two groups. Use the first set of digits from π below as a method to generate the appropriate random numbers for each group (treat zeroes as a 10) and then sequentially choose the appropriate number of bootstrap values from each sample, starting with the first sample. Clearly show which values you use and how (i.e., show your work).
c.Is the difference in means from part (b) consistent with the null or alternative hypothesis?
d.What would our conclusion be if we performed 99 more replicates and they showed the same general pattern (i.e., the sign of the difference) as in part (c)?
π = 31415926535897932384626433
Unlock Deck
Unlock for access to all 25 flashcards in this deck.
Unlock Deck
k this deck
Unlock Deck
Unlock for access to all 25 flashcards in this deck.


