Deck 16: Correlation Between Numerical Variables
Full screen (f)
Question
Question
Question
Question
Question
Question
Question
Question
Question
Question
Question
Question
Question
Question
Question
Question
Question
Question
Question
Question
Question
Question
Question
Question
Question
Question
Question
Question
Question
Question
Question
Question
Question
Question
Question
Question
Question
Question
Question
Question
Question
Question
Question
Question
Consider the data set shown. Conduct a full correlation analysis on these values.
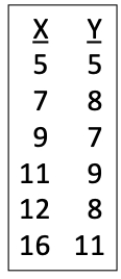 (a) Make a graph of the data points.
(b) Calculate the correlation coefficient with 95% confidence interval.
(c) Calculate the t-value for the correlation coefficient.
(d) Using your results from (b) and (c), make a statement about the significance of the association between the X and Y values.
(a) Make a graph of the data points.(b) Calculate the correlation coefficient with 95% confidence interval.
(c) Calculate the t-value for the correlation coefficient.
(d) Using your results from (b) and (c), make a statement about the significance of the association between the X and Y values.
Question
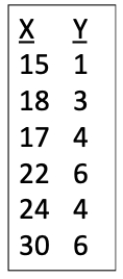
Consider the data set shown. Convert these values into ranks and conduct a Spearman's rank correlation analysis.
 (a) Calculate the Spearman's rank correlation coefficient and standard error.
(b) Calculate the t-value for the Spearman's rank correlation coefficient.
(c) Using your results from (a) and (b), make a statement about the significance of the association between the X and Y values.
(a) Calculate the Spearman's rank correlation coefficient and standard error.(b) Calculate the t-value for the Spearman's rank correlation coefficient.
(c) Using your results from (a) and (b), make a statement about the significance of the association between the X and Y values.
Question
Consider the data set shown. Conduct a full correlation analysis on these values.
 (a) Make a graph of the data points.
(b) Calculate the correlation coefficient with 95% confidence interval.
(c) Calculate the t-value for the correlation coefficient.
(d) Using your results from (b) and (c), make a statement about the significance of the association between the X and Y values.
(a) Make a graph of the data points.(b) Calculate the correlation coefficient with 95% confidence interval.
(c) Calculate the t-value for the correlation coefficient.
(d) Using your results from (b) and (c), make a statement about the significance of the association between the X and Y values.
Question
Consider the data set shown. Convert these values into ranks and conduct a Spearman's rank correlation analysis.
 (a) Calculate the Spearman's rank correlation coefficient and standard error.
(b) Calculate the t-value for the Spearman's rank correlation coefficient.
(c) Using your results from (a) and (b), make a statement about the significance of the association between the X and Y values.
(a) Calculate the Spearman's rank correlation coefficient and standard error.(b) Calculate the t-value for the Spearman's rank correlation coefficient.
(c) Using your results from (a) and (b), make a statement about the significance of the association between the X and Y values.
Question
Question

Unlock Deck
Sign up to unlock the cards in this deck!
Unlock Deck
Unlock Deck
1/49
Play
Full screen (f)
Deck 16: Correlation Between Numerical Variables
1
This value measures the strength and direction of the association between two numerical variables.
A) Correlation coefficient.
B) Correlation factor.
C) Correlation measurement.
D) Correlation value.
A) Correlation coefficient.
B) Correlation factor.
C) Correlation measurement.
D) Correlation value.
A
2
When we determine that two variables are correlated, which of the following is the best way to think about our observation?
A) Correlation alone does not tell us anything.
B) One of them is causing the other, but we don't know which is which
C) Something interesting is going on, but we need more information.
D) The relationship between the two factors is linear, not curved.
A) Correlation alone does not tell us anything.
B) One of them is causing the other, but we don't know which is which
C) Something interesting is going on, but we need more information.
D) The relationship between the two factors is linear, not curved.
C
3
Consider the data set shown. The mean X value is 6 and the mean Y value is 5.
?
-What would the sum of the products be for this data set?
A) -8
B) -6
C) 4
D) 20
?
-What would the sum of the products be for this data set?
A) -8
B) -6
C) 4
D) 20
-8
4
Consider the data set shown. The mean X value is 6 and the mean Y value is 5.
?
-What would the correlation coefficient be for this data set?
A) -0.333
B) -0.300
C) -0.267
D) -0.233
?
-What would the correlation coefficient be for this data set?
A) -0.333
B) -0.300
C) -0.267
D) -0.233
Unlock Deck
Unlock for access to all 49 flashcards in this deck.
Unlock Deck
k this deck
5
Consider the data set shown. The mean X value is 6 and the mean Y value is 5.
?
-What would the standard error of the correlation coefficient be for this data set?
A) 0.071
B) 0.462
C) 0.556
D) 0.650
?
-What would the standard error of the correlation coefficient be for this data set?
A) 0.071
B) 0.462
C) 0.556
D) 0.650
Unlock Deck
Unlock for access to all 49 flashcards in this deck.
Unlock Deck
k this deck
6
Consider the data set shown. The mean X value is 6 and the mean Y value is 5.
?
-What would the z-transformation of the correlation coefficient be?
A) -0.273
B) -0.233
C) -0.193
D) -0.153
?
-What would the z-transformation of the correlation coefficient be?
A) -0.273
B) -0.233
C) -0.193
D) -0.153
Unlock Deck
Unlock for access to all 49 flashcards in this deck.
Unlock Deck
k this deck
7
Consider the data set shown. The mean X value is 6 and the mean Y value is 5.
?
-What is the 95% confidence interval for ??
A) -1.88 to 1.31
B) -1.77 to 1.21
C) -1.66 to 1.11
D) -1.55 to 1.01
?
-What is the 95% confidence interval for ??
A) -1.88 to 1.31
B) -1.77 to 1.21
C) -1.66 to 1.11
D) -1.55 to 1.01
Unlock Deck
Unlock for access to all 49 flashcards in this deck.
Unlock Deck
k this deck
8
Consider the data set shown. The mean X value is 6 and the mean Y value is 5.
?
-What is the 95% confidence interval for ??
A) -0.810 to 0.665
B) -0.850 to 0.725
C) -0.890 to 0.765
D) -0.930 to 0.805
?
-What is the 95% confidence interval for ??
A) -0.810 to 0.665
B) -0.850 to 0.725
C) -0.890 to 0.765
D) -0.930 to 0.805
Unlock Deck
Unlock for access to all 49 flashcards in this deck.
Unlock Deck
k this deck
9
Consider the data set shown. The mean X value is 6 and the mean Y value is 6.
?
-What would the sum of the products be for this data set?
A) 20
B) 22
C) 24
D) 26
?
-What would the sum of the products be for this data set?
A) 20
B) 22
C) 24
D) 26
Unlock Deck
Unlock for access to all 49 flashcards in this deck.
Unlock Deck
k this deck
10
Consider the data set shown. The mean X value is 6 and the mean Y value is 6.
?
-What would the correlation coefficient be for this data set?
A) 0.799
B) 0.829
C) 0.859
D) 0.889
?
-What would the correlation coefficient be for this data set?
A) 0.799
B) 0.829
C) 0.859
D) 0.889
Unlock Deck
Unlock for access to all 49 flashcards in this deck.
Unlock Deck
k this deck
11
Consider the data set shown. The mean X value is 6 and the mean Y value is 6.
?
-What would the standard error of the correlation coefficient be for this data set?
A) 0.244
B) 0.228
C) 0.284
D) 0.304
?
-What would the standard error of the correlation coefficient be for this data set?
A) 0.244
B) 0.228
C) 0.284
D) 0.304
Unlock Deck
Unlock for access to all 49 flashcards in this deck.
Unlock Deck
k this deck
12
Consider the data set shown. The mean X value is 6 and the mean Y value is 6.
?
-What would the z-transformation of the correlation coefficient be?
A) 1.379
B) -1.399
C) 1.419
D) 1.439
?
-What would the z-transformation of the correlation coefficient be?
A) 1.379
B) -1.399
C) 1.419
D) 1.439
Unlock Deck
Unlock for access to all 49 flashcards in this deck.
Unlock Deck
k this deck
13
Consider the data set shown. The mean X value is 6 and the mean Y value is 6.
?
-What is the 95% confidence interval for ??
A) 0.123 to 2.954
B) -0.093 to 2.904
C) 0.063 to 2.854
D) 0.286 to 2.548
?
-What is the 95% confidence interval for ??
A) 0.123 to 2.954
B) -0.093 to 2.904
C) 0.063 to 2.854
D) 0.286 to 2.548
Unlock Deck
Unlock for access to all 49 flashcards in this deck.
Unlock Deck
k this deck
14
Consider the data set shown. The mean X value is 6 and the mean Y value is 6.
?
-What is the 95% confidence interval for ??
A) 0.033 to 0.993
B) -0.023 to 0.983
C) 0.013 to 0.973
D) 0.277 to 0.987
?
-What is the 95% confidence interval for ??
A) 0.033 to 0.993
B) -0.023 to 0.983
C) 0.013 to 0.973
D) 0.277 to 0.987
Unlock Deck
Unlock for access to all 49 flashcards in this deck.
Unlock Deck
k this deck
15
Consider the data set shown. The mean X value is 6 and the mean Y value is 6.
?
-What is the t-value for a significance test of r?
A) -0.479
B) -0.979
C) -1.479
D) -1.979
?
-What is the t-value for a significance test of r?
A) -0.479
B) -0.979
C) -1.479
D) -1.979
Unlock Deck
Unlock for access to all 49 flashcards in this deck.
Unlock Deck
k this deck
16
Consider the data set shown. The mean X value is 6 and the mean Y value is 6.
?
-What is the t-value for a significance test of ??
A) 3.268
B) 3.899
C) 3.468
D) 3.568
?
-What is the t-value for a significance test of ??
A) 3.268
B) 3.899
C) 3.468
D) 3.568
Unlock Deck
Unlock for access to all 49 flashcards in this deck.
Unlock Deck
k this deck
17
A bivariate distribution has all of the following features except which one?
A) The X and Y values each have their own separate normal distributions.
B) The X and Y values have a linear relationship with one another.
C) The X and Y values have symmetric distributions and the same range of values.
D) We see a circular or elliptical cloud of points when we make a scatter plot of the X and Y values.
Unlock Deck
Unlock for access to all 49 flashcards in this deck.
Unlock Deck
k this deck
18
Which of the following is not a factor that can adversely influence the accuracy of a correlation analysis?
A) The width of the set of points is wider at one end than the other.
B) There are more points toward the center of the axes than at the ends.
C) There are outliers.
D) There is a curved relationship between the X and Y values.
A) The width of the set of points is wider at one end than the other.
B) There are more points toward the center of the axes than at the ends.
C) There are outliers.
D) There is a curved relationship between the X and Y values.
Unlock Deck
Unlock for access to all 49 flashcards in this deck.
Unlock Deck
k this deck
19
When can you use a subset of the range of values to estimate the correlation coefficient for the whole range?
A) When the data have been transformed using the natural log transformation.
B) When the data have been transformed using the square root transformation.
C) When the range of X values is at least 50% of the range of the total data set.
D) You cannot ever do this.
A) When the data have been transformed using the natural log transformation.
B) When the data have been transformed using the square root transformation.
C) When the range of X values is at least 50% of the range of the total data set.
D) You cannot ever do this.
Unlock Deck
Unlock for access to all 49 flashcards in this deck.
Unlock Deck
k this deck
20
The technique that measures the strength and direction of the linear association between the ranks of two variables is called which of the following?
A) Fisher's magnitude correlation.
B) Fisher's rank correlation.
C) Spearman's magnitude correlation.
D) Spearman's rank correlation.
A) Fisher's magnitude correlation.
B) Fisher's rank correlation.
C) Spearman's magnitude correlation.
D) Spearman's rank correlation.
Unlock Deck
Unlock for access to all 49 flashcards in this deck.
Unlock Deck
k this deck
21
Consider the data set shown. The mean X value is 6 and the mean Y value is 5.
?
?
-What would the Spearman's rank correlation coefficient be for this data set?
A) -0.333
B) -0.300
C) -0.267
D) -0.233
?
?
-What would the Spearman's rank correlation coefficient be for this data set?
A) -0.333
B) -0.300
C) -0.267
D) -0.233
Unlock Deck
Unlock for access to all 49 flashcards in this deck.
Unlock Deck
k this deck
22
Consider the data set shown. The mean X value is 6 and the mean Y value is 5.
?
?
-What would the standard error of the Spearman's rank correlation coefficient be for this data set?
A) 0.491
B) 0.511
C) 0.531
D) 0.551
?
?
-What would the standard error of the Spearman's rank correlation coefficient be for this data set?
A) 0.491
B) 0.511
C) 0.531
D) 0.551
Unlock Deck
Unlock for access to all 49 flashcards in this deck.
Unlock Deck
k this deck
23
Consider the data set shown. The mean X value is 6 and the mean Y value is 5.
?
?
-What would the t-value be for a t-test of the Spearman's rank correlation coefficient for this data set?
A) -0.545
B) -0.585
C) -0.625
D) -0.665
?
?
-What would the t-value be for a t-test of the Spearman's rank correlation coefficient for this data set?
A) -0.545
B) -0.585
C) -0.625
D) -0.665
Unlock Deck
Unlock for access to all 49 flashcards in this deck.
Unlock Deck
k this deck
24
Consider the data set shown. The mean X value is 6 and the mean Y value is 5.
-What would the Spearman's rank correlation coefficient be for this data set?
A) 0.797
B) 0.827
C) 0.857
D) 0.887
-What would the Spearman's rank correlation coefficient be for this data set?
A) 0.797
B) 0.827
C) 0.857
D) 0.887
Unlock Deck
Unlock for access to all 49 flashcards in this deck.
Unlock Deck
k this deck
25
Consider the data set shown. The mean X value is 6 and the mean Y value is 5.
-What would the standard error of the Spearman's rank correlation coefficient be for this data set?
A) 0.247
B) 0.257
C) 0.281
D) 0.301
-What would the standard error of the Spearman's rank correlation coefficient be for this data set?
A) 0.247
B) 0.257
C) 0.281
D) 0.301
Unlock Deck
Unlock for access to all 49 flashcards in this deck.
Unlock Deck
k this deck
26
Consider the data set shown. The mean X value is 6 and the mean Y value is 5.
-What would the t-value be for a t-test of the Spearman's rank correlation coefficient for this data set?
A) 2.973
B) 3.073
C) 3.175
D) 3.335
-What would the t-value be for a t-test of the Spearman's rank correlation coefficient for this data set?
A) 2.973
B) 3.073
C) 3.175
D) 3.335
Unlock Deck
Unlock for access to all 49 flashcards in this deck.
Unlock Deck
k this deck
27
The term ____ is used to describe the phenomenon by which measurement error reduces the absolute value of r.
A) Attenuation
B) Minimization
C) Shrinkage
D) Stochasticity
A) Attenuation
B) Minimization
C) Shrinkage
D) Stochasticity
Unlock Deck
Unlock for access to all 49 flashcards in this deck.
Unlock Deck
k this deck
28
If measurement error in our variables is high when attempting to calculate correlation coefficients, which of the following three approaches is not a good way to deal with this?
A) Find a different measuring method that yields more precise measurements.
B) Measure each individual multiple times and use the average value.
C) Remeasure individuals with the most extreme values to eliminate outliers.
D) Use repeat measurements to calculate a corrected correlation, r*.
A) Find a different measuring method that yields more precise measurements.
B) Measure each individual multiple times and use the average value.
C) Remeasure individuals with the most extreme values to eliminate outliers.
D) Use repeat measurements to calculate a corrected correlation, r*.
Unlock Deck
Unlock for access to all 49 flashcards in this deck.
Unlock Deck
k this deck
29
What is the general pattern seen in funnel plots used to examine publication bias?
A) As the effect size on the X-axis increases, the range of effect sizes on the Y-axis tightens around the likely true value.
B) As the effect size on the X-axis increases, the range of P-values on the Y-axis tightens around the likely true value.
C) As the sample size on the X-axis increases, the range of effect sizes on the Y-axis tightens around the likely true value.
D) As the sample size on the X-axis increases, the range of P-values on the Y-axis tightens around the likely true value.
Unlock Deck
Unlock for access to all 49 flashcards in this deck.
Unlock Deck
k this deck
30
The correlation coefficient measures the strength, but not the direction, of the association between two numerical variables.
Unlock Deck
Unlock for access to all 49 flashcards in this deck.
Unlock Deck
k this deck
31
The absolute value of the correlation coefficient is between zero and one.
Unlock Deck
Unlock for access to all 49 flashcards in this deck.
Unlock Deck
k this deck
32
When two numerical variables are correlated, then the relationship between them is linear.
Unlock Deck
Unlock for access to all 49 flashcards in this deck.
Unlock Deck
k this deck
33
We use the standard error of the correlation coefficient to calculate confidence intervals for the correlation coefficient.
Unlock Deck
Unlock for access to all 49 flashcards in this deck.
Unlock Deck
k this deck
34
A statistically significant correlation coefficient indicates a linear relationship between the two variables.
Unlock Deck
Unlock for access to all 49 flashcards in this deck.
Unlock Deck
k this deck
35
When transforming variables in a correlation analysis, both the X and Y values must be transformed.
Unlock Deck
Unlock for access to all 49 flashcards in this deck.
Unlock Deck
k this deck
36
Correlation coefficients for studies using different ranges of values can be compared as long as 50% of the range overlaps.
Unlock Deck
Unlock for access to all 49 flashcards in this deck.
Unlock Deck
k this deck
37
The value of the correlation coefficient increases as the difference between the largest and smallest X values increases.
Unlock Deck
Unlock for access to all 49 flashcards in this deck.
Unlock Deck
k this deck
38
Spearman's rank correlation measures the strength and direction of the linear association between the ranks of two variables.
Unlock Deck
Unlock for access to all 49 flashcards in this deck.
Unlock Deck
k this deck
39
Calculated values for the Spearman's rank correlation can be treated like regular correlation coefficients with respect to determining the t-value when the sample size exceeds 20.
Unlock Deck
Unlock for access to all 49 flashcards in this deck.
Unlock Deck
k this deck
40
Measurement error will tend to decrease the absolute value of the correlation coefficient.
Unlock Deck
Unlock for access to all 49 flashcards in this deck.
Unlock Deck
k this deck
41
Attenuation is the term that describes how measurement error tends to move the correlation coefficient closer to zero than its true value.
Unlock Deck
Unlock for access to all 49 flashcards in this deck.
Unlock Deck
k this deck
42
Research studies with many test results where P > 0.05 are often easier to publish than those in which most of the tests result in P < 0.05.
Unlock Deck
Unlock for access to all 49 flashcards in this deck.
Unlock Deck
k this deck
43
A funnel plot is a graphical method to examine the relationship between the sample size of an experiment and the estimated effect size from that experiment.
Unlock Deck
Unlock for access to all 49 flashcards in this deck.
Unlock Deck
k this deck
44
Consider the data set shown. Conduct a full correlation analysis on these values.
(a) Make a graph of the data points.
(b) Calculate the correlation coefficient with 95% confidence interval.
(c) Calculate the t-value for the correlation coefficient.
(d) Using your results from (b) and (c), make a statement about the significance of the association between the X and Y values.
(a) Make a graph of the data points.(b) Calculate the correlation coefficient with 95% confidence interval.
(c) Calculate the t-value for the correlation coefficient.
(d) Using your results from (b) and (c), make a statement about the significance of the association between the X and Y values.
Unlock Deck
Unlock for access to all 49 flashcards in this deck.
Unlock Deck
k this deck
45
Consider the data set shown. Convert these values into ranks and conduct a Spearman's rank correlation analysis.
(a) Calculate the Spearman's rank correlation coefficient and standard error.
(b) Calculate the t-value for the Spearman's rank correlation coefficient.
(c) Using your results from (a) and (b), make a statement about the significance of the association between the X and Y values.
(a) Calculate the Spearman's rank correlation coefficient and standard error.(b) Calculate the t-value for the Spearman's rank correlation coefficient.
(c) Using your results from (a) and (b), make a statement about the significance of the association between the X and Y values.
Unlock Deck
Unlock for access to all 49 flashcards in this deck.
Unlock Deck
k this deck
46
Consider the data set shown. Conduct a full correlation analysis on these values.
(a) Make a graph of the data points.
(b) Calculate the correlation coefficient with 95% confidence interval.
(c) Calculate the t-value for the correlation coefficient.
(d) Using your results from (b) and (c), make a statement about the significance of the association between the X and Y values.
(a) Make a graph of the data points.(b) Calculate the correlation coefficient with 95% confidence interval.
(c) Calculate the t-value for the correlation coefficient.
(d) Using your results from (b) and (c), make a statement about the significance of the association between the X and Y values.
Unlock Deck
Unlock for access to all 49 flashcards in this deck.
Unlock Deck
k this deck
47
Consider the data set shown. Convert these values into ranks and conduct a Spearman's rank correlation analysis.
(a) Calculate the Spearman's rank correlation coefficient and standard error.
(b) Calculate the t-value for the Spearman's rank correlation coefficient.
(c) Using your results from (a) and (b), make a statement about the significance of the association between the X and Y values.
(a) Calculate the Spearman's rank correlation coefficient and standard error.(b) Calculate the t-value for the Spearman's rank correlation coefficient.
(c) Using your results from (a) and (b), make a statement about the significance of the association between the X and Y values.
Unlock Deck
Unlock for access to all 49 flashcards in this deck.
Unlock Deck
k this deck
48
When might we prefer to use rank data even if we have quantitative values for our variables?
Unlock Deck
Unlock for access to all 49 flashcards in this deck.
Unlock Deck
k this deck
49
Consider two different kinds of publication bias: one arising from the behaviors of journal reviewers and the other arising from the economic interests of companies that fund the research. Both are sources of publication bias, but the reasons differ. Describe how the biases are caused and contrast the morality of the scientists submitting the papers in these two situations.
Unlock Deck
Unlock for access to all 49 flashcards in this deck.
Unlock Deck
k this deck
Unlock Deck
Unlock for access to all 49 flashcards in this deck.


