Deck 11: Inference for a Normal Population
Full screen (f)
Question
Question
Question
Question
Question
Question
Question
Question
Question
Question
Question
Question
Question
Question
Question
Question
Question
Question
Question
Question
Question
Question
Question
Question
Question
Question
Question
Question
Question
Question
Question
Question
Question
Question
Question
Question
Question
Question
Question
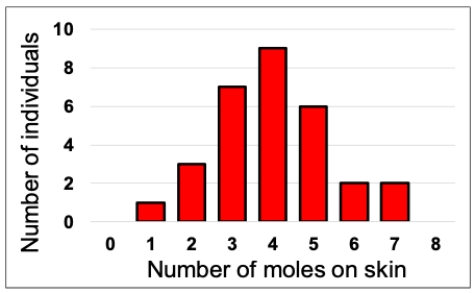
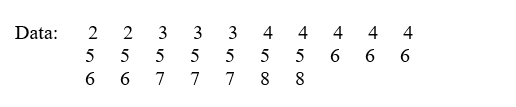
Consider the figure shown indicating the number of moles on the skin of a set of 30 patients examined by a dermatologist. Published reports claim that the mean number for the population these patients come from is 3.4 moles. Conduct a one-sample t-test on this data and determine whether this seems to be true. Assume a = 0.5. In your answer, present the following: your calculated t-value, an exact P-value using a computer or a range for the P-value using a table of critical values, and a statement about whether the population mean appears to be 3.4 or not based on the sample.
Question
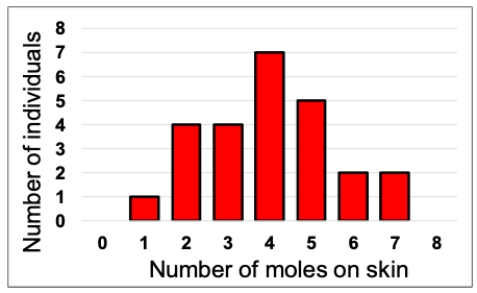
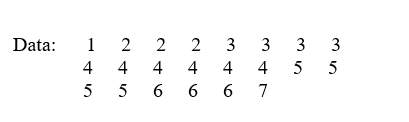
Consider the figure shown indicating the number of moles on the skin of a set of 25 patients examined by a dermatologist. Published reports claim that the mean number for the population these patients come from is 3.5 moles. Conduct a one-sample t-test on this data and determine whether this seems to be true. Assume a = 0.5. In your answer present the following: your calculated t-value, an exact P-value using a computer or a range for the P-value using a table of critical values, and a statement about whether the population mean appears to be 3.5 or not based on the sample.
Question
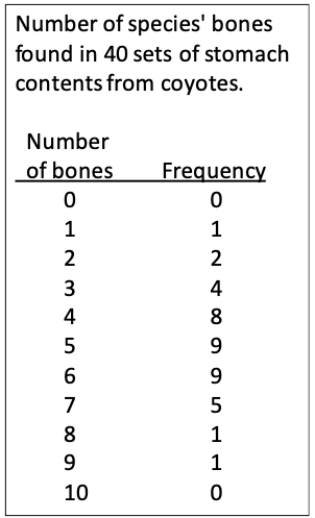
Consider a study on the diet of coyotes. The table shown indicates an analysis of the bones found in the stomachs of 40 roadkill coyotes, and the number of species found in each was measured. Previous studies claim that the mean number of species eaten by coyotes (i.e., the number of species expected in the stomach contents) is 4.5 species per coyote. Conduct a one-sample t-test on this data and determine whether this seems to be true. Assume a = 0.5. In your answer, present the following: your calculated t-value, an exact P-value using a computer or a range for the P-value using a table of critical values, and a statement about whether the population mean appears to be 4.5 or not based on the sample.
Question
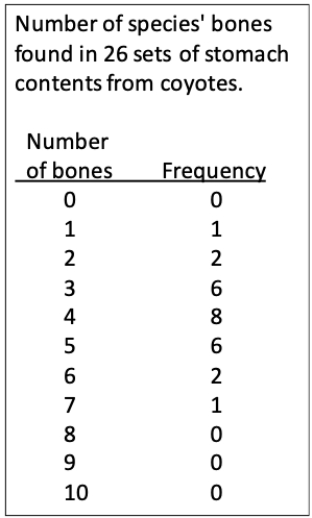
Consider a study on the diet of coyotes. The table shown indicates an analysis of the bones found in the stomachs of 26 roadkill coyotes, and the number of species found in each was measured. Previous studies claim that the mean number of species eaten by coyotes (i.e., the number of species expected in the stomach contents) is 3.4 species per coyote. Conduct a one-sample t-test on this data and determine whether this seems to be true. Assume a = 0.5. In your answer, present the following: your calculated t-value, an exact P-value using a computer or a range for the P-value using a table of critical values, and a statement about whether the population mean appears to be 3.4 or not based on the sample.
Question
Question
Question
For the data set shown below, calculate the following values: sample mean, 95% confidence interval for the population mean, sample variance, 95% confidence interval for the population variance, sample standard deviation, approximate 95% confidence interval for the population standard deviation.

Unlock Deck
Sign up to unlock the cards in this deck!
Unlock Deck
Unlock Deck
1/46
Play
Full screen (f)
Deck 11: Inference for a Normal Population
1
Consider two t-distributions overlaid on the same figure-one for 18 degrees of freedom and one for 20 degrees of freedom. Which of the following corresponds to the location farthest right (i.e., the largest t-value)?
A) The 5% critical value for df = 18
B) The 5% critical value for df = 20
C) The 2% critical value for df = 18
D) The 2% critical value for df = 20
A) The 5% critical value for df = 18
B) The 5% critical value for df = 20
C) The 2% critical value for df = 18
D) The 2% critical value for df = 20
C
2
We must use the t-distribution instead of the Z-distribution to calculate probabilities for real- world data sets because of what reason?
A) Sampling error causing the sample and population means to differ.
B) Sampling error causing the samples and populations to differ.
C) Uncertainty about the sample's standard deviation.
D) Uncertainty about the population's standard deviation.
A) Sampling error causing the sample and population means to differ.
B) Sampling error causing the samples and populations to differ.
C) Uncertainty about the sample's standard deviation.
D) Uncertainty about the population's standard deviation.
D
3
If a sample with 34 values has a mean of 33 and a standard deviation of 35, how many degrees of freedom does it have?
A) 32
B) 33
C) 34
D) 35
A) 32
B) 33
C) 34
D) 35
B
4
Which region contains the smallest total area?
A) From t = -5 to t = -1 in a t distribution.
B) From t = -1 to t = 0 in a t distribution.
C) From Z = -5 to Z = -1 in a normal distribution.
D) From Z = -1 to Z = 0 in a normal distribution.
A) From t = -5 to t = -1 in a t distribution.
B) From t = -1 to t = 0 in a t distribution.
C) From Z = -5 to Z = -1 in a normal distribution.
D) From Z = -1 to Z = 0 in a normal distribution.
Unlock Deck
Unlock for access to all 46 flashcards in this deck.
Unlock Deck
k this deck
5
What is the correct representation for the 5% critical t-value for a sample with 9 degrees of freedom?
A) t0.05(2),8
B) t0.05(2),9
C) t0.025(2),8
D) t0.025(2),9
A) t0.05(2),8
B) t0.05(2),9
C) t0.025(2),8
D) t0.025(2),9
Unlock Deck
Unlock for access to all 46 flashcards in this deck.
Unlock Deck
k this deck
6
The critical t-value represented by t0.025(2),20 is the one appropriate for which combination of critical value and degrees of freedom?
A) A 5% critical value and 19 degrees of freedom.
B) A 5% critical value and 20 degrees of freedom.
C) A 2.5% critical value and 19 degrees of freedom.
D) A 2.5% critical value and 20 degrees of freedom.
A) A 5% critical value and 19 degrees of freedom.
B) A 5% critical value and 20 degrees of freedom.
C) A 2.5% critical value and 19 degrees of freedom.
D) A 2.5% critical value and 20 degrees of freedom.
Unlock Deck
Unlock for access to all 46 flashcards in this deck.
Unlock Deck
k this deck
7
In tables of critical t-values, what value of t would correspond to the location with 95% of the distribution less and 5% of the distribution greater when there are 15 degrees of freedom?
A) 1.753
B) 1.746
C) 1.740
D) 1.734
A) 1.753
B) 1.746
C) 1.740
D) 1.734
Unlock Deck
Unlock for access to all 46 flashcards in this deck.
Unlock Deck
k this deck
8
In tables of critical t-values, what value of t would correspond to the location with 99% of the distribution less and 1% of the distribution greater when there are 13 degrees of freedom?
A) 1.771
B) 2.160
C) 2.282
D) 2.650
A) 1.771
B) 2.160
C) 2.282
D) 2.650
Unlock Deck
Unlock for access to all 46 flashcards in this deck.
Unlock Deck
k this deck
9
Using your table of critical t-values, what values of t correspond to the ones that bound a central region containing 90% of the distribution when there are 16 degrees of freedom?
A) -1.753 to 1.753
B) -1.746 to 1.746
C) -2.131 to 2.131
D) -2.120 to 2.120
A) -1.753 to 1.753
B) -1.746 to 1.746
C) -2.131 to 2.131
D) -2.120 to 2.120
Unlock Deck
Unlock for access to all 46 flashcards in this deck.
Unlock Deck
k this deck
10
If we have a 95% confidence interval of 14.69 < μ < 15.85 based on a sample of 18 values, what is the standard deviation of the sample?
A) 1.17
B) 1.39
C) 1.44
D) 1.49
A) 1.17
B) 1.39
C) 1.44
D) 1.49
Unlock Deck
Unlock for access to all 46 flashcards in this deck.
Unlock Deck
k this deck
11
If we have a sample of 14 values that gives us a 99% confidence interval of 5.76 < μ < 8.54, what is the standard deviation of the sample?
A) 1.87
B) 1.91
C) 1.95
D) 1.72
A) 1.87
B) 1.91
C) 1.95
D) 1.72
Unlock Deck
Unlock for access to all 46 flashcards in this deck.
Unlock Deck
k this deck
12
How many standard errors in width is the 95% confidence interval for a sample with 20 values?
A) 1.73
B) 2.09
C) 3.46
D) 4.18
A) 1.73
B) 2.09
C) 3.46
D) 4.18
Unlock Deck
Unlock for access to all 46 flashcards in this deck.
Unlock Deck
k this deck
13
For a sample of 8 values, what are the critical values we would use to calculate the 95% and 99% confidence intervals?
A) 1.89 and 2.36
B) 2.36 and 3.50
C) 3.00 and 3.50
D) 1.89 and 3.50
A) 1.89 and 2.36
B) 2.36 and 3.50
C) 3.00 and 3.50
D) 1.89 and 3.50
Unlock Deck
Unlock for access to all 46 flashcards in this deck.
Unlock Deck
k this deck
14
If we have a sample of 11 values with a mean of 15.00 and a standard deviation of 1.30, what is the 95% confidence interval?
A) 13.86 < μ < 16.16
B) 13.96 < μ < 16.06
C) 14.06 < μ < 15.96
D) 14.14 < μ < 15.86
A) 13.86 < μ < 16.16
B) 13.96 < μ < 16.06
C) 14.06 < μ < 15.96
D) 14.14 < μ < 15.86
Unlock Deck
Unlock for access to all 46 flashcards in this deck.
Unlock Deck
k this deck
15
For a sample of 13 values that has a mean of 5.6 with a standard deviation of 0.7, what would the 99% confidence interval be?
A) 4.8 < μ < 6.4
B) 4.9 < μ < 6.3
C) 5.0 < μ < 6.2
D) 5.1 < μ < 6.1
A) 4.8 < μ < 6.4
B) 4.9 < μ < 6.3
C) 5.0 < μ < 6.2
D) 5.1 < μ < 6.1
Unlock Deck
Unlock for access to all 46 flashcards in this deck.
Unlock Deck
k this deck
16
For a t-test using a sample of 35 values which returns a positive value, how big must the t-test statistic be to reject the null hypothesis?
A) 1.69
B) 2.03
C) 2.44
D) 2.72
A) 1.69
B) 2.03
C) 2.44
D) 2.72
Unlock Deck
Unlock for access to all 46 flashcards in this deck.
Unlock Deck
k this deck
17
If a t-test results in a sample mean the same as the hypothesized population mean, then the t-statistic and P-value of the test would be which of the following (respectively)?
A) 0, 0.
B) 0, 1.
C) 1, 0.
D) 1, 1.
A) 0, 0.
B) 0, 1.
C) 1, 0.
D) 1, 1.
Unlock Deck
Unlock for access to all 46 flashcards in this deck.
Unlock Deck
k this deck
18
If a population is hypothesized to have a mean value of 15, but the 95% confidence interval based of a sample of 14 values is 16 < μ < 24, what is the t-statistic of the corresponding one sample t-test?
A) 2.65
B) 2.70
C) 2.75
D) 2.80
A) 2.65
B) 2.70
C) 2.75
D) 2.80
Unlock Deck
Unlock for access to all 46 flashcards in this deck.
Unlock Deck
k this deck
19
Consider an experiment in which Shireen measures 20 Arabidopsis plants in a pasture that an agricultural company claims have an average height of exactly 23 cm. Her plants have a mean of 24.53 cm with a standard deviation of 2.33 cm, however. If she conducts a one-sample t-test of her data, what t-value would she obtain?
A) 2.091
B) 2.547
C) 2.937
D) 3.411
A) 2.091
B) 2.547
C) 2.937
D) 3.411
Unlock Deck
Unlock for access to all 46 flashcards in this deck.
Unlock Deck
k this deck
20
Consider an experiment in which Shireen measures 20 Arabidopsis plants in a pasture that an agricultural company claims have an average height of exactly 23 cm. Her plants have a mean of 24.53 cm with a standard deviation of 2.33 cm, however. Based on her t-test statistic, and using your table of critical t values, which of the following P-value ranges matches the one for the t-value she obtains?
A) P > 0.05
B) 0.02 < P < 0.05
C) 0.01 < P < 0.02
D) P < 0.01
A) P > 0.05
B) 0.02 < P < 0.05
C) 0.01 < P < 0.02
D) P < 0.01
Unlock Deck
Unlock for access to all 46 flashcards in this deck.
Unlock Deck
k this deck
21
Consider an experiment in which Shireen measures 20 Arabidopsis plants in a pasture that an agricultural company claims have an average height of exactly 23 cm. Her plants have a mean of 24.53 cm with a standard deviation of 2.33 cm, however. Based on her t-test statistic, which of the following best describes her conclusion?
A) She fails to reject the null hypothesis of the t-test and concludes that the mean height of the plants seems to differ from 23 cm.
B) She fails to reject the null hypothesis of the t-test and concludes that the mean height of the plants doesn't seem to differ from 23 cm.
C) She rejects the null hypothesis of the t-test and concludes that the mean height of the plants seems to differ from 23 cm.
D) She rejects the null hypothesis of the t-test and concludes that the mean height of the plants doesn't seem to differ from 23 cm.
Unlock Deck
Unlock for access to all 46 flashcards in this deck.
Unlock Deck
k this deck
22
Consider a situation in which Jamal measures the resting heart rate of 16 individuals from a population that he thinks (based on published reports) has an average resting heart rate of 72 beats per minute. His sample has a mean of 75.2 with a standard deviation of 6.2 cm. If he conducts a one-sample t-test of his data, what t-value would he obtain?
A) 2.065
B) 2.135
C) 2.205
D) 2.275
A) 2.065
B) 2.135
C) 2.205
D) 2.275
Unlock Deck
Unlock for access to all 46 flashcards in this deck.
Unlock Deck
k this deck
23
Consider a situation in which Jamal measures the resting heart rate of 16 individuals from a population that he thinks (based on published reports) has an average resting heart rate of 72 beats per minute. His sample has a mean of 75.2 with a standard deviation of 6.2 cm. Based on his t-test statistic, and using your table of critical t-values, which of the following P-value ranges matches the one for the t-value he obtains?
A) P > 0.05
B) 0.02 < P < 0.05
C) 0.01 < P < 0.02
D) P < 0.01
A) P > 0.05
B) 0.02 < P < 0.05
C) 0.01 < P < 0.02
D) P < 0.01
Unlock Deck
Unlock for access to all 46 flashcards in this deck.
Unlock Deck
k this deck
24
Consider a situation in which Rosa measures the diameter of 15 trees from a population that she thinks (based on published reports) has an average diameter of 240 cm. Her sample has a mean of 253.1 cm with a standard deviation of 25.21 cm. Based on her t-test statistic, which of the following best describes her conclusion?
A) She fails to reject the null hypothesis of the t-test and concludes that the mean diameter of the trees seems to differ from 240 cm.
B) She fails to reject the null hypothesis of the t-test and concludes that the mean diameter of the trees doesn't seem to differ from 240 cm.
C) She rejects the null hypothesis of the t-test and concludes that the mean diameter of the trees seems to differ from 240 cm.
D) She rejects the null hypothesis of the t-test and concludes that the mean diameter of the trees doesn't seem to differ from 240 cm.
Unlock Deck
Unlock for access to all 46 flashcards in this deck.
Unlock Deck
k this deck
25
Which of the following does not describe one of the assumptions used in the one sample t-test?
A) The population values have a normally distribution.
B) The population values are normally distributed.
C) The sample values were randomly chosen from the population.
D) The sample values were non-randomly chosen from the population.
A) The population values have a normally distribution.
B) The population values are normally distributed.
C) The sample values were randomly chosen from the population.
D) The sample values were non-randomly chosen from the population.
Unlock Deck
Unlock for access to all 46 flashcards in this deck.
Unlock Deck
k this deck
26
Consider a data sample consisting of 12 values with a mean of 22 and variance of 1.5. What is the 95% confidence interval for the variance?
A) 0.75 < σ2 < 4.32
B) 0.87 < σ2 < 2.08
C) 1.02 < σ2 < 2.87
D) 1.03 < σ2 < 8.26
A) 0.75 < σ2 < 4.32
B) 0.87 < σ2 < 2.08
C) 1.02 < σ2 < 2.87
D) 1.03 < σ2 < 8.26
Unlock Deck
Unlock for access to all 46 flashcards in this deck.
Unlock Deck
k this deck
27
Consider a data sample consisting of 12 values with a mean of 22 and variance of 1.5. What is the approximate 95% confidence interval for the standard deviation?
A) 0.75 < σ < 4.32
B) 0.87 < σ < 2.08
C) 1.02 < σ < 2.87
D) 1.03 < σ < 8.26
A) 0.75 < σ < 4.32
B) 0.87 < σ < 2.08
C) 1.02 < σ < 2.87
D) 1.03 < σ < 8.26
Unlock Deck
Unlock for access to all 46 flashcards in this deck.
Unlock Deck
k this deck
28
Consider a data sample consisting of 12 values with a mean of 22 and standard deviation of 1.5. What is the 95% confidence interval for the variance?
A) 0.75 < σ2 < 4.32
B) 0.87 < σ2 < 2.08
C) 1.02 < σ2 < 2.87
D) 1.13 < σ2 < 6.49
A) 0.75 < σ2 < 4.32
B) 0.87 < σ2 < 2.08
C) 1.02 < σ2 < 2.87
D) 1.13 < σ2 < 6.49
Unlock Deck
Unlock for access to all 46 flashcards in this deck.
Unlock Deck
k this deck
29
Consider a data sample consisting of 12 values with a mean of 22 and standard deviation of 1.5. What is the approximate 95% confidence interval for the standard deviation?
A) 0.75 < σ < 4.32
B) 0.87 < σ < 2.08
C) 1.06 < σ < 2.55
D) 1.03 < σ < 8.26
A) 0.75 < σ < 4.32
B) 0.87 < σ < 2.08
C) 1.06 < σ < 2.55
D) 1.03 < σ < 8.26
Unlock Deck
Unlock for access to all 46 flashcards in this deck.
Unlock Deck
k this deck
30
The t-distribution is wider than the normal distribution.
Unlock Deck
Unlock for access to all 46 flashcards in this deck.
Unlock Deck
k this deck
31
The t-distribution is wider for larger sample sizes than for smaller ones.
Unlock Deck
Unlock for access to all 46 flashcards in this deck.
Unlock Deck
k this deck
32
For a pair of samples with the same sample size, but where the second has a standard deviation twice as large, the 95% confidence interval for the second sample is twice as wide as the first.
Unlock Deck
Unlock for access to all 46 flashcards in this deck.
Unlock Deck
k this deck
33
For a pair of samples with the same standard deviation, but where the second has a sample size twice as large, the 95% confidence interval for the second sample is half as wide as the first.
Unlock Deck
Unlock for access to all 46 flashcards in this deck.
Unlock Deck
k this deck
34
When a one sample t-test rejects the null hypothesis, then the 95% confidence interval of the population mean would typically include the value specified in the null hypothesis.
Unlock Deck
Unlock for access to all 46 flashcards in this deck.
Unlock Deck
k this deck
35
If the 95% confidence interval of the population mean includes the value specified in the null hypothesis, then we expect the P-value of the one-sample t-test to be larger than 0.05.
Unlock Deck
Unlock for access to all 46 flashcards in this deck.
Unlock Deck
k this deck
36
The t-test is very sensitive to deviations from normality in the population sampled, especially for large sample sizes.
Unlock Deck
Unlock for access to all 46 flashcards in this deck.
Unlock Deck
k this deck
37
To calculate the confidence intervals for variance and standard deviation, we use the t-distribution.
Unlock Deck
Unlock for access to all 46 flashcards in this deck.
Unlock Deck
k this deck
38
Calculation of the confidence intervals for variance and standard deviation may be highly prone to error if the population is not normally distributed.
Unlock Deck
Unlock for access to all 46 flashcards in this deck.
Unlock Deck
k this deck
39
Consider the figure shown indicating the number of moles on the skin of a set of 30 patients examined by a dermatologist. Published reports claim that the mean number for the population these patients come from is 3.4 moles. Conduct a one-sample t-test on this data and determine whether this seems to be true. Assume a = 0.5. In your answer, present the following: your calculated t-value, an exact P-value using a computer or a range for the P-value using a table of critical values, and a statement about whether the population mean appears to be 3.4 or not based on the sample.
Unlock Deck
Unlock for access to all 46 flashcards in this deck.
Unlock Deck
k this deck
40
Consider the figure shown indicating the number of moles on the skin of a set of 25 patients examined by a dermatologist. Published reports claim that the mean number for the population these patients come from is 3.5 moles. Conduct a one-sample t-test on this data and determine whether this seems to be true. Assume a = 0.5. In your answer present the following: your calculated t-value, an exact P-value using a computer or a range for the P-value using a table of critical values, and a statement about whether the population mean appears to be 3.5 or not based on the sample.
Unlock Deck
Unlock for access to all 46 flashcards in this deck.
Unlock Deck
k this deck
41
Consider a study on the diet of coyotes. The table shown indicates an analysis of the bones found in the stomachs of 40 roadkill coyotes, and the number of species found in each was measured. Previous studies claim that the mean number of species eaten by coyotes (i.e., the number of species expected in the stomach contents) is 4.5 species per coyote. Conduct a one-sample t-test on this data and determine whether this seems to be true. Assume a = 0.5. In your answer, present the following: your calculated t-value, an exact P-value using a computer or a range for the P-value using a table of critical values, and a statement about whether the population mean appears to be 4.5 or not based on the sample.
Unlock Deck
Unlock for access to all 46 flashcards in this deck.
Unlock Deck
k this deck
42
Consider a study on the diet of coyotes. The table shown indicates an analysis of the bones found in the stomachs of 26 roadkill coyotes, and the number of species found in each was measured. Previous studies claim that the mean number of species eaten by coyotes (i.e., the number of species expected in the stomach contents) is 3.4 species per coyote. Conduct a one-sample t-test on this data and determine whether this seems to be true. Assume a = 0.5. In your answer, present the following: your calculated t-value, an exact P-value using a computer or a range for the P-value using a table of critical values, and a statement about whether the population mean appears to be 3.4 or not based on the sample.
Unlock Deck
Unlock for access to all 46 flashcards in this deck.
Unlock Deck
k this deck
43
Consider a sample with 25 values that has sample mean of 8.00 and a standard deviation of 5.00. Does this sample provide sufficient evidence to conclude that the mean of the population it was sampled from differs from 6.00?
Unlock Deck
Unlock for access to all 46 flashcards in this deck.
Unlock Deck
k this deck
44
Consider a sample with 21 values that has sample mean of 8.00 and a standard deviation of 4.00. Does this sample provide sufficient evidence to conclude that the mean of the population it was sampled from differs from 6.00?
Unlock Deck
Unlock for access to all 46 flashcards in this deck.
Unlock Deck
k this deck
45
For the data set shown below, calculate the following values: sample mean, 95% confidence interval for the population mean, sample variance, 95% confidence interval for the population variance, sample standard deviation, approximate 95% confidence interval for the population standard deviation.
Unlock Deck
Unlock for access to all 46 flashcards in this deck.
Unlock Deck
k this deck
46
For the data set shown below, calculate the following values: sample mean, 95% confidence interval for the population mean, sample variance, 95% confidence interval for the population variance, sample standard deviation, approximate 95% confidence interval for the population standard deviation.
Unlock Deck
Unlock for access to all 46 flashcards in this deck.
Unlock Deck
k this deck
Unlock Deck
Unlock for access to all 46 flashcards in this deck.


