Exam 11: Inference for a Normal Population
Exam 1: Statistics and Samples36 Questions
Exam 2: Displaying Data55 Questions
Exam 3: Describing Data49 Questions
Exam 4: Estimating With Uncertainty47 Questions
Exam 5: Probability50 Questions
Exam 6: Hypothesis Testing40 Questions
Exam 7: Analyzing Proportions54 Questions
Exam 8: Fitting Probability Models to Frequency Data53 Questions
Exam 9: Contingency Analysis: Associations Between56 Questions
Exam 10: The Normal Distribution51 Questions
Exam 11: Inference for a Normal Population46 Questions
Exam 12: Comparing Two Means53 Questions
Exam 13: Handling Violations of Assumptions38 Questions
Exam 14: Designing Experiments56 Questions
Exam 15: Comparing Means of More Than Two Groups54 Questions
Exam 16: Correlation Between Numerical Variables49 Questions
Exam 17: Regression54 Questions
Exam 18: Multiple Explanatory Variables47 Questions
Exam 19: Computer-Intensive Methods25 Questions
Exam 20: Likelihood33 Questions
Exam 21: Meta-Analysis: Combining Information From38 Questions
Select questions type
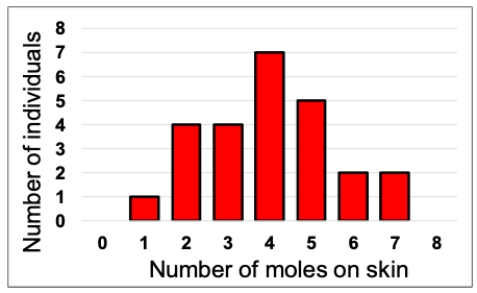
Consider the figure shown indicating the number of moles on the skin of a set of 25 patients examined by a dermatologist. Published reports claim that the mean number for the population these patients come from is 3.5 moles. Conduct a one-sample t-test on this data and determine whether this seems to be true. Assume a = 0.5. In your answer present the following: your calculated t-value, an exact P-value using a computer or a range for the P-value using a table of critical values, and a statement about whether the population mean appears to be 3.5 or not based on the sample.
Free
(Not Answered)
This question doesn't have any answer yet
Consider a situation in which Jamal measures the resting heart rate of 16 individuals from a population that he thinks (based on published reports) has an average resting heart rate of 72 beats per minute. His sample has a mean of 75.2 with a standard deviation of 6.2 cm. Based on his t-test statistic, and using your table of critical t-values, which of the following P-value ranges matches the one for the t-value he obtains?
Free
(Multiple Choice)
4.9/5  (37)
(37)
Correct Answer: Verified
A
Using your table of critical t-values, what values of t correspond to the ones that bound a central region containing 90% of the distribution when there are 16 degrees of freedom?
Free
(Multiple Choice)
4.9/5 (33)
Correct Answer:Verified
B
For the data set shown below, calculate the following values: sample mean, 95% confidence interval for the population mean, sample variance, 95% confidence interval for the population variance, sample standard deviation, approximate 95% confidence interval for the population standard deviation.
Data:
2 2 3 3 3 4 4 4 4 4 5 5 5 5 5 5 5 6 6 6 6 6 7 7 7 8 8
(Essay)
4.8/5 (41)
If a sample with 34 values has a mean of 33 and a standard deviation of 35, how many degrees of freedom does it have?
(Multiple Choice)
4.9/5 (40)
For a pair of samples with the same standard deviation, but where the second has a sample size twice as large, the 95% confidence interval for the second sample is half as wide as the first.
(True/False)
4.8/5 (35)
If we have a 95% confidence interval of 14.69 < μ < 15.85 based on a sample of 18 values, what is the standard deviation of the sample?
(Multiple Choice)
4.9/5 (23)
If we have a sample of 14 values that gives us a 99% confidence interval of 5.76 < μ < 8.54, what is the standard deviation of the sample?
(Multiple Choice)
4.8/5 (39)
Consider a data sample consisting of 12 values with a mean of 22 and standard deviation of 1.5. What is the approximate 95% confidence interval for the standard deviation?
(Multiple Choice)
5.0/5 (36)
What is the correct representation for the 5% critical t-value for a sample with 9 degrees of freedom?
(Multiple Choice)
4.8/5 (30)
For the data set shown below, calculate the following values: sample mean, 95% confidence interval for the population mean, sample variance, 95% confidence interval for the population variance, sample standard deviation, approximate 95% confidence interval for the population standard deviation.
Data:
1 2 2 2 3 3 3 3 4 4 4 4 4 4 5 5 5 5 6 6 6 7
(Essay)
4.8/5 (32)
Consider a data sample consisting of 12 values with a mean of 22 and variance of 1.5. What is the 95% confidence interval for the variance?
(Multiple Choice)
4.9/5 (32)
If a t-test results in a sample mean the same as the hypothesized population mean, then the t-statistic and P-value of the test would be which of the following (respectively)?
(Multiple Choice)
5.0/5 (25)
Consider a data sample consisting of 12 values with a mean of 22 and standard deviation of 1.5. What is the 95% confidence interval for the variance?
(Multiple Choice)
4.9/5 (29)
How many standard errors in width is the 95% confidence interval for a sample with 20 values?
(Multiple Choice)
4.9/5 (27)
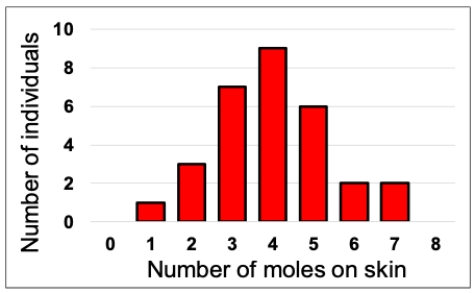
Consider the figure shown indicating the number of moles on the skin of a set of 30 patients examined by a dermatologist. Published reports claim that the mean number for the population these patients come from is 3.4 moles. Conduct a one-sample t-test on this data and determine whether this seems to be true. Assume a = 0.5. In your answer, present the following: your calculated t-value, an exact P-value using a computer or a range for the P-value using a table of critical values, and a statement about whether the population mean appears to be 3.4 or not based on the sample.
(Not Answered)
This question doesn't have any answer yet
The t-distribution is wider for larger sample sizes than for smaller ones.
(True/False)
4.9/5 (35)
For a t-test using a sample of 35 values which returns a positive value, how big must the t-test statistic be to reject the null hypothesis?
(Multiple Choice)
4.9/5 (29)
Consider an experiment in which Shireen measures 20 Arabidopsis plants in a pasture that an agricultural company claims have an average height of exactly 23 cm. Her plants have a mean of 24.53 cm with a standard deviation of 2.33 cm, however. Based on her t-test statistic, and using your table of critical t values, which of the following P-value ranges matches the one for the t-value she obtains?
(Multiple Choice)
4.8/5 (37)
Filters
- Essay(0)
- Multiple Choice(0)
- Short Answer(0)
- True False(0)
- Matching(0)