Deck 1: Statistics and Samples
Full screen (f)
Question
Question
Question
Question
Question
Question
Question
Question
Question
Question
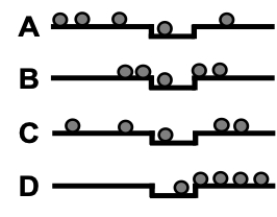
Consider the figure showing the final position of balls dropped that had been aimed at the indentation. Which of the plots shows the situation best described as good accuracy, good precision?

A) Plot A
B) Plot B
C) Plot C
D) Plot D
A) Plot A
B) Plot B
C) Plot C
D) Plot D
Question
Consider the figure showing the final position of balls dropped that had been aimed at the indentation. Which of the plots shows the situation best described as good accuracy, poor precision?

A) Plot A
B) Plot B
C) Plot C
D) Plot D
A) Plot A
B) Plot B
C) Plot C
D) Plot D
Question
Consider the figure showing the final position of balls dropped that had been aimed at the indentation. Which of the plots shows the situation best described as poor accuracy, good precision?
A) Plot A
B) Plot B
C) Plot C
D) Plot D
A) Plot A
B) Plot B
C) Plot C
D) Plot D
Question
Consider the figure showing the final position of balls dropped that had been aimed at the indentation. Which of the plots shows the situation best described as poor accuracy, poor precision?

A) Plot A
B) Plot B
C) Plot C
D) Plot D
A) Plot A
B) Plot B
C) Plot C
D) Plot D
Question
Question
Question
Question
Question
Question
Question
Question
Question
Question
Question
Question
Question
Question
Question
Question
Question
Question
Question
Question
Question
Question
Magpies are a type of bird that collects colored objects for their nests. Consider the data shown depicting a total of 18 observations of variously colored objects found in a magpie nest.
What are the absolute and relative frequencies of each color?
Blue:
Green:
Yellow:
Orange:
Red:
Purple:
Black:
White:
What are the absolute and relative frequencies of each color?
Blue:
Green:
Yellow:
Orange:
Red:
Purple:
Black:
White:
Question

Unlock Deck
Sign up to unlock the cards in this deck!
Unlock Deck
Unlock Deck
1/36
Play
Full screen (f)
Deck 1: Statistics and Samples
1
In ______ studies, subjects are randomly assigned to treatment groups, whereas in ______ studies, subjects are assigned to treatment groups for reasons beyond the control of the researchers.
A) experimental : observational
B) observational : experimental
C) scientific : unscientific
D) unscientific : scientific
A) experimental : observational
B) observational : experimental
C) scientific : unscientific
D) unscientific : scientific
A
2
When considering the deviation between calculated statistics and the true parameter, how consistently the statistics generate similar values is referred to as defining their ______ , whereas how close the statistics are to the true parameter defines their ______.
A) accuracy : precision
B) precision : accuracy
C) robustness : quality
D) quality : robustness
A) accuracy : precision
B) precision : accuracy
C) robustness : quality
D) quality : robustness
A
3
Which best describes the use of statistics to understand reality?
A) We use data from a sample and concepts from statistics to make estimates about populations.
B) We use data from a population and concepts from statistics to make estimates about samples.
C) We use data to compare samples to populations.
D) We use concepts from statistics to improve our estimates of sample characteristics.
A
4
Which of the following is correct?
A) Populations are described by parameters, whereas samples provide estimates or statistics.
B) Populations are described by estimates, whereas samples provide parameters or statistics.
C) Populations are described by statistics, whereas samples provide estimates or parameters.
D) Populations are described by statistics or parameters, whereas samples provide estimates.
Unlock Deck
Unlock for access to all 36 flashcards in this deck.
Unlock Deck
k this deck
5
Which of the following is a valid statistical hypothesis?
A)The mean blood pressure of a population of people taking an experimental drug is higher than the mean for a population of those who don't.
B)The mean temperature of a sample of patients administered ice packs is lower than the mean of a sample given a blanket.
C)The range of height values for wild giraffes is larger than the range of heights for giraffes in captivity.
D)Colonies of E. Coli exposed to high salt levels reproduce more slowly than ones exposed to low salt levels.
Unlock Deck
Unlock for access to all 36 flashcards in this deck.
Unlock Deck
k this deck
6
Which of the following is the best definition of estimation?
A) Increasing a sample yields better data.
B) Predicting a measured value before the measurements begin.
C) The process of rounding values to specific degrees of accuracy.
D) Using sample data to infer population data.
A) Increasing a sample yields better data.
B) Predicting a measured value before the measurements begin.
C) The process of rounding values to specific degrees of accuracy.
D) Using sample data to infer population data.
Unlock Deck
Unlock for access to all 36 flashcards in this deck.
Unlock Deck
k this deck
7
Other terms for a "sampling unit" include all of the following, except one.
A) Individual
B) Replicate
C) Statistic
D) Subject
A) Individual
B) Replicate
C) Statistic
D) Subject
Unlock Deck
Unlock for access to all 36 flashcards in this deck.
Unlock Deck
k this deck
8
Ideal samples are unbiased; which of the following terms is a synonym for unbiased in this context?
A) Accurate
B) Centered
C) Precise
D) Proportional
A) Accurate
B) Centered
C) Precise
D) Proportional
Unlock Deck
Unlock for access to all 36 flashcards in this deck.
Unlock Deck
k this deck
9
Sampling error is defined as differences between the estimate and the estimated parameter due to which of the following?
A) Bias in the sample.
B) Errors due to rounding sample statistics too much.
C) Mistakes during sampling.
D) Randomness during sampling.
A) Bias in the sample.
B) Errors due to rounding sample statistics too much.
C) Mistakes during sampling.
D) Randomness during sampling.
Unlock Deck
Unlock for access to all 36 flashcards in this deck.
Unlock Deck
k this deck
10
Consider the figure showing the final position of balls dropped that had been aimed at the indentation. Which of the plots shows the situation best described as good accuracy, good precision?
A) Plot A
B) Plot B
C) Plot C
D) Plot D
A) Plot A
B) Plot B
C) Plot C
D) Plot D
Unlock Deck
Unlock for access to all 36 flashcards in this deck.
Unlock Deck
k this deck
11
Consider the figure showing the final position of balls dropped that had been aimed at the indentation. Which of the plots shows the situation best described as good accuracy, poor precision?
A) Plot A
B) Plot B
C) Plot C
D) Plot D
A) Plot A
B) Plot B
C) Plot C
D) Plot D
Unlock Deck
Unlock for access to all 36 flashcards in this deck.
Unlock Deck
k this deck
12
Consider the figure showing the final position of balls dropped that had been aimed at the indentation. Which of the plots shows the situation best described as poor accuracy, good precision?
A) Plot A
B) Plot B
C) Plot C
D) Plot D
A) Plot A
B) Plot B
C) Plot C
D) Plot D
Unlock Deck
Unlock for access to all 36 flashcards in this deck.
Unlock Deck
k this deck
13
Consider the figure showing the final position of balls dropped that had been aimed at the indentation. Which of the plots shows the situation best described as poor accuracy, poor precision?
A) Plot A
B) Plot B
C) Plot C
D) Plot D
A) Plot A
B) Plot B
C) Plot C
D) Plot D
Unlock Deck
Unlock for access to all 36 flashcards in this deck.
Unlock Deck
k this deck
14
Imagine there is a forest with 2000 trees, and we want to know the average height. Which of the following is the best procedure to generate an unbiased sample of size 50?
A) Measure all the heights and then choose the 50 with the heights closest to the average.
B) Measure the 50 trees closest to the center of the forest.
C) Number all the tree, randomly generate 50 numbers between 1 and 2000, and measure those trees.
D) Number all the trees, then starting with the first tree, measure each 2000/50 = 40th tree.
Unlock Deck
Unlock for access to all 36 flashcards in this deck.
Unlock Deck
k this deck
15
When a researcher takes a sample of individuals because they are easily available, rather than choosing randomly, we say they have done which of the following?
A) Taken a "biased sample."
B) Taken a "sample of convenience."
C) Taken a "saturated sample."
D) Taken an "availability sample."
A) Taken a "biased sample."
B) Taken a "sample of convenience."
C) Taken a "saturated sample."
D) Taken an "availability sample."
Unlock Deck
Unlock for access to all 36 flashcards in this deck.
Unlock Deck
k this deck
16
When a study recruits people at large and some types of people sign up more because of a systematic difference in their behavior, our sample may be prone to which of the following types of bias?
A) Behavioral bias
B) Readiness bias
C) Sampling bias
D) Volunteer bias
A) Behavioral bias
B) Readiness bias
C) Sampling bias
D) Volunteer bias
Unlock Deck
Unlock for access to all 36 flashcards in this deck.
Unlock Deck
k this deck
17
Characteristics or measurements that differ from individual to individual are called which of the following?
A) Data
B) Statistics
C) Treatments
D) Variables
A) Data
B) Statistics
C) Treatments
D) Variables
Unlock Deck
Unlock for access to all 36 flashcards in this deck.
Unlock Deck
k this deck
18
The measurements of one or more variables made on a sample of individuals is called which of the following?
A) Data
B) Parameters
C) Treatments
D) Variates
A) Data
B) Parameters
C) Treatments
D) Variates
Unlock Deck
Unlock for access to all 36 flashcards in this deck.
Unlock Deck
k this deck
19
Variables that describe membership in certain qualitative categories or groups are termed which of the following?
A) Categorical
B) Numerical
C) Non-quantitative
D) Separable
A) Categorical
B) Numerical
C) Non-quantitative
D) Separable
Unlock Deck
Unlock for access to all 36 flashcards in this deck.
Unlock Deck
k this deck
20
When we consider categorical variables, if the categories have no order, we term them _____, whereas if the categories have an order, we term them _____.
A) ordinal : nominal
B) nominal : ordinal
C) random : sequential
D) sequential : random
A) ordinal : nominal
B) nominal : ordinal
C) random : sequential
D) sequential : random
Unlock Deck
Unlock for access to all 36 flashcards in this deck.
Unlock Deck
k this deck
21
If we measured the mass of subjects and then placed these observed individuals into groups with the labels "light," "medium," and "heavy," what type of variable have we created for our sample?
A) Ordinal categorical
B) Ordinal quantitative
C) Nominal categorical
D) Nominal quantitative
A) Ordinal categorical
B) Ordinal quantitative
C) Nominal categorical
D) Nominal quantitative
Unlock Deck
Unlock for access to all 36 flashcards in this deck.
Unlock Deck
k this deck
22
If we administered psychological tests to a set of students and then placed these subjects into groups with the labels "anxious," "calm," "angry," and "control," what type of variable have we created for our sample?
A) Ordinal categorical
B) Ordinal quantitative
C) Nominal categorical
D) Nominal quantitative
A) Ordinal categorical
B) Ordinal quantitative
C) Nominal categorical
D) Nominal quantitative
Unlock Deck
Unlock for access to all 36 flashcards in this deck.
Unlock Deck
k this deck
23
When we look at the association between two variables, we term the one that predicts or influences the other the _____ variable, whereas the one being influenced is termed the _____ variable.
A) baseline : resultant
B) causal : influential
C) dependent : independent
D) explanatory : response
A) baseline : resultant
B) causal : influential
C) dependent : independent
D) explanatory : response
Unlock Deck
Unlock for access to all 36 flashcards in this deck.
Unlock Deck
k this deck
24
When we look at a sample, the number of times a specific measurement is observed is called the _____ of the observation.
A) Frequency
B) Probability
C) Proportion
D) Statistic
A) Frequency
B) Probability
C) Proportion
D) Statistic
Unlock Deck
Unlock for access to all 36 flashcards in this deck.
Unlock Deck
k this deck
25
For the data set: 1, 1, 1, 2, 3, 3, 4, 5, 5, 5
Which of the following is true?
A) The absolute frequency of "4" is 1, and the relative frequency of "1" is 3.
B) The absolute frequency of "4" is 1, and the relative frequency of "1" is 0.3.
C) The absolute frequency of "4" is 0.1, and the relative frequency of "1" is 3.
D) The absolute frequency of "4" is 0.1, and the relative frequency of "1" is 0.3.
Unlock Deck
Unlock for access to all 36 flashcards in this deck.
Unlock Deck
k this deck
26
For the data set: 1, 3, 6, 6, 7, 7, 7, 8, 8, 9
Which of the following is true?
A) The absolute frequency of "6" is 0.2, and the relative frequency of "7" is 0.3.
B) The absolute frequency of "6" is 0.2, and the relative frequency of "7" is 3.
C) The absolute frequency of "6" is 2, and the relative frequency of "7" is 0.3.
D) The absolute frequency of "6" is 2, and the relative frequency of "7" is 3.
Unlock Deck
Unlock for access to all 36 flashcards in this deck.
Unlock Deck
k this deck
27
The most important probability distribution in statistics looks like a "bell curve" and is called the _____ distribution.
A) Control
B) Normal
C) Proportional
D) Symmetric
A) Control
B) Normal
C) Proportional
D) Symmetric
Unlock Deck
Unlock for access to all 36 flashcards in this deck.
Unlock Deck
k this deck
28
When subjects in studies are randomly assigned to treatment groups, we call this a(n) _____ study, whereas if the subjects are in treatment groups for some other reasons, we call this a(n) _____ study.
A) case-control : cohort
B) cohort : case-control
C) experimental : observational
D) observational : experimental
A) case-control : cohort
B) cohort : case-control
C) experimental : observational
D) observational : experimental
Unlock Deck
Unlock for access to all 36 flashcards in this deck.
Unlock Deck
k this deck
29
If we are conducting a study and seeking to determine the relationship between two variables, but a third variable complicates the situation and makes it hard to figure out the causal relationship, we term this third variable a(n) _____ variable.
A) Confounding
B) Interfering
C) Non-linear
D) Random
A) Confounding
B) Interfering
C) Non-linear
D) Random
Unlock Deck
Unlock for access to all 36 flashcards in this deck.
Unlock Deck
k this deck
30
Which of the following is the best description of our approach to statistics?
A) We calculate statistics to look for mathematical relationships between samples and
populations.
B) We perform mathematical operations with data values in order to compare the values in
samples to the values in populations.
C) We take samples from populations in order to calculate parameters, which we can then use
to predict the statistics of the population.
D) We want to know about a population but can't measure everything, so we use data from
a subset to infer what is probable for the population.
Unlock Deck
Unlock for access to all 36 flashcards in this deck.
Unlock Deck
k this deck
31
Which of the following is a major benefit of experimental studies over observational ones?
A) They are less biased.
B) They are more accurate and precise.
C) They can separate categorical and numerical variables.
D) They can separate explanatory and confounding variables.
A) They are less biased.
B) They are more accurate and precise.
C) They can separate categorical and numerical variables.
D) They can separate explanatory and confounding variables.
Unlock Deck
Unlock for access to all 36 flashcards in this deck.
Unlock Deck
k this deck
32
Compare and contrast the following four terms: sample, statistic, parameter, and population.
Unlock Deck
Unlock for access to all 36 flashcards in this deck.
Unlock Deck
k this deck
33
Define the two major types of variables and identify and describe two important subsets within each of these two broad categories.
Unlock Deck
Unlock for access to all 36 flashcards in this deck.
Unlock Deck
k this deck
34
Describe what explanatory and response variables are and why these terms are superior to the more traditional terms independent and dependent.
Unlock Deck
Unlock for access to all 36 flashcards in this deck.
Unlock Deck
k this deck
35
Magpies are a type of bird that collects colored objects for their nests. Consider the data shown depicting a total of 18 observations of variously colored objects found in a magpie nest.
What are the absolute and relative frequencies of each color?
Blue:
Green:
Yellow:
Orange:
Red:
Purple:
Black:
White:
What are the absolute and relative frequencies of each color?
Blue:
Green:
Yellow:
Orange:
Red:
Purple:
Black:
White:
Unlock Deck
Unlock for access to all 36 flashcards in this deck.
Unlock Deck
k this deck
36
The phrase "correlation does not imply causation" is often used to dismiss observed correlations. Explain why this dismissal is not the best approach.
Unlock Deck
Unlock for access to all 36 flashcards in this deck.
Unlock Deck
k this deck
Unlock Deck
Unlock for access to all 36 flashcards in this deck.


