Deck 8: From Estimation to Statistical Tests: Hypothesis Testing for One Population Mean and Proportion
Full screen (f)
Question
Question
Question
Question
Question
Question
Question
Question
Question
6. In the figure below, one would reject the null hypothesis if ______. 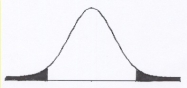
A) the z/t-value fell into the unshaded region
B) the z/t-value fell into the shaded region
C) the z/t-value fell directly on the middle of the distribution
D) the z/t-value fell right before entering the shaded region
A) the z/t-value fell into the unshaded region
B) the z/t-value fell into the shaded region
C) the z/t-value fell directly on the middle of the distribution
D) the z/t-value fell right before entering the shaded region
Question
The distribution below illustrates which of the following? 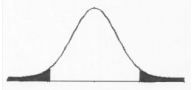
A) one-tailed null hypothesis
B) nondirectional null hypothesis
C) directional alternative hypothesis
D) two-tailed alternative hypothesis
A) one-tailed null hypothesis
B) nondirectional null hypothesis
C) directional alternative hypothesis
D) two-tailed alternative hypothesis
Question
In the distribution below, for a one-tailed alternative hypothesis test at an alpha level of 0.05, which z critical value would allow us to reject the null hypothesis? 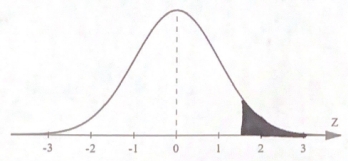
A)
B)
C)
D) Unidentifiable
A)
B)
C)
D) Unidentifiable
Question
Question
Question
Question
Question
Question
Question
Question
Question
Question
Question
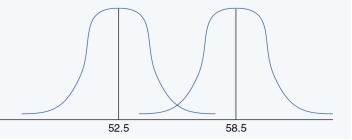
We hypothesized that our sample mean of 58.5 is larger than the population mean of 52.5. This is can be graphed in the following manner.
Question
Question

Unlock Deck
Sign up to unlock the cards in this deck!
Unlock Deck
Unlock Deck
1/24
Play
Full screen (f)
Deck 8: From Estimation to Statistical Tests: Hypothesis Testing for One Population Mean and Proportion
1
Why is probability theory needed rather than assuming that a finding is different from that of the population?
A) Due to sampling variation a sample will always be at least slightly different from the population
B) To be 100% sure that our findings are correct
C) To say that our independent variable unquestionably causes the dependent variable
D) Confidence intervals are not enough to be certain of our findings
A
2
The null hypothesis always ______.
A) assumes there is a relationship between the independent and dependent variables
B) assumes there is no relationship between the independent and dependent variables
C) helps us be 100% certain our findings are real
D) can be proven wrong
A) assumes there is a relationship between the independent and dependent variables
B) assumes there is no relationship between the independent and dependent variables
C) helps us be 100% certain our findings are real
D) can be proven wrong
B
3
What type of hypothesis is a researcher stating when they say "I hypothesize that the independent variable influences the dependent variable"?
A) directional alternative hypothesis test (one-tailed)
B) negative directional alternative hypothesis test
C) positive directional alternative hypothesis test
D) nondirectional alternative hypothesis test (two-tailed)
A) directional alternative hypothesis test (one-tailed)
B) negative directional alternative hypothesis test
C) positive directional alternative hypothesis test
D) nondirectional alternative hypothesis test (two-tailed)
D
4
Which of the following is a correctly stated null hypothesis?
A) H0: 10
B) H0: = 10
C) H0 > 10
D) H0: < 10
A) H0: 10
B) H0: = 10
C) H0 > 10
D) H0: < 10
Unlock Deck
Unlock for access to all 24 flashcards in this deck.
Unlock Deck
k this deck
5
The statement ______ is an example of a ______.
A) ? 5; null hypothesis
B) > 5; null hypothesis
C) < 5; null hypothesis
D) = 5; null hypothesis
A) ? 5; null hypothesis
B) > 5; null hypothesis
C) < 5; null hypothesis
D) = 5; null hypothesis
Unlock Deck
Unlock for access to all 24 flashcards in this deck.
Unlock Deck
k this deck
6
What type of hypothesis is a researcher stating when they say "I hypothesize that the independent variable positively influences the dependent variable"?
A) directional alternative hypothesis test (one-tailed)
B) nondirectional alternative hypothesis test
C) negative directional alternative hypothesis test
D) nondirectional alternative hypothesis test (two-tailed)
A) directional alternative hypothesis test (one-tailed)
B) nondirectional alternative hypothesis test
C) negative directional alternative hypothesis test
D) nondirectional alternative hypothesis test (two-tailed)
Unlock Deck
Unlock for access to all 24 flashcards in this deck.
Unlock Deck
k this deck
7
Using the first step in hypothesis testing, how would one represent the following statement from a researcher, "I hypothesize that my sample mean is different from the population mean"?
A)
B)
C)
D)
A)
B)
C)
D)
Unlock Deck
Unlock for access to all 24 flashcards in this deck.
Unlock Deck
k this deck
8
For a two-tailed hypothesis test with a significance alpha level of .05, what is the critical z-value?
A) 3.08
B) 1.96
C) +1.95
D) -1.96
A) 3.08
B) 1.96
C) +1.95
D) -1.96
Unlock Deck
Unlock for access to all 24 flashcards in this deck.
Unlock Deck
k this deck
9
6. In the figure below, one would reject the null hypothesis if ______.
A) the z/t-value fell into the unshaded region
B) the z/t-value fell into the shaded region
C) the z/t-value fell directly on the middle of the distribution
D) the z/t-value fell right before entering the shaded region
A) the z/t-value fell into the unshaded region
B) the z/t-value fell into the shaded region
C) the z/t-value fell directly on the middle of the distribution
D) the z/t-value fell right before entering the shaded region
Unlock Deck
Unlock for access to all 24 flashcards in this deck.
Unlock Deck
k this deck
10
The distribution below illustrates which of the following?
A) one-tailed null hypothesis
B) nondirectional null hypothesis
C) directional alternative hypothesis
D) two-tailed alternative hypothesis
A) one-tailed null hypothesis
B) nondirectional null hypothesis
C) directional alternative hypothesis
D) two-tailed alternative hypothesis
Unlock Deck
Unlock for access to all 24 flashcards in this deck.
Unlock Deck
k this deck
11
In the distribution below, for a one-tailed alternative hypothesis test at an alpha level of 0.05, which z critical value would allow us to reject the null hypothesis?
A)
B)
C)
D) Unidentifiable
A)
B)
C)
D) Unidentifiable
Unlock Deck
Unlock for access to all 24 flashcards in this deck.
Unlock Deck
k this deck
12
Deciding to use a directional versus nondirectional alternative hypothesis most directly affects ______.
A) the standard deviation
B) the sample size
C) the critical value(s)
D) the degrees of freedom
A) the standard deviation
B) the sample size
C) the critical value(s)
D) the degrees of freedom
Unlock Deck
Unlock for access to all 24 flashcards in this deck.
Unlock Deck
k this deck
13
For a sample size of 29, we would rely on the ______.
A) z-distribution
B) t-distribution
C) either z- or t-distribution
D) neither z- or t-distribution
A) z-distribution
B) t-distribution
C) either z- or t-distribution
D) neither z- or t-distribution
Unlock Deck
Unlock for access to all 24 flashcards in this deck.
Unlock Deck
k this deck
14
For a sample size of 30, we would rely on the ______.
A) z-distribution
B) t-distribution
C) either z- or t-distribution
D) neither z- or t-distribution
A) z-distribution
B) t-distribution
C) either z- or t-distribution
D) neither z- or t-distribution
Unlock Deck
Unlock for access to all 24 flashcards in this deck.
Unlock Deck
k this deck
15
A researcher calculates a mean from a sample of 37 people. The following hypotheses are stated: H0: = 40 and H1: 40. For = .05, what is an appropriate critical value for his statistic?
A) 2.00
B) 1.96
C) -1.65
D) -1.6
A) 2.00
B) 1.96
C) -1.65
D) -1.6
Unlock Deck
Unlock for access to all 24 flashcards in this deck.
Unlock Deck
k this deck
16
When a researcher selects a particular alpha level, they are selecting the risk they are willing to take of making a Type II error.
Unlock Deck
Unlock for access to all 24 flashcards in this deck.
Unlock Deck
k this deck
17
The z- and t-distributions have nearly identical critical values when the sample size is over 120.
Unlock Deck
Unlock for access to all 24 flashcards in this deck.
Unlock Deck
k this deck
18
Because proportions are not whole numbers, the critical values for proportions are different than whole numbers.
Unlock Deck
Unlock for access to all 24 flashcards in this deck.
Unlock Deck
k this deck
19
Because the t- and z-distributions use different distributions, there respective equations for testing hypotheses are different.
Unlock Deck
Unlock for access to all 24 flashcards in this deck.
Unlock Deck
k this deck
20
The critical value of t at a given alpha level will be smaller than the comparable critical value of z and is much smaller when n is very small.
Unlock Deck
Unlock for access to all 24 flashcards in this deck.
Unlock Deck
k this deck
21
The following equation, , is used for obtaining the critical value for proportions.
Unlock Deck
Unlock for access to all 24 flashcards in this deck.
Unlock Deck
k this deck
22
We hypothesized that our sample mean of 58.5 is larger than the population mean of 52.5. This is can be graphed in the following manner.
Unlock Deck
Unlock for access to all 24 flashcards in this deck.
Unlock Deck
k this deck
23
Discuss the five steps in hypothesis testing.
Unlock Deck
Unlock for access to all 24 flashcards in this deck.
Unlock Deck
k this deck
24
Using distributions for visual depiction, draw out a two-tailed hypothesis test that your sample mean is different from that of the population. Draw out a one-tailed hypothesis test that your sample mean is smaller than that of the population. Draw out a one-tailed hypothesis test that your sample mean is larger than that of the population.
Unlock Deck
Unlock for access to all 24 flashcards in this deck.
Unlock Deck
k this deck
Unlock Deck
Unlock for access to all 24 flashcards in this deck.


