Deck 10: Quantitative Data Analysis
Full screen (f)
Question
Question
Question
Question
Question
Question
Question
Question
Question
Question
Question
Question
Question
Question
Question
Question
Question
Question
Question
Question
Question
Question
Question
Question
Question
Question
Question
Question
Question
Question
Question
Question
Question
Question
Question
Question
Question
Question
Question
Question
Question
Question
Question
Question
Question
Question
Question
Question
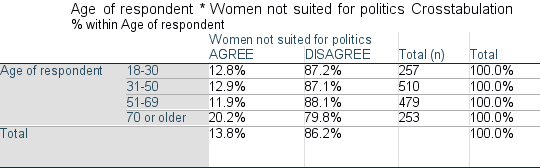
Question
Question
Describe how you should read the following table. In your discretion be careful to name the parts of the chart and establish what each tells us about the data.
Source: General Social Survey (National Opinion Research Center 2018).
Age of respondent * Women not suited for politics Crosstabulation
Source: General Social Survey (National Opinion Research Center 2018).
Age of respondent * Women not suited for politics Crosstabulation
Question

Unlock Deck
Sign up to unlock the cards in this deck!
Unlock Deck
Unlock Deck
1/51
Play
Full screen (f)
Deck 10: Quantitative Data Analysis
1
Which of the following should be included in a frequency distribution?
A) a title, sub labels for the values of the variables, a caption, and the base number N
B) a heading, sub headings for each category, and qualitative values for variables
C) the previously established relative frequency, variables values, and total percentage value
D) the descriptive statistics, categories, and central tendency
A
2
A ______ displays the number of cases or percentage of cases corresponding to each of a variables value or group of values.
Please check the usage of this article with the options. I don't think it suits it.
A) base number N
B) descriptive variable
C) frequency distribution
D) discaffm
Please check the usage of this article with the options. I don't think it suits it.
A) base number N
B) descriptive variable
C) frequency distribution
D) discaffm
C
3
______ is one of the most common and useful types of graphs.
A) Row charts
B) Plague graph
C) Frequency polygons
D) Base Number N
A) Row charts
B) Plague graph
C) Frequency polygons
D) Base Number N
C
4
In a ______, a continuous line connects the points representing the number or percentage of cases with each value.
A) frequency polygon
B) bar chart
C) histogram
D) central tendency
A) frequency polygon
B) bar chart
C) histogram
D) central tendency
Unlock Deck
Unlock for access to all 51 flashcards in this deck.
Unlock Deck
k this deck
5
Frequency distributions and ______ are the most common approaches for displaying the distribution of single variables.
A) frequency polygons
B) graphs
C) inferential statistics
D) surveys
A) frequency polygons
B) graphs
C) inferential statistics
D) surveys
Unlock Deck
Unlock for access to all 51 flashcards in this deck.
Unlock Deck
k this deck
6
Which of the following statements regarding a frequency distribution is accurate?
A) A frequency distribution is difficult to examine if it has many categories.
B) Frequency distributions cannot be applied to questions about attitudes.
C) Groupings should be created for categories only when researchers need to distort distributions.
D) Frequency distributions are most applicable for qualitative data analysis.
Unlock Deck
Unlock for access to all 51 flashcards in this deck.
Unlock Deck
k this deck
7
Which of the following is required of categories within frequency distributions?
A) They must distort the distribution.
B) They must be logically defensible.
C) They must eliminate undesirable variables.
D) They must be difficult to examine.
A) They must distort the distribution.
B) They must be logically defensible.
C) They must eliminate undesirable variables.
D) They must be difficult to examine.
Unlock Deck
Unlock for access to all 51 flashcards in this deck.
Unlock Deck
k this deck
8
Frequency distributions categories must be mutually exclusive and ______, so that every case can be classified in one and only one category.
A) exhaustive
B) qualifiable
C) easily readable
D) listed in degrees
A) exhaustive
B) qualifiable
C) easily readable
D) listed in degrees
Unlock Deck
Unlock for access to all 51 flashcards in this deck.
Unlock Deck
k this deck
9
Which of the following is a graph that has adjacent bars to display the distribution of quantitative variables along a continuum?
A) charts
B) lateral graphs
C) histograms
D) bar charts
A) charts
B) lateral graphs
C) histograms
D) bar charts
Unlock Deck
Unlock for access to all 51 flashcards in this deck.
Unlock Deck
k this deck
10
A ______ chart contains solid bars separated by spaces.
A) histography
B) pie
C) frequency
D) bar
A) histography
B) pie
C) frequency
D) bar
Unlock Deck
Unlock for access to all 51 flashcards in this deck.
Unlock Deck
k this deck
11
Which of the following is an alternative to the histogram for displaying the distribution of a quantitative variable.
A) pie chart
B) bar chart
C) frequency polygon
D) descriptive statistic
A) pie chart
B) bar chart
C) frequency polygon
D) descriptive statistic
Unlock Deck
Unlock for access to all 51 flashcards in this deck.
Unlock Deck
k this deck
12
Which of the following problems should researchers be aware of regarding distributions represented in graphs?
A) Chart "junk" can confuse the reader and obscure the distributions shape.
B) Bars within charts should be of different shapes and sizes to ease readability.
C) The difference between bars should be exaggerated depending on results.
D) Shortening or lengthening the vertical axis will eliminate differences in the number of cases between values.
Unlock Deck
Unlock for access to all 51 flashcards in this deck.
Unlock Deck
k this deck
13
Which type of statistics are useful for representing key features of the distribution of a variable?
A) summary
B) qualitative
C) variability
D) symmetry
A) summary
B) qualitative
C) variability
D) symmetry
Unlock Deck
Unlock for access to all 51 flashcards in this deck.
Unlock Deck
k this deck
14
Central tendency is usually summarized with one of three statistics. What are these statistics?
A) the mode, measure, and frequency
B) the mode, the median, and the mean
C) the mean, the level of measurement, and variability
D) frequency, variability, and the measure
A) the mode, measure, and frequency
B) the mode, the median, and the mean
C) the mean, the level of measurement, and variability
D) frequency, variability, and the measure
Unlock Deck
Unlock for access to all 51 flashcards in this deck.
Unlock Deck
k this deck
15
To choose an appropriate measure of central tendency, the analyst must consider which of the following?
A) the hypothesis being tested
B) the analyst's personal experiences
C) the purpose for which the statistic is used
D) the previous research findings
A) the hypothesis being tested
B) the analyst's personal experiences
C) the purpose for which the statistic is used
D) the previous research findings
Unlock Deck
Unlock for access to all 51 flashcards in this deck.
Unlock Deck
k this deck
16
Which term describes probability average?
A) measurement
B) frequency distribution
C) bimodal
D) mode
A) measurement
B) frequency distribution
C) bimodal
D) mode
Unlock Deck
Unlock for access to all 51 flashcards in this deck.
Unlock Deck
k this deck
17
The ______ is the only measure of ______ that can be used to characterize the tendency of variables measured at the nominal level.
A) mode; central tendency
B) measurement; bimodal frequency
C) central frequency; mean
D) trimodal variable; frequency
A) mode; central tendency
B) measurement; bimodal frequency
C) central frequency; mean
D) trimodal variable; frequency
Unlock Deck
Unlock for access to all 51 flashcards in this deck.
Unlock Deck
k this deck
18
The extent to which cases are spread out through the distribution or clustered in one location is known as ______.
A) skewness
B) frequency
C) variability
D) median
A) skewness
B) frequency
C) variability
D) median
Unlock Deck
Unlock for access to all 51 flashcards in this deck.
Unlock Deck
k this deck
19
Margaret is analyzing data and sees that the majority of the cases in her study are clustered at one or the other end of the distribution. Margaret has discovered ______.
A) skewness
B) variability
C) probability
D) distribution
A) skewness
B) variability
C) probability
D) distribution
Unlock Deck
Unlock for access to all 51 flashcards in this deck.
Unlock Deck
k this deck
20
The mean is also the ______.
A) arithmetic average
B) percentage of cases
C) actual quantity
D) median
A) arithmetic average
B) percentage of cases
C) actual quantity
D) median
Unlock Deck
Unlock for access to all 51 flashcards in this deck.
Unlock Deck
k this deck
21
Which of the following should have the most influence on the choice to use the median or mean for summarizing the central tendency of quantitative variables?
A) hypothesis of the researcher
B) purpose of the statistical study
C) number of study participants
D) analysts preferred methodology
A) hypothesis of the researcher
B) purpose of the statistical study
C) number of study participants
D) analysts preferred methodology
Unlock Deck
Unlock for access to all 51 flashcards in this deck.
Unlock Deck
k this deck
22
When is it inappropriate to use either the median or mean as a measure of central tendency?
A) when variables are measured at the nominal level
B) when variables are expressed through graphs at the ordinal and nominal levels
C) when researchers are examining multiple variables
D) when the mode has been previously established
A) when variables are measured at the nominal level
B) when variables are expressed through graphs at the ordinal and nominal levels
C) when researchers are examining multiple variables
D) when the mode has been previously established
Unlock Deck
Unlock for access to all 51 flashcards in this deck.
Unlock Deck
k this deck
23
______ is/are a popular measure of variation.
A) Frequency distribution
B) Mean
C) Standard deviation
D) Outliers
A) Frequency distribution
B) Mean
C) Standard deviation
D) Outliers
Unlock Deck
Unlock for access to all 51 flashcards in this deck.
Unlock Deck
k this deck
24
The ______ accounts for the amount each case differs from the mean.
A) frequency distribution
B) standard deviation
C) range
D) normal distribution
A) frequency distribution
B) standard deviation
C) range
D) normal distribution
Unlock Deck
Unlock for access to all 51 flashcards in this deck.
Unlock Deck
k this deck
25
Waldon is analyzing data on grade distributions at Canadian universities. He has discovered one extremely low set of values. These exceptionally low values represent a(n) ______ in his data.
A) range
B) quadrant
C) outlier
D) normal distribution
A) range
B) quadrant
C) outlier
D) normal distribution
Unlock Deck
Unlock for access to all 51 flashcards in this deck.
Unlock Deck
k this deck
26
A normal distribution will appear like a ______ when visualized.
A) bell shape
B) bar graph
C) outlier
D) hierarchy
A) bell shape
B) bar graph
C) outlier
D) hierarchy
Unlock Deck
Unlock for access to all 51 flashcards in this deck.
Unlock Deck
k this deck
27
What do cross-tabulations illustrate?
A) the relations between two variables
B) the frequency of distributions
C) attitudinal data
D) percentages of participation
A) the relations between two variables
B) the frequency of distributions
C) attitudinal data
D) percentages of participation
Unlock Deck
Unlock for access to all 51 flashcards in this deck.
Unlock Deck
k this deck
28
To calculate range, a data analyst must take the highest value and ______ 1.
A) subtract the lowest value and add
B) multiply by the lowest value and add
C) divide by the lowest value and subtract
D) discard the lowest value and subtract
A) subtract the lowest value and add
B) multiply by the lowest value and add
C) divide by the lowest value and subtract
D) discard the lowest value and subtract
Unlock Deck
Unlock for access to all 51 flashcards in this deck.
Unlock Deck
k this deck
29
Which of the following statements about standard deviation is true?
A) It accounts for the amount by which each case is similar to the mode.
B) It predicts the impacts of findings on additional variables.
C) It accounts for the amount by which each case differs from the mean.
D) It predicts the difference between the first quartile and the third quartile.
A) It accounts for the amount by which each case is similar to the mode.
B) It predicts the impacts of findings on additional variables.
C) It accounts for the amount by which each case differs from the mean.
D) It predicts the difference between the first quartile and the third quartile.
Unlock Deck
Unlock for access to all 51 flashcards in this deck.
Unlock Deck
k this deck
30
What is variance?
A) the square of standard deviation
B) the difference between standard deviation and range
C) another term for normal distribution
D) a rarely used measure of variation
A) the square of standard deviation
B) the difference between standard deviation and range
C) another term for normal distribution
D) a rarely used measure of variation
Unlock Deck
Unlock for access to all 51 flashcards in this deck.
Unlock Deck
k this deck
31
To illustrate the relation between two variables, such as attitude about employment discrimination against men and year, the analyst should use which of the following?
A) quartiles
B) crosstabs
C) normal distribution
D) outliers
A) quartiles
B) crosstabs
C) normal distribution
D) outliers
Unlock Deck
Unlock for access to all 51 flashcards in this deck.
Unlock Deck
k this deck
32
How do you read a cross tabulation table?
A) compare the percentage distribution in each column
B) generate multiple histograms
C) begin by creating many categories for analysis as possible
D) convert frequencies into percentages of 10
A) compare the percentage distribution in each column
B) generate multiple histograms
C) begin by creating many categories for analysis as possible
D) convert frequencies into percentages of 10
Unlock Deck
Unlock for access to all 51 flashcards in this deck.
Unlock Deck
k this deck
33
When reading a crosstab table, the ______ is/are on the right.
A) test hypothesis
B) variables
C) marginal distributions
D) association range
A) test hypothesis
B) variables
C) marginal distributions
D) association range
Unlock Deck
Unlock for access to all 51 flashcards in this deck.
Unlock Deck
k this deck
34
Elizabeth has established that the association between the variables she is analyzing is not likely the result of chance. In other words, she has established ______.
A) chi-square
B) statistical significance
C) range
D) reliability
A) chi-square
B) statistical significance
C) range
D) reliability
Unlock Deck
Unlock for access to all 51 flashcards in this deck.
Unlock Deck
k this deck
35
Which of the following statements is most accurate?
A) Statistics are the preferred method for communicating information as statistics cannot be misleading.
B) Researchers use quantitative methods of data analysis only when they will prove the original hypothesis.
C) Statistics can mislead when specific reports are chosen to accentuate particular features of a distribution.
D) Establishing statistical significance is only required when examining attitudinal data.
Unlock Deck
Unlock for access to all 51 flashcards in this deck.
Unlock Deck
k this deck
36
Honesty and ______ are the key ethical principles that should guide data summaries.
A) generalizability
B) cultural awareness
C) variety
D) openness
A) generalizability
B) cultural awareness
C) variety
D) openness
Unlock Deck
Unlock for access to all 51 flashcards in this deck.
Unlock Deck
k this deck
37
When we summarize a distribution in a single number, we are ______.
A) typically gaining a complete picture of the distribution
B) losing much information
C) fully meeting requirements for openness and honesty
D) offering summary statistics
A) typically gaining a complete picture of the distribution
B) losing much information
C) fully meeting requirements for openness and honesty
D) offering summary statistics
Unlock Deck
Unlock for access to all 51 flashcards in this deck.
Unlock Deck
k this deck
38
It is legitimate to represent the central tendency of a variable measured at the ordinal level with the mean.
Unlock Deck
Unlock for access to all 51 flashcards in this deck.
Unlock Deck
k this deck
39
The median is the most suited to measure the central tendency of variables measured at the ordinal level.
Unlock Deck
Unlock for access to all 51 flashcards in this deck.
Unlock Deck
k this deck
40
A summary of distributions can be made completely based on the central tendency.
Unlock Deck
Unlock for access to all 51 flashcards in this deck.
Unlock Deck
k this deck
41
A normal distribution should result in a symmetrical bell-shaped distribution pattern.
Unlock Deck
Unlock for access to all 51 flashcards in this deck.
Unlock Deck
k this deck
42
Chi-square is the most often applied cross-tabular analysis.
Unlock Deck
Unlock for access to all 51 flashcards in this deck.
Unlock Deck
k this deck
43
Summary statistics are not useful in representing key features of the distribution of a variable.
Unlock Deck
Unlock for access to all 51 flashcards in this deck.
Unlock Deck
k this deck
44
Skewness only applies to qualitative variables measured at the nominal level.
Unlock Deck
Unlock for access to all 51 flashcards in this deck.
Unlock Deck
k this deck
45
It is appropriate for an analysist to choose statistics that accentuate a particular feature of a distribution.
Unlock Deck
Unlock for access to all 51 flashcards in this deck.
Unlock Deck
k this deck
46
Central tendency combined with variation describes a distribution's overall shape.
Unlock Deck
Unlock for access to all 51 flashcards in this deck.
Unlock Deck
k this deck
47
Describe the different types of graphs utilized by quantitative researchers. When graphs are appropriate for the display of data. How can graphs potentially distort the display of information? Why must researchers work to avoid these issues?
Unlock Deck
Unlock for access to all 51 flashcards in this deck.
Unlock Deck
k this deck
48
Identify and describe the three key summary statistics employed by quantitative researchers. Briefly describe each and explain what information it provides researchers and how this is essential to quality data collection and analysis.
Unlock Deck
Unlock for access to all 51 flashcards in this deck.
Unlock Deck
k this deck
49
Under what circumstances should you consider grouping categories in a frequency distribution? What special considerations must one take when creating categories? How might using categories inappropriately impact findings?
Unlock Deck
Unlock for access to all 51 flashcards in this deck.
Unlock Deck
k this deck
50
Describe how you should read the following table. In your discretion be careful to name the parts of the chart and establish what each tells us about the data.
Source: General Social Survey (National Opinion Research Center 2018).
Age of respondent * Women not suited for politics Crosstabulation
Source: General Social Survey (National Opinion Research Center 2018).
Age of respondent * Women not suited for politics Crosstabulation
Unlock Deck
Unlock for access to all 51 flashcards in this deck.
Unlock Deck
k this deck
51
What factors must a researcher consider when analyzing data ethically? In other words, explain how data should be ethically collected and presented. Discuss the ramifications of the unethical collection or presentation of statistical data.
Unlock Deck
Unlock for access to all 51 flashcards in this deck.
Unlock Deck
k this deck
Unlock Deck
Unlock for access to all 51 flashcards in this deck.


